. 2023 Nov 3;7(1):e202302175.
doi: 10.26508/lsa.202302175. Print 2024 Jan.

Clathrin light chains CLCa and CLCb have non-redundant roles in epithelial lumen formation

Affiliations

Clathrin light chains CLCa and CLCb have non-redundant roles in epithelial lumen formation

Yu Chen et al. Life Sci Alliance. .

Abstract

To identify functional differences between vertebrate clathrin light chains (CLCa or CLCb), phenotypes of mice lacking genes encoding either isoform were characterised. Mice without CLCa displayed 50% neonatal mortality, reduced body weight, reduced fertility, and ∼40% of aged females developed uterine pyometra. Mice lacking CLCb displayed a less severe weight reduction phenotype compared with those lacking CLCa and had no survival or reproductive system defects. Analysis of female mice lacking CLCa that developed pyometra revealed ectopic expression of epithelial differentiation markers (FOXA2 and K14) and a reduced number of endometrial glands, indicating defects in the lumenal epithelium. Defects in lumen formation and polarity of epithelial cysts derived from uterine or gut cell lines were also observed when either CLCa or CLCb were depleted, with more severe effects from CLCa depletion. In cysts, the CLC isoforms had different distributions relative to each other, although they converge in tissue. Together, these findings suggest differential and cooperative roles for CLC isoforms in epithelial lumen formation, with a dominant function for CLCa.


Conflict of interest statement

The authors declare that they have no conflict of interest.

Figures
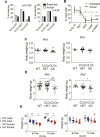
Figure 1.
Figure 1.. Survival and body weight of mice lacking genes encoding CLCa and CLCb.
(A) Breeding cages with Clta+/− × Clta+/− or Cltb+/− × Cltb+/− parental genotypes were established and the genotype of offspring analysed at weaning (3 wk old). Expected and observed percentages for the genotypes Clta+/+ (CLCa WT), Clta+/− (CLCa HET), Clta−/− (CLCa KO), Cltb +/+ (CLCb WT), Cltb +/− (CLCb HET), Cltb −/− (CLCb KO) are shown. Number of mice analysed: CLCa WT = 303, CLCa HET = 589, CLCa KO = 96, total = 988; CLCb WT = 181, CLCb HET = 344, CLCb KO = 163, total = 688. P-values generated by Chi Square analysis comparing the observed genotype percentage of the mice with the expected Mendelian ratios. (B) Genotype analysis of CLCa KO mice at developmental stages following Clta+/− × Clta+/− breeding crosses. The percentage of Clta−/− mice per litter at E18.5 (n = 8 litters), post-natal day 1 (PN1, n = 5 litters), PN3 (n = 7 litters), 1 wk-PN7 (n = 5 litters), and 4 wk old (n = 52 litters) is shown. *P < 0.05, ****P < 0.0001, Fisher’s exact test. (C, D) Body weight of mice from Clta+/− × Clta+/− or Cltb+/− × Cltb+/− breeding crosses at PN1 (C) and PN7 (D) is shown in grams (g) for the indicated genotypes. Number of mice measured: Clta+/− × Clta+/− breeding crosses (PN1 = 41; PN7 = 83) and Cltb+/− × Cltb+/− breeding crosses (PN1 = 35; PN7 = 47). *P < 0.05, **P < 0.01, one-way ANOVA test, with Holm-Sidak’s multiple comparison. (E) Body weight of adult male and female mice (aged 8–16 or 17–24 wk) for WT or homozygous KO genotypes from Clta+/− × Clta+/− (CLCa) or Cltb+/− × Cltb+/− (CLCb) breeding crosses. Number of mice measured from Clta+/− × Clta+/− crosses: aged 8–16 wk (CLCa WT male = 30, CLCa KO male = 13, CLCa WT female = 17, CLCa KO female = 12); aged 17–24 wk (CLCa WT male = 8, CLCa KO male = 7, CLCa WT female = 12, CLCa KO female = 11). Number of mice from Cltb+/− × Cltb+/− crosses: aged 8–16 wk (CLCb WT male = 14, CLCb KO male = 9, CLCb WT female = 10, CLCb KO female = 10); aged 17–24 wk (CLCb WT male = 10, CLCb KO male = 14, CLCb WT female = 9, CLCb KO female = 12). *P < 0.05, **P < 0.01, ****P < 0.0001, two-way ANOVA test, with Holm-Sidak’s multiple comparison.
Figure S1.
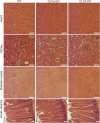
Figure S1.. H&E staining of tissue from CLCa KO, CLCb KO, or WT mice.
Tissue from the heart, kidney, skeletal muscle, and small intestine of adult WT, CLCa KO, or CLCb KO mice was fixed with PFA and stained with H&E. Images shown are representative bright-field images of at least three mice of each genotype. Scale bar = 50 μm.
Figure 2.
Figure 2.. Fertility of mice lacking genes encoding CLCa and CLCb.
(A, B) Breeding cages containing male and female mice with the indicated genotypes Clta+/+ (aWT), Clta+/− (aHET), Clta−/− (aKO), Cltb +/+, (bWT), Cltb +/− (bHET), Cltb −/− (bKO) were established and the number of litters born within 54 d (A) or 4 mo (B) recorded. Each dot represents the number of litters generated by each breeding pair. Bars represent mean ± SEM, *P < 0.05, **P < 0.01, not significant (ns) compared with WT control, one-way ANOVA test, with Holm-Sidak’s multiple comparison. (C) Breeding cages containing male and female mice with the indicated genotypes were established for 4 mo and the number of pups per litter recorded. Graph shows mean ± SEM, one-way ANOVA test, with Holm-Sidak’s multiple comparison.
Figure 3.
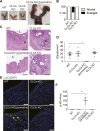
Figure 3.. CLCa KO female mice develop pyometra.
(A) Images of the uterus from WT, CLCa KO (unaffected), and CLCb KO mice and a CLCa KO mouse with pyometra. Scale bar = 1 cm. (B) The percentage of WT, CLCa KO, and CLCb KO female mice that developed an enlarged uterus after 4 mo of age. n = 31 per genotype. (C) H&E staining of the uterus from WT, CLCa KO, and CLCb KO mice and a CLCa KO mouse with pyometra. Images shown are the representative cross-sectioned images of at least three mice in each genotype or condition. L = lumen, G = glands. Scale bar = 250 μm. (D) Number of glands per area (millimeter2) of uterine tissue cross-section from WT, CLCa KO, CLCa KO with pyometra, and CLCb KO mice. Graph shows mean ± SEM. Number of mice analysed (one section per animal): WT = 8; CLCa KO (unaffected) = 4; CLCa KO (pyometra) = 3; CLCb KO = 6. *P < 0.05, one-way ANOVA with Holm-Sidak’s multiple comparison. (E) Slices of uterine tissue of the indicated genotype were fixed and stained with antibody against the Ly6G neutrophil marker for inflammation. Arrows indicate Ly6G-positive cells. Nuclei were stained with DAPI (blue). Scale bar = 25 μm. (F) Quantification of the number of Ly6G-expressing cells per millimeter2 tissue. Each dot represents the average number of Ly6G-expressing cells in endometrial tissue of one mouse. At least two confocal images were counted per mouse. Graph displays mean ± SEM; Number of mice analysed: WT = 6; CLCa KO (unaffected) = 3; CLCa KO (pyometra) = 3; CLCb KO = 3. **P < 0.01, one-way ANOVA test, with Holm-Sidak’s multiple comparison.
Figure 4.
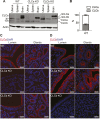
Figure 4.. Expression and localisation of CLCa and CLCb in the uterus.
(A) Tissue lysates (50 μg of protein) from the uterus, spleen, and brain of WT, CLCa KO, or CLCb KO mice were analysed by SDS–PAGE and the levels of CLC isoforms compared by immunoblotting (upper panel, CLCs) using the antibody CON.1 that recognises the consensus sequence shared by CLCa and CLCb and their neuronal splice variants nCLCa and nCLCb. Migration positions of the CLC isoforms are shown right and for molecular mass marker in kilodaltons (kDa) is shown left. The lower panel shows the same samples immunoblotted for actin. (B) Quantification of the amount of CLCa and CLCb found in the in the uterus of WT mice by immunoblotting, shown as a percentage of the total CLC level. n = 3. (C, D) Slices of uterine tissue of the indicated genotype were fixed and stained with antibodies against CLCa (C) or CLCb (D), both shown in red. Nuclei were stained with DAPI (blue). Representative images of endometrial lumen and glands are shown. Scale bar = 25 μm.
Figure 5.
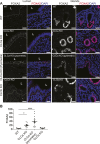
Figure 5.. FOXA2 is ectopically expressed in lumenal cells of the endometrium epithelium in CLCa KO mice.
(A) Immunostaining for FOXA2 in endometrium from WT, CLCa KO (± pyometra), or CLCb KO mice. Slices of uterine tissue of the indicated genotype and phenotype were fixed and stained with antibodies against FOXA2 (pink in merge). Nuclei were stained with DAPI (blue). The dotted line shows the boundary between the lumenal epithelium and the rest of the endometrium and the position of the lumen (L) is indicated. Representative images of endometrial lumen and glands are shown. Scale bar = 25 μm. (B) Mean fluorescence intensity for FOXA2 in cells of the lumenal epithelium. Each dot represents the average mean fluorescence intensity of the masked nuclear region of all lumenal cells in one confocal image as assessed by Image J. Three images were analysed per animal. Graph displays mean ± SEM; number of mice analysed: WT = 5; CLCa KO (unaffected) = 3; CLCa KO (pyometra) = 4; CLCb KO = 3. *P < 0.05, ****P < 0.0001 on one-way ANOVA test, with Holm-Sidak’s multiple comparison.
Figure S2.
Figure S2.. Expression of SOX9, Ki-67, and β-catenin in CLCa KO or CLCb KO endometrium.
(A) Immunostaining for Sox9 in the endometrium of WT, CLCa KO, or CLCb KO mice. Slices of uterine tissue of the indicated genotype were fixed and stained with antibodies against Sox9 (green). Nuclei were stained with DAPI (blue). Scale bar = 25 μm. (B) Immunostaining for Ki67 in the endometrium of WT, CLCa KO, or CLCb KO mice. Slices of uterine tissue of the indicated genotype were fixed and stained with antibodies against Ki67 (green) and β-catenin (β-Cat, red). Nuclei were stained with DAPI (blue). Scale bar = 25 μm. (C) Quantification of the percentage of uterine lumenal epithelial cells that express Ki67 as determined by immunostaining. Each dot represents the average percentage of Ki-67 positive endometrial epithelial cells in a single mouse and two to six confocal images were analysed per mouse. Number of mice analysed: WT = 7; CLCa KO = 3; CLCa KO (pyometra) = 3; CLCb KO = 3. Graph shows mean ± SEM. A one-way ANOVA test, with Holm-Sidak’s multiple comparison, was performed, with no significant differences between genotypes and phenotypes.
Figure 6.
Figure 6.. The stratified epithelial marker K14 is ectopically expressed in the endometrium of a subset of CLCa KO mice with pyometra.
(A) Immunostaining for K14 in the endometrium of WT, CLCa KO, or CLCb KO mice. Slices of uterine tissue of the indicated genotype were fixed and stained with antibody against K14 (red). Nuclei were stained with DAPI (blue). Scale bar = 25 μm. (B) Quantification of the percentage of mice for each genotype that had uterine lumenal epithelial cells expressing K14 (K14+) or did not have any uterine epithelial cells expressing K14 (K14−) as determined by immunostaining. One section per mouse. Number of mice analysed: WT = 8; CLCa KO = 4; CLCa KO (pyometra) = 5; CLCb KO = 5.
Figure S3.
Figure S3.. Transcription of FOXA2 target genes.
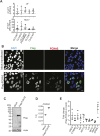
(A) RT-qPCR analysis of FOXA2 target gene Ltf and Muc1 transcript levels in mouse uterine tissue from CLCa WT, CLCa KO, CLCa KO with pyometra, CLCb WT or CLCb KO mice. Relative level of Ltf or Muc1 compared with the control gene Hprt is shown. Each dot represents an individual mouse. Uterine tissue from at least three mice was analysed for each genotype. (B) HeLa cells mock transfected (no DNA) or transfected with Flag–FOXA2 for 24 h were fixed and immunostained with antibodies against the Flag-tag (green) or FOXA2 (red) and imaged by immunofluorescence. Nuclei are labelled with DAPI (blue). Scale bar = 10 mm. (C) HeLa cells mock transfected (no DNA) or transfected with Flag–FOXA2 for 24 h were lysed and analysed by immunoblotting with antibodies against the Flag-tag and actin. The migration position of molecular mass markers is shown at the left in kilodaltons (kD). (D) RT-qPCR analysis of FOXA2 transcript levels from HeLa cells mock-transfected (no DNA) or transfected with Flag–FOXA2 for 24 h. One over threshold cycle (Ct) is shown. n = 3. One mock-transfected sample showed no detectable signal (no point shown). (E) RT-qPCR analysis of the indicated FOXA2 target gene transcript levels in HeLa cells that were mock-transfected (no DNA) or transfected with Flag–FOXA2 for 24 h. Transcript levels were normalised to the housekeeping gene GAPDH. The fold change in transcript levels between mock-transfected samples and Flag–FOXA2-transfected samples is shown.
Figure S4.
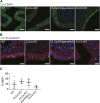
Figure S4.. Expression of E-cadherin, ZO-1, and mucin 1 in CLCa KO or CLCb KO endometrium.
Immunostaining for E-cadherin, ZO-1, or mucin 1 in cross-sections of uteri from WT, CLCa KO, and CLCb KO female mice. (A, B, C) Slices of uterine tissue of the indicated genotype were fixed and stained with antibodies against (A) E-cadherin (E-Cad, red), (B) ZO-1 (green), and (C) mucin 1 (red). Images shown are representative confocal images of at least two mice for each genotype. Nuclei were stained with DAPI (blue). Location of the uterine lumen (L) is shown. Scale bar = 25 μm.
Figure S5.
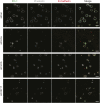
Figure S5.. Knockdown efficiency in Ishikawa and Caco-2 cysts.
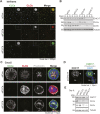
(A) Ishikawa cells were transfected with siRNA to deplete CLCa (siCLCa), CLCb (siCLCb), or with control siRNA (siCon). 72 h after siRNA transfection, cells were trypsinised and seeded as single cells in Matrigel and grown for 6 d to allow cyst formation. Cysts were treated with cholera toxin for the final 24 h. Cysts were fixed and immunostained with antibodies against CLCa (green in merge) and CLCb (red in merge). F-actin and nuclei were stained with phalloidin (grey) and DAPI (blue), respectively, in merged images. Scale bar = 200 μm. (B) Ishikawa cells were transfected with siRNA to deplete CLCa (siCLCa), CLCb (siCLCb), CHC17 (siCHC17), or with control siRNA (siCon). Cells were lysed 3, 7, and 9 d post siRNA treated (corresponding to 0, 4, and 6 d of cysts growth, respectively). Lysates were analysed by immunoblotting with antibodies against CHC17, CLCa, CLCb, and tubulin, indicated at the right. Numbers on left indicate migration positions of molecular weight markers in kilodaltons. (C) Caco-2 cells were transfected with siRNA to deplete CLCa (siCLCa), CLCb (siCLCb), or with control siRNA (siCon). 72 h after siRNA transfection, cells were trypsinised and seeded as single cells in Matrigel and grown for 6 d to allow cyst formation. Cysts were fixed and immunostained with antibodies against CLCa (green in merge) and CLCb (red in merge), as well as the F-actin stain phalloidin (grey in merge). Nuclei were stained with DAPI (blue) in merged images. Scale bar = 10 μm. (D) Caco-2 cells were transfected with siRNA to deplete CHC17. 72 h after siRNA transfection, cells were trypsinised and seeded as single cells in Matrigel and grown for 6 d to allow cyst formation. Cysts were fixed and immunostained with antibodies against CHC17 (green in merge). F-actin and nuclei were stained with phalloidin (grey) and DAPI (blue), respectively, in merged image. Solid arrowhead indicates a cyst that formed from a cell that was not depleted of CHC17, whereas the open arrowhead indicated a cyst that developed from a cell that was depleted of CHC17. Scale bar = 10 μm. (E) Caco-2 cells were transfected with siRNA to deplete CLCa (siCLCa), CLCb (siCLCb), CHC17 (siCHC17), or with control siRNA (siCon). Cells were lysed 72 h post siRNA treatment. Lysates were analysed by immunoblotting with antibodies against CHC17, CLCa, CLCb, and tubulin. Numbers on left indicate migration position of molecular mass markers in kilodaltons (kD).
Figure 7.
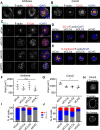
Figure 7.. Acute depletion of CLCa or CLCb in Ishikawa and Caco-2 cells disrupts epithelial cyst formation and polarisation.
(A, B) Ishikawa (A) or Caco-2 (B) cells were seeded as single cells in Matrigel and grown for 6 d to allow cyst formation. Cysts were treated with cholera toxin for the final 24 h to expand the lumens for visualisation. Cysts were fixed and immunostained with antibodies against CLCa (green in merge) and CLCb (red in merge). F-actin and nuclei were stained with phalloidin (grey) and DAPI (blue), respectively. Scale bar 10 μm. (C, D, E) Ishikawa (C) or Caco-2 (D, E) cells were transfected with siRNA to deplete CLCa (siCLCa), CLCb (siCLCb), or CHC17 (siCHC), or with control siRNA (siCon). 72 h after siRNA transfection, cells were trypsinised and seeded as single cells in Matrigel and grown for 4 d to allow cyst formation. Cysts were fixed and immunostained with antibodies against ZO-1 (green in (C), red in (D)) and E-cadherin (red in (C, E) merge). F-actin and nuclei were stained with phalloidin (grey) and DAPI (blue), respectively. Scale bar = 10 μm. (F, G) Ishikawa (F) or Caco-2 (G) cells were transfected with siRNA to deplete CLCa (siCLCa), CLCb (siCLCb), or CHC17 (siCHC), or with control siRNA (siCon). 72 h after siRNA transfection, cells were trypsinised and seeded as single cells in Matrigel and grown for 4 d to allow cyst formation before fixation. The cross-sectional area of cysts was visualised with antibodies against E-cadherin and the F-actin stain phalloidin and measured using ImageJ software. Each dot represents the average size of over 100 cysts from a single experiment. *P = 0.0317, one-way ANOVA. Number of experiments performed: Ishikawa cysts = 4; Caco-2 cysts = 3. (H, I, J) Ishikawa or Caco-2 cells were transfected with siRNA to deplete CLCa (siCLCa), CLCb (siCLCb), or CHC17 (siCHC), or with control siRNA (siCon). 72 h after siRNA transfection, cells were trypsinised and seeded as single cells within Matrigel and grown for 6 d to allow cyst formation. Cysts were treated with cholera toxin for the final 24 h to expand the lumens for visualisation. Cysts were fixed and lumens visualised with the F-actin stain phalloidin. Representative images of Caco-2 cysts with multiple lumens, a single lumen or no lumen, scale bar 10 μm (H). Percentage of Ishikawa cysts with the indicated number of lumens (0, 1, >1), error bars show SEM (n = 3) (I). Percentage of Caco-2 cysts with the indicated number of lumens, error bars show SEM (n = 3) (J). ****P > 0.0001, two-way ANOVA.
Figure S6.
Figure S6.. ZO-1 and E-cadherin in 6-d cysts following clathrin subunit depletion.
Caco-2 cells were transfected with siRNA to deplete CLCa (siCLCa), CLCb (siCLCb), or CHC17 (siCHC), or with control siRNA (siCon). 72 h after siRNA transfection, cells were trypsinised and seeded as single cells within Matrigel and grown for 6 d to allow cyst formation. Cysts were treated with cholera toxin for the final 24 h to expand the lumens for visualisation. Cysts were fixed immuostained for the polarity markers ZO-1 (green in merge) and E-cadherin (red in merge) and with the F-actin stain phalloidin (grey in merge). Nuclei were stained with DAPI (blue) in merged images. Scale bar = 10 μm.

Similar articles

Cited by

References

    1. Briant K, Redlingshöfer L, Brodsky FM (2020) Clathrin's life beyond 40: Connecting biochemistry with physiology and disease. Curr Opin Cell Biol 65: 141–149. 10.1016/j.ceb.2020.06.004 - DOI - PubMed
    1. Gould GW, Brodsky FM, Bryant NJ (2020) Building GLUT4 vesicles: CHC22 clathrin’s human touch. Trends Cell Biol 30: 705–719. 10.1016/j.tcb.2020.05.007 - DOI - PubMed
    1. Soykan T, Maritzen T, Haucke V (2016) Modes and mechanisms of synaptic vesicle recycling. Curr Opin Neurobiol 39: 17–23. 10.1016/j.conb.2016.03.005 - DOI - PubMed
    1. Brodsky FM (2012) Diversity of clathrin function: New tricks for an old protein. Annu Rev Cell Dev Biol 28: 309–336. 10.1146/annurev-cellbio-101011-155716 - DOI - PubMed
    1. Kaksonen M, Roux A (2018) Mechanisms of clathrin-mediated endocytosis. Nat Rev Mol Cell Biol 19: 313–326. 10.1038/nrm.2017.132 - DOI - PubMed

Publication types