. 2023 Nov 3;14(1):7062.
doi: 10.1038/s41467-023-42440-x.

Aerosol delivery of SARS-CoV-2 human monoclonal antibodies in macaques limits viral replication and lung pathology

Affiliations

Aerosol delivery of SARS-CoV-2 human monoclonal antibodies in macaques limits viral replication and lung pathology

Daniel N Streblow et al. Nat Commun. .

Abstract

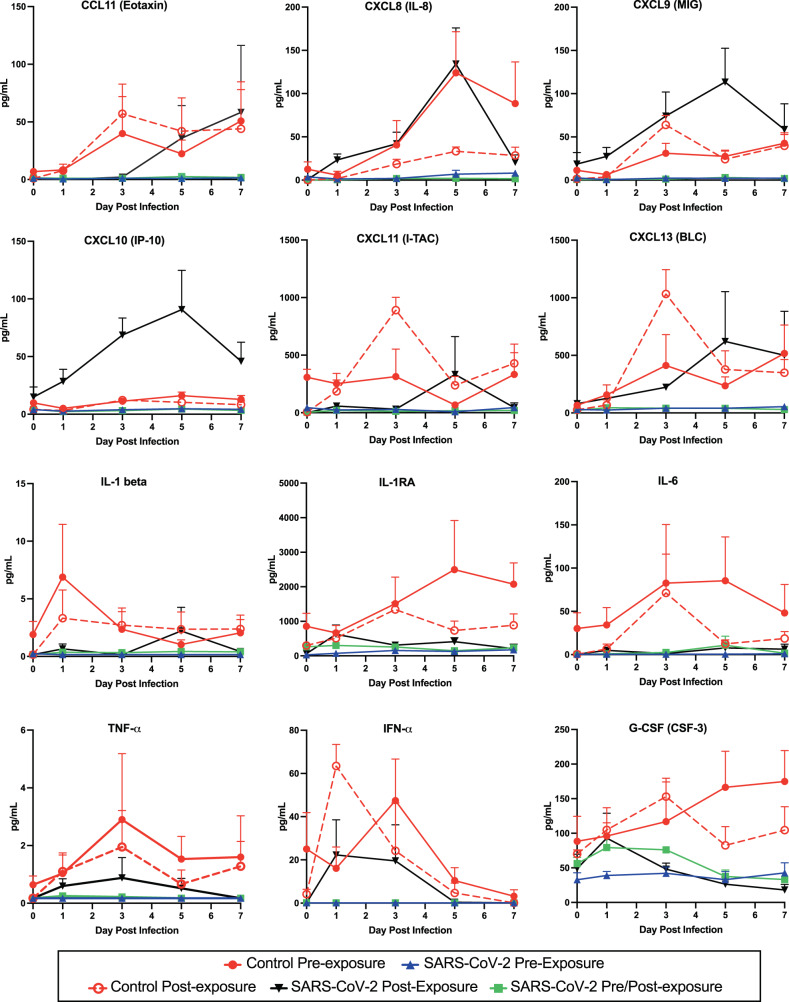
Passively administered monoclonal antibodies (mAbs) given before or after viral infection can prevent or blunt disease. Here, we examine the efficacy of aerosol mAb delivery to prevent infection and disease in rhesus macaques inoculated with the severe acute respiratory syndrome coronavirus 2 (SARS-CoV-2) Delta variant via intranasal and intratracheal routes. SARS-CoV-2 human mAbs or a human mAb directed to respiratory syncytial virus (RSV) are nebulized and delivered using positive airflow via facemask to sedated macaques pre- and post-infection. Nebulized human mAbs are detectable in nasal, oropharyngeal, and bronchoalveolar lavage (BAL) samples. SARS-CoV-2 mAb treatment significantly reduces levels of SARS-CoV-2 viral RNA and infectious virus in the upper and lower respiratory tracts relative to controls. Reductions in lung and BAL virus levels correspond to reduced BAL inflammatory cytokines and lung pathology. Aerosolized antibody therapy for SARS-CoV-2 could be effective for reducing viral burden and limiting disease severity.


Conflict of interest statement

M.R.W., L.M.-S., and J.J.K. are co-inventors on patents that include claims related to the mAbs described. L.M.B. is Co-Founder and Managing Director of Zalgen Labs. He receives remuneration from the company. The remaining authors declare no competing interests.

Figures

Fig. 1
Fig. 1. Summary of study design and detection of inhaled aerosolized mAbs in BAL samples.
a Study design and timeline for experiments involving 5 treatment groups of rhesus macaques (n = 4 per group). The animals were infected with the SARS-CoV-2 Delta strain by the intranasal and intratracheal routes. Blood, BAL and swab samples were collected at the indicated times, and the animals were euthanized for necropsy at 7 dpi. The Control and SARS-CoV-2 Pre-Exposure Groups each received a single administration of 60 mg (~15 mg/kg) nebulized antibody (anti-RSV control or anti-SARS-CoV-2 mAb cocktail, respectively) at approximately 5.8 mg/kg of inhaled dose at 6 h prior to challenge. The Control Post-Exposure group received a single administration of 60 mg aerosolized, inhaled anti-RSV control antibody at 24 h post-challenge dosed at approximately 5.8 mg/kg of inhaled dose. The SARS-CoV-2 Post-Exposure group received two administrations of 60 mg nebulized anti-SARS-CoV-2 mAb cocktail dosed at 5.8 mg/kg at 24 and 48 h post challenge. SARS-CoV-2 Pre/Post-Exposure Group received three administrations of aerosolized, inhaled anti-SARS-CoV-2 mAb cocktail at 6 h pre challenge and at 24 and 48 h post challenge. b Qualitative measures of mAb in BAL were determined from clarified samples from each animal in the group collected at 0, 1, 3, 5, and 7 dpi using antigen-specific quantitative ELISA. Arrows indicate timing of aerosolized, inhaled mAb treatment for each group. Symbols refer to the four different animals in each group, and colors were assigned as follows: solid red = Control Pre-Exp group; solid blue = SARS-CoV-2 Pre-Exp group; open red = Control Post-Exp group; solid black = SARS-CoV-2 Post-Exp group; and solid green = SARS-CoV-2 Pre/Post-Exp group. Source data are provided as a Source Data file.
Fig. 2
Fig. 2. Inhaled aerosolized anti-SARS-CoV-2 mAb treatment reduces SARS-CoV-2 in respiratory tract.
a SARS-CoV-2 viral RNA was quantified in BAL, NAS, and OP samples by qRT-PCR using a standard curve. Mean values ±Standard deviation (SD) for each cohort at each day post infection are shown. b Area under the curve (AUC) based on viral RNA levels was for determined each animal. Controls were considered as single cohort for this analysis. Individual values (symbols), mean AUC (bars), and SD (error bars) are shown. Statistical significance was determined by Tukey one-way ANOVA, comparing each group to controls. c Infectious virus in BAL, NAS, and OP was quantified by focus-forming assay. Mean values ± SD for each cohort at each day post infection are shown. d AUC (mean values ± SD) based on infectious titers was determined as above, and statistical significance was determined by Tukey one-way ANOVA. N = 4 biologically independent animals per group. Colors and symbols are: solid red circle, Control Pre-Exp group; solid blue triangle, SARS-CoV-2 Pre-Exp group; open red circle, Control Post-Exp group; solid black triangle, SARS-CoV-2 Post-Exp group; and solid green square, SARS-CoV-2 Pre/Post-Exp group. Exact P values are shown where greater than P = 0.05. Source data are provided as a Source Data file.
Fig. 3
Fig. 3. Inhaled aerosolized anti-SARS-CoV-2 mAb treatment blocks SARS-CoV-2 replication in lung tissues and limits viral spread.
a Graphical depiction of lung anatomy (upper left) and SARS-CoV-2 RNA detection levels in respiratory tract tissues. The graded scale shows the average relative copy number for each group (n = 4/group). Caudal lobes consistently have the highest level of virus detection across groups, but the SARS-CoV-2 mAb therapy reduces viral RNA levels relative to the control RSV mAb. be RNA was extracted from respiratory tract, heart and spinal cord tissues, and viral RNA levels were determined by qRT-PCR using SARS-CoV-2 specific primers and probes. Individual data points for each animal within each group (n = 4 biologically independent animals per group) are shown as are the mean and SEM for each group. Colors in the graphs are: solid red, Control Pre-Exp group; solid blue, SARS-CoV-2 Pre-Exp group; open red, Control Post-Exp group; gray, SARS-CoV-2 Post-Exp group; and solid green, SARS-CoV-2 Pre/Post-Exp group. Source data are provided as a Source Data file.
Fig. 4
Fig. 4. Inhaled aerosolized anti-SARS-CoV-2 mAb treatment prevents extensive lung tissue damage.
a Top row shows photographs of lungs at necropsy for representative animals from each of the 5 treatment groups. The additional rows of micrographs show representative tissue sections stained with hematoxylin and eosin (H&E) at the sub-gross level with higher magnification depicted below. The control mAb pre-exposure group had acute interstitial pneumonia (Grade 4 affecting ~50% of tissue section) with lung lobes mottled light and dark pink with focally extensive pulmonary edema in caudal lobes (green arrows) and regional lymphadenopathy. SARS-CoV-2 mAb Pre-exposure group had minimal interstitial pneumonia (Grade 1 affecting ~10% of tissue section) with mildly mottled light and dark pink lung lobes and mild regional lymphadenopathy. Control mAb post-exposure group exhibited moderate to severe interstitial pneumonia (Grade 4 affecting up to 50% of tissue section) with multiple foci of non-collapsing parenchyma most commonly observed in the caudal lung lobes (green arrow). SARS-CoV-2 mAb post-exposure group had minimal to moderate interstitial pneumonia (Grade 3 affecting ~10% of tissue section) with mottled light and dark pink areas present most abundantly in the caudal lung lobes (green arrow) with regional lymphadenomegaly. SARS-CoV-2 mAb Pre/Post-exposure group had minimal to mild interstitial pneumonia (Grade 2 affecting ~10% of tissue section) with mottled light and dark pink lung lobes that affected the caudal lung lobes primarily. Scale bar = 5 mm in middle panel photomicrographs except for the SARS-CoV-2 Pre-exposure group, which = 4 mm. Scale bar in bottom panel = 200 µm. b and c H&E staining of lung sections. Scale bars = 4 mm and 200 µm in the upper and lower images, respectively. b Necrotizing, fibrinous hemorrhagic pneumonia detected in over 50% of the tissue section from animal 38418 (control mAb pre-exposure). c Animal 38579 (SARS-CoV-2 mAb post-exposure), demonstrated necrotizing, fibrinous hemorrhagic pneumonia affecting ~10% of tissue section. d Semiquantitative scoring system was developed by assessing the interstitial cellularity of the alveolar septa as illustrated in Supplementary Fig 4. Individual data points for each animal (n = 4 animal per group) within each group are shown as the mean and SEM for each group.
Fig. 5
Fig. 5. Pulmonary immune activation following SARS-CoV-2 infection is blocked by inhaled aerosolized anti-SARS-CoV-2 mAb treatment.
Kinetic analysis of chemokine and cytokine production was quantified for clarified BAL samples using Luminex bead-based assays. Each graph represents data for one chemokine or cytokine, as labeled at the top of the graph. A protein standard curve was generated from a 7-point dilution series and used to calculate concentration. Individual data points for each animal (n = 4 individual animals per group) within each group are shown as the mean and SEM for each group at each timepoint. Colors in the graphs are: solid red circle, Control Pre-Exp group; solid blue triangle, SARS-CoV-2 Pre-Exp group; open red circle, Control Post-Exp group; black triangle, SARS-CoV-2 Post-Exp group; and solid green square, SARS-CoV-2 Pre/Post-Exp group. Source data are provided as a Source Data file.

Similar articles

  • SARS-CoV-2-neutralising monoclonal antibodies to prevent COVID-19.
    Hirsch C, Park YS, Piechotta V, Chai KL, Estcourt LJ, Monsef I, Salomon S, Wood EM, So-Osman C, McQuilten Z, Spinner CD, Malin JJ, Stegemann M, Skoetz N, Kreuzberger N. Hirsch C, et al. Cochrane Database Syst Rev. 2022 Jun 17;6(6):CD014945. doi: 10.1002/14651858.CD014945.pub2. Cochrane Database Syst Rev. 2022. PMID: 35713300 Free PMC article.
  • CCR2 Signaling Restricts SARS-CoV-2 Infection.
    Vanderheiden A, Thomas J, Soung AL, Davis-Gardner ME, Floyd K, Jin F, Cowan DA, Pellegrini K, Shi PY, Grakoui A, Klein RS, Bosinger SE, Kohlmeier JE, Menachery VD, Suthar MS. Vanderheiden A, et al. mBio. 2021 Dec 21;12(6):e0274921. doi: 10.1128/mBio.02749-21. Epub 2021 Nov 9. mBio. 2021. PMID: 34749524 Free PMC article.
  • Antibody tests for identification of current and past infection with SARS-CoV-2.
    Fox T, Geppert J, Dinnes J, Scandrett K, Bigio J, Sulis G, Hettiarachchi D, Mathangasinghe Y, Weeratunga P, Wickramasinghe D, Bergman H, Buckley BS, Probyn K, Sguassero Y, Davenport C, Cunningham J, Dittrich S, Emperador D, Hooft L, Leeflang MM, McInnes MD, Spijker R, Struyf T, Van den Bruel A, Verbakel JY, Takwoingi Y, Taylor-Phillips S, Deeks JJ; Cochrane COVID-19 Diagnostic Test Accuracy Group. Fox T, et al. Cochrane Database Syst Rev. 2022 Nov 17;11(11):CD013652. doi: 10.1002/14651858.CD013652.pub2. Cochrane Database Syst Rev. 2022. PMID: 36394900 Free PMC article.
  • Type I and Type III Interferons Restrict SARS-CoV-2 Infection of Human Airway Epithelial Cultures.
    Vanderheiden A, Ralfs P, Chirkova T, Upadhyay AA, Zimmerman MG, Bedoya S, Aoued H, Tharp GM, Pellegrini KL, Manfredi C, Sorscher E, Mainou B, Lobby JL, Kohlmeier JE, Lowen AC, Shi PY, Menachery VD, Anderson LJ, Grakoui A, Bosinger SE, Suthar MS. Vanderheiden A, et al. J Virol. 2020 Sep 15;94(19):e00985-20. doi: 10.1128/JVI.00985-20. Print 2020 Sep 15. J Virol. 2020. PMID: 32699094 Free PMC article.
  • The effect of sample site and collection procedure on identification of SARS-CoV-2 infection.
    Davenport C, Arevalo-Rodriguez I, Mateos-Haro M, Berhane S, Dinnes J, Spijker R, Buitrago-Garcia D, Ciapponi A, Takwoingi Y, Deeks JJ, Emperador D, Leeflang MMG, Van den Bruel A; Cochrane COVID-19 Diagnostic Test Accuracy Group. Davenport C, et al. Cochrane Database Syst Rev. 2024 Dec 16;12(12):CD014780. doi: 10.1002/14651858.CD014780. Cochrane Database Syst Rev. 2024. PMID: 39679851 Free PMC article.

Cited by

References

    1. Zhou P, et al. A pneumonia outbreak associated with a new coronavirus of probable bat origin. Nature. 2020;579:270–273. doi: 10.1038/s41586-020-2012-7. - DOI - PMC - PubMed
    1. Lam TT, et al. Identifying SARS-CoV-2-related coronaviruses in Malayan pangolins. Nature. 2020;583:282–285. doi: 10.1038/s41586-020-2169-0. - DOI - PubMed
    1. Wang Q, et al. Structural and functional basis of SARS-CoV-2 entry by using human ACE2. Cell. 2020;181:894–904.e899. doi: 10.1016/j.cell.2020.03.045. - DOI - PMC - PubMed
    1. Hoffmann M, et al. SARS-CoV-2 Cell entry depends on ACE2 and TMPRSS2 and is blocked by a clinically proven protease inhibitor. Cell. 2020;181:271–280.e278. doi: 10.1016/j.cell.2020.02.052. - DOI - PMC - PubMed
    1. Huang C, et al. Clinical features of patients infected with 2019 novel coronavirus in Wuhan, China. Lancet. 2020;395:497–506. doi: 10.1016/S0140-6736(20)30183-5. - DOI - PMC - PubMed

Publication types

Supplementary concepts