. 2023 Nov 3;14(1):7054.
doi: 10.1038/s41467-023-41651-6.

Specific heterozygous variants in MGP lead to endoplasmic reticulum stress and cause spondyloepiphyseal dysplasia

Affiliations

Specific heterozygous variants in MGP lead to endoplasmic reticulum stress and cause spondyloepiphyseal dysplasia

Ophélie Gourgas et al. Nat Commun. .

Erratum in

Abstract

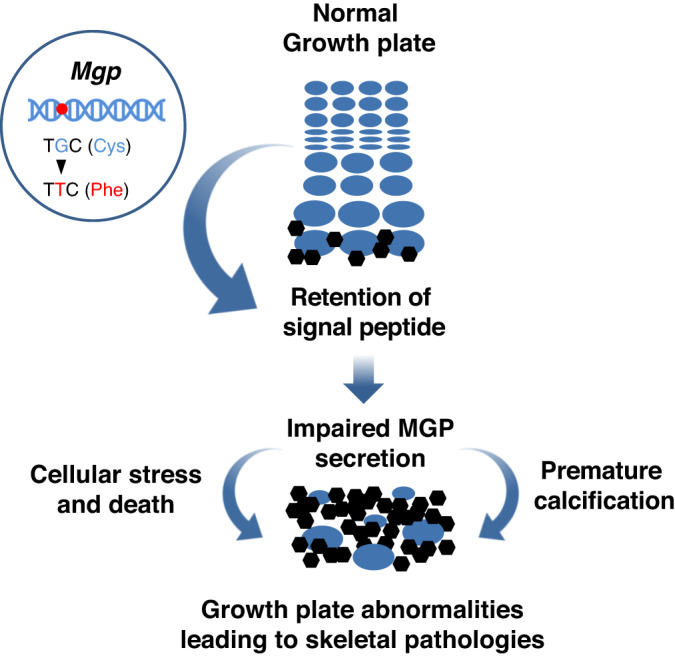
Matrix Gla protein (MGP) is a vitamin K-dependent post-translationally modified protein, highly expressed in vascular and cartilaginous tissues. It is a potent inhibitor of extracellular matrix mineralization. Biallelic loss-of-function variants in the MGP gene cause Keutel syndrome, an autosomal recessive disorder characterized by widespread calcification of various cartilaginous tissues and skeletal and vascular anomalies. In this study, we report four individuals from two unrelated families with two heterozygous variants in MGP, both altering the cysteine 19 residue to phenylalanine or tyrosine. These individuals present with a spondyloepiphyseal skeletal dysplasia characterized by short stature with a short trunk, diffuse platyspondyly, midface retrusion, progressive epiphyseal anomalies and brachytelephalangism. We investigated the cellular and molecular effects of one of the heterozygous deleterious variants (C19F) using both cell and genetically modified mouse models. Heterozygous 'knock-in' mice expressing C19F MGP recapitulate most of the skeletal anomalies observed in the affected individuals. Our results suggest that the main underlying mechanism leading to the observed skeletal dysplasia is endoplasmic reticulum stress-induced apoptosis of the growth plate chondrocytes. Overall, our findings support that heterozygous variants in MGP altering the Cys19 residue cause autosomal dominant spondyloepiphyseal dysplasia, a condition distinct from Keutel syndrome both clinically and molecularly.


Conflict of interest statement

The authors declare no competing interests.

Figures

Fig. 1
Fig. 1. Clinical description of affected individuals from Family 1 and 2.
a Pedigrees of the two affected families. Black symbols represent affected individuals. b Photographs of the hands of two individuals from Family 1 showing short hands (including short palms and brachydactyly) and brachytelephalangism. Left: Individual 1 (at 52 years of age); Right: Individual 2 (at 18 years of age). c X-rays of Individual 2 from Family 1 at 10 years of age showing diffuse platyspondyly with biconcave vertebral bodies throughout spine, flattened and broad bilateral femoral epiphysis with patchy ossification of the acetabular roof. d Photographs of Individual 4 from Family 2 at 10 years of age, showing short stature with a disproportionate short trunk, rhizomelia, exaggerated lumbar lordosis, midface retrusion, short hands with brachydactyly and mild bilateral genu valgum. e X-rays of Individual 4 from Family 2 at 7 years of age showing diffuse platyspondyly with biconcave vertebral bodies throughout spine, broad, flattened bilateral proximal femoral epiphyses, coxa vara and brachytelephalangism of the lesser fingers. X-ray of lateral cervical spine shows premature calcification of the cricoid cartilage (white arrow).
Fig. 2
Fig. 2. CRISPR/Cas9-mediated mutagenesis to introduce the C19F variant in MGP in mice.
a Mgp target sequence, sequence of the validated guide RNA, and the sequence complementary to the single-stranded oligodeoxynucleotide (cssODN) used to introduce the desired C19F variant. The original cysteine codon in the target sequence and the replacement phenylalanine codon are underlined and marked as C and F, respectively. The ssODN carries homology arms flanking each side of the mutated nucleotide. The flanking arrows show the primer pair (P1 and P2) used for the genotyping PCR and DNA sequencing. PCR using these primers would yield amplicons of ~400 bps band after agarose gel electrophoresis. b A representative agarose gel image of electrophoresed PCR products showing amplicons generated from a F0 male and its F1 offspring carrying the desired C19F variant. The agarose gel electrophoresis of PCR amplicons generated from the F0 male DNA shows multiple PCR bands—a lower band with the expected size (~400 bps) as well as high molecular weight bands. We predicted that the high molecular weight bands were due to the presence of insertion mutations in one of the Mgp alleles. PCR genotyping of a F1 male using the same primer pair shows the lower band only most likely because different Mgp alleles in the F0 male have been segregated in the offspring. c. Sanger sequencing of the lower band shows the presence of the mutated allele (c.56G>T), but not the WT allele in the F0 male further supporting the inference that the other Mgp locus is altered by insertion mutations in this mouse. d Similar PCR analysis followed by DNA sequencing show the presence of both the WT and the mutated sequences in a heterozygote F1 mouse. Note the peak corresponding to the guanine nucleotide (G*) overlapping the thymine (T) peak in the chromatogram for the F1 mouse, but not for the F0 mouse. e Table showing the total number of Mgp+/56G>T mice generated from multiple microinjection and IVF experiments. f Micro-CT images of the tibia of 1- and 2-week-old control and Mgp+/56G>T mice. Note, the skeletal development is comparable between these two genotypes. g Body weight measurements of control and Mgp+/56G>T male and female mice from 2-6 weeks of age. Mgp+/56G>T mice exhibit poor weight gain after 2 weeks of age. Error bars represent standard deviations; n = 3–8 mice for each group at each time point. Data presented as mean ± SD. Source data are provided as a Source Data file. h Photographs of control and Mgp+/56G>T male and female mice at 6 weeks of age.
Fig. 3
Fig. 3. The C19F variant in MGP results in shorter bones, midface retrusion and osteopenia.
a X-ray images of a control and Mgp+/56G>T male mice at 6 weeks of age. Heterozygous mice carrying the C19F variant are shorter, show facial anomalies, low bone mass, and shortened vertebrae. b Measurements (based on the X-ray images) of the femur and tibia of 6-week-old male and female mice showing significantly shorter long bones in Mgp+/56G>T mice compared to the control mice (n = 3 mice/group). c X-ray images of the hip joint of a control and Mgp+/56G>T male mice at 6 weeks of age. The red arrow shows the hypermineralized cartilaginous tissue in the ilium, adjacent to the acetabulum, in Mgp+/56G>T mice. d Micro-CT images of heads from both control and Mgp+/56G>T male mice at 6 weeks of age showing craniofacial anomalies and midface retrusion, and abnormal calcification of the tracheal cartilage (red arrow) in mutant mice. e Micro-CT images of the lumbar vertebrae (L3) from both control and Mgp+/56G>T male mice at 6 weeks of age. The vertebrae from the Mgp+/56G>T mice are shorter than the control mice. f The comparative analysis of the trabecular bones (L3 and L4) showed a significant reduction of trabecular bone volume over tissue volume (Tb. BV/TV), trabecular number (Tb.No.; the average number of trabeculae per mm), trabecular thickness (Tb. Th.) and an increase in the trabecular spacing (Tb. Sp.) (n = 3 mice/group). g Micro-CT images of 6-week-old control and Mgp+/56G>T distal femur. h Quantitative analysis of micro-CT parameters shows a significant reduction of Tb. BV/TV and Tb. No. and an increase in Tb. Sp. However, there is no significant difference in Tb. Th. between control and Mgp+/56G>T distal femur (n = 3 mice/group). There is a mild increase of Ct. BV/TV (cortical bone volume over tissue volume) in the mutant mice. Error bars represent standard deviations. Data presented as mean ± SD. *P < 0.05; **P < 0.01; ***P < 0.001; ****P < 0.0001 vs. control by two tailed unpaired t test. Actual P values and source data are provided as a Source Data file.
Fig. 4
Fig. 4. The C19F variant in MGP results in poor bone remodeling and growth plate abnormalities in mice.
a, b Histomorphometric analysis of lumbar vertebrae sections stained with von Kossa and van Gieson (VKVG) reveals a low bone mass phenotype in 6-week-old Mgp+/56G>T mice when compared with the control mice (n = 3 mice/group). BV/TV= trabecular bone volume over tissue volume, Tb.No.= trabecular number (the average number of trabeculae per mm). c, d The quantification of the calcein double labeling shows no significant reduction of the mineral apposition rate (MAR) and bone formation rate per unit of bone surface (BFR/BS) in the Mgp+/56G>T mice when compared to the control mice (n = 3 mice /group). The red arrows show the distance between calcein double labels. e, f Toluidine blue-stained vertebral sections show significantly reduced osteoblast (dotted red lines) counts in the mutant mice compared to the control mice (n = 3 mice/group). N.Ob/T.Ar = Osteoblast number over tissue area, N.Ob/B.Pm = Osteoblast number over bone perimeter. g, h The tartrate resistant acid phosphatase (TRAP)-stained sections reveal significantly reduced osteoclast (arrows) numbers in Mgp+/56G>T mice (n = 3 mice/group). N.Oc/T.Ar = Osteoclast number over tissue area, N.Oc/B.Pm = Osteoclast number over bone perimeter. Error bars represent standard deviations; Data presented as mean ± SD. **P < 0.01 vs. control by two tailed unpaired t test. Actual P values and source data are provided as a Source Data file. i. Von Kossa and safranin O (VKSO) staining of the undecalcified lumbar vertebral sections from the control and Mgp+/56G>T mice, as well as Mgp−/− and MgpS3mut/S3mut mice at 6 weeks of age. The growth plates of Mgp+/56G>T mice are more severely hypermineralized and prematurely closed compared to that of the control, Mgp−/− or MgpS3mut/S3mut mice. j VKSO staining of the decalcified lumbar vertebra sections from 6-week-old control and Mgp+/56G>T mice. The typical proteoglycan-rich safranin O-stained cartilaginous ECM seen in the control mice is markedly altered in the mutant mice. k, l, m Anti-type II collagen, anti-Aggrecan and anti-type X collagen staining of the lumbar vertebra sections from 3-week-old control and Mgp+/56G>T mice. Note the much thinner hypertrophic zone and markedly reduced type X collagen staining (arrow) in the growth plates of Mgp+/56G>T mice.
Fig. 5
Fig. 5. The C19F variant in MGP results in impaired processing of the signal peptide and intrecallular accumulation of the mutated protein.
Impaired processing, intracellular accumulation and poor secretion of C19F MGP in ATDC5 (af) and HEK-293 (go) cells. a Scheme showing the pMgp-FLAG-IRES-GFP or pC19FMgp-FLAG-IRES-GFP plasmids expressing the FLAG-tagged WT or C19F MGP. The constructs also express internal ribosome entry site (IRES)-driven GFP. b Fluorescence images showing GFP expression indicate comparable transfection efficiencies by both the plasmids in ATDC5 cells. Cell extracts or culture media from the transfected ATDC5 cells were enriched by immunoprecipitation (IP) using anti-FLAG magnetic beads and subjected to immunoblotting using an anti-FLAG antibody. C19F MGP expressing cells show~17 kDa and ~15kDa bands in the extracts (c), but not in the culture medium (d). e Plasmid vectors pMgp-GFP and pC19FMgp-GFP expressing the WT or C19F MGP fused in frame to GFP. f Fluorescence images showing higher retention of C19F MGP-GFP in the transfected ATDC5 cells. g Scheme showing the FLAG-tagged WT (pMgp-FLAG) or mutated (pC19FMgp-FLAG) MGP expressing plasmids. h Co-transfection of HEK-293 cells with GFP-expressing pMaxGFP and pMgp-FLAG or pC19FMgp-FLAG plasmids shows comparable transfection efficiency. i qRT-PCR showing comparable levels of WT and mutant Mgp RNA in the transfected HEK-293 cells (n = 3 independent biological samples/group). Graph shows mean±SD. Anti-FLAG immunoblots of the cell extracts (j) and culture media (k) from HEK-293 cells transfected with the pMgp-FLAG or pC19FMgp-FLAG constructs. Culture media were enriched for the tagged protein by IP as above. C19F MGP expressing cells show the ~17 kDa and ~15 kDa bands and higher amount of tagged proteins in the extract, but not in the medium. Molecular weights were shown in kilodalton (kDa). Densitometric analysis shows a consistent increase of C19F MGP protein in the cell lysate compared to that of the WT MGP. Graph shows mean of three independent experiments. l. Immunofluorescence imaging using the anti-FLAG antibody shows accumulated C19F MGP inside the transfected HEK-293 cells. The nuclei were stained by DAPI (blue). m WT/C19F MGP sequence. Peptides examined (n) are shown in color. n Representative mass spectrometry analyses of cell extracts or culture media from the transfected HEK-293 cells show more abundant tagged proteins in the extracts expressing C19F MGP, while their amount is very low in the culture medium. Analyses of cells expressing WT MGP result in an opposite pattern. o A “no enzyme” or semi-trypsin search shows that the C19F MGP samples contain several MGP peptides carrying the mutated F19 residue, often with some upstream amino acids. Source data are provided as a Source Data file.
Fig. 6
Fig. 6. The C19F variant in MGP causes ER stress and cell death in HEK-293 cells.
a Immunofluorescence imaging using anti-FLAG and anti-calnexin antibodies shows the upregulation of calnexin in HEK-293 cells expressing C19F MGP. DAPI stains the nuclei (blue) (n = 4 individual image fields/group). b Immunofluorescence imaging using an anti-CHOP antibody shows the upregulation of CHOP in cells expressing C19F MGP. DAPI stains the nuclei (n = 4 individual image fields/group). c Confocal immunofluorescence images of transfected HEK-293 cells stained with anti-FLAG and anti-calnexin antibodies show that FLAG-tagged C19F MGP protein is co-localized in the ER with the stress marker calnexin. d Cell death assay. Ethidium homodimer-stained (red) transfected HEK-293 cells show a significant increase in the number of dead cells expressing C19F MGP when compared to those expressing WT MGP (n = 10 individual image fields/group). e TUNEL assay shows increased apoptosis in C19F MGP expressing cells (n = 5 individual image fields/group). Data presented as mean ± SD. *P < 0.05; **P < 0.01; ***P < 0.001; ****P < 0.0001 vs. WT by two tailed unpaired t test. Actual P values and source data are provided as a Source Data file.
Fig. 7
Fig. 7. The C19F variant in MGP results in ER stress in vivo.
a Immunofluorescence imaging using an anti-calnexin antibody shows the upregulation of calnexin in the prehypertrophic and hypertrophic chondrocytes in the growth plates of 3-week-old Mgp+/56G>T mice. DAPI stains the nuclei (blue). b Schematic representation of three major ER stress pathways involving ATF6, PERK and IRE1α and their downstream effectors N-terminal fragment of ATF6 (ATF6-N), phosphorylated eIF2α (peIF2α) and the spliced form of XBP1 (sXBP1), respectively. Confocal immunofluorescence images of vertebral sections from 3-week-old control and Mgp+/56G>T mice using anti-ATF6-N (c), anti-p-eIF2α (d), anti-sXBP1 (detects the spliced form) (e), and anti-CHOP antibodies (f) show increased accumulation of these markers, except for the spliced XBP1 in the latter genotype. Arrows on the immunofluorescence images indicate the protein localization.
Fig. 8
Fig. 8. The C19F variant in MGP increased cell death in the growth plate chondrocytes and in chondrogenic ATDC5 cells.
a TUNEL assay shows a drastic increase in the number of apoptotic chondrocytes in the vertebral sections of 3-week-old Mgp+/56G>T mice compared to the control mice. b. Bar graphs showing the quantification of TUNEL positive cells (n = 3 individual image fields/group). c TUNEL assay on 6-week-old vertebral sections of the control, Mgp+/56G>T, Mgp−/− and MgpS3mut/S3mut mice shows the clustered presence of apoptotic chondrocytes in the growth plates of Mgp+/56G>T but not in other genotypes. d Ethidium homodimer-based cell death assay performed on ATDC5 cells transfected with pMgp-GFP or pC19FMgp-GFP vectors. Cells expressing C19FMGP-GFP fusion protein show increased deaths as evident by both GFP and ethidium homodimer staining (green and red, respectively). e Quantification of the dead cells in transfected ATDC5 cells. Cells with both GFP and ethidium homodimer staining were counted and normalized by the total number of GFP-positive cells. Values were represented as percent of cell deaths (n = 6 individual image fields/group). f Treatment of ATDC5 cells expressing C19F MGP-GFP fusion protein with 4-phenyl butyric acid (4-PBA) prevented cell deaths. ATDC5 cells were transfected with the pC19FMgp-GFP plasmid and cultured in α MEM complete media with or without 5 mM 4-PBA for 48 h. The percent of cell deaths were calculated as described in (e) (n = 7 individual image fields/group). Error bars represent standard deviations. Data presented as mean ± SD. **P < 0.01; ***P < 0.001; ****P < 0.0001 vs. control (or WT) by two tailed unpaired t test. Actual P values and source data are provided as a Source Data file.
Fig. 9
Fig. 9. A model describing the effects of C19F MGP expression on the growth plate.
The C19F variant in MGP results in the impaired processing of the signal peptide and the retention of the mutated protein in the ER. This in turn leads to ER stress and markedly increased deaths of the growth plate prehypertrophic/hypertrophic cells which are known to express MGP at high levels. The cellular alterations may affect the expression and secretion of WT MGP causing the premature closure of the growth plates and the associated skeletal anomalies.

References

    1. Geister KA, Camper SA. Advances in skeletal dysplasia genetics. Annu. Rev. Genom. Hum. Genet. 2015;16:199–227. doi: 10.1146/annurev-genom-090314-045904. - DOI - PMC - PubMed
    1. Mortier GR, et al. Nosology and classification of genetic skeletal disorders: 2019 revision. Am. J. Med. Genet. A. 2019;179:2393–2419. doi: 10.1002/ajmg.a.61366. - DOI - PubMed
    1. Price PA, Williamson MK. Primary structure of bovine matrix Gla protein, a new vitamin K-dependent bone protein. J. Biol. Chem. 1985;260:14971–14975. doi: 10.1016/S0021-9258(18)95688-7. - DOI - PubMed
    1. Price PA, Urist MR, Otawara Y. Matrix Gla protein, a new gamma-carboxyglutamic acid-containing protein which is associated with the organic matrix of bone. Biochem. Biophys. Res. Commun. 1983;117:765–771. doi: 10.1016/0006-291X(83)91663-7. - DOI - PubMed
    1. Luo G, et al. Spontaneous calcification of arteries and cartilage in mice lacking matrix GLA protein. Nature. 1997;386:78–81. doi: 10.1038/386078a0. - DOI - PubMed

Publication types

Substances

Supplementary concepts

LinkOut - more resources