. 2023 Nov 3;14(1):7072.
doi: 10.1038/s41467-023-42641-4.

DNA strand breaks and gaps target retroviral intasome binding and integration

Affiliations

DNA strand breaks and gaps target retroviral intasome binding and integration

Gayan Senavirathne et al. Nat Commun. .

Abstract

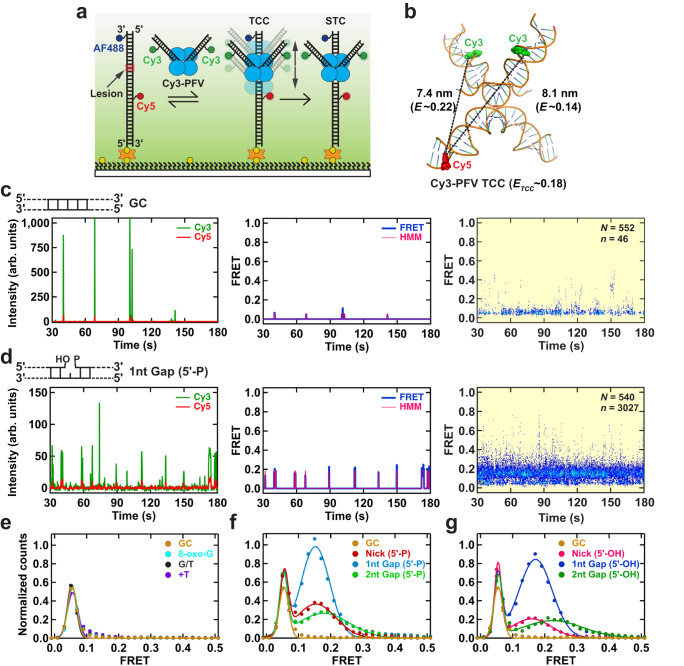
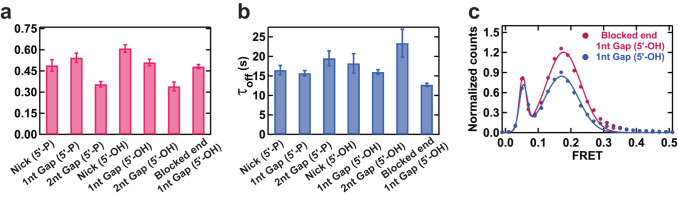
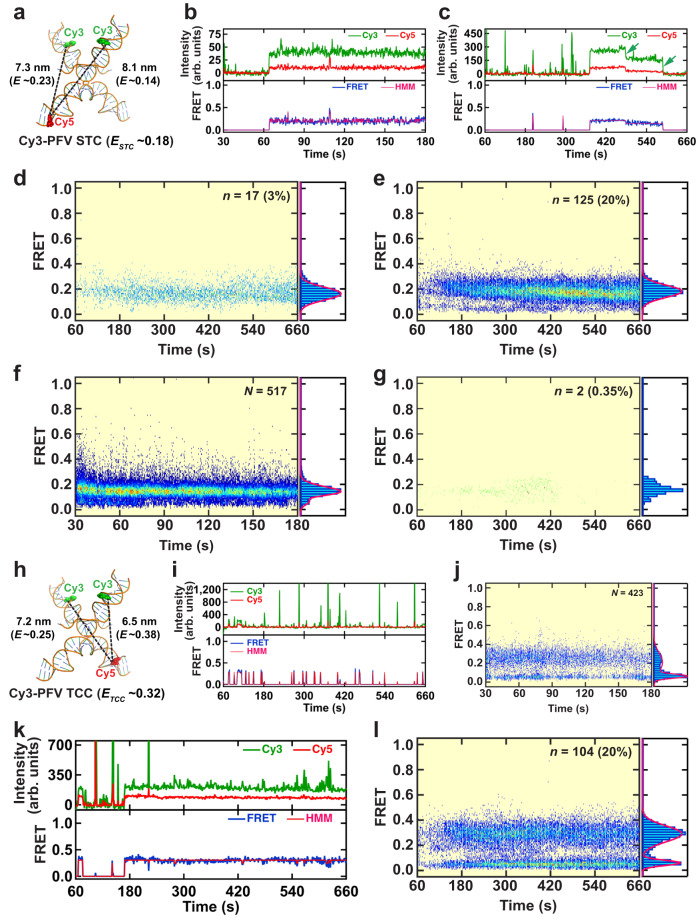
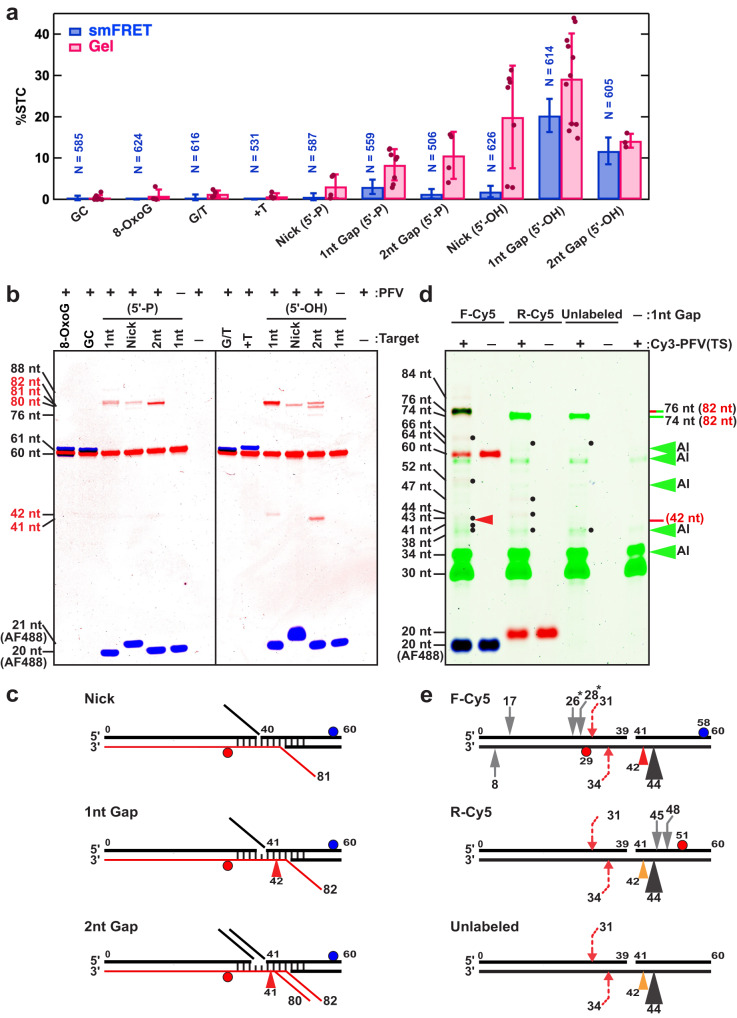
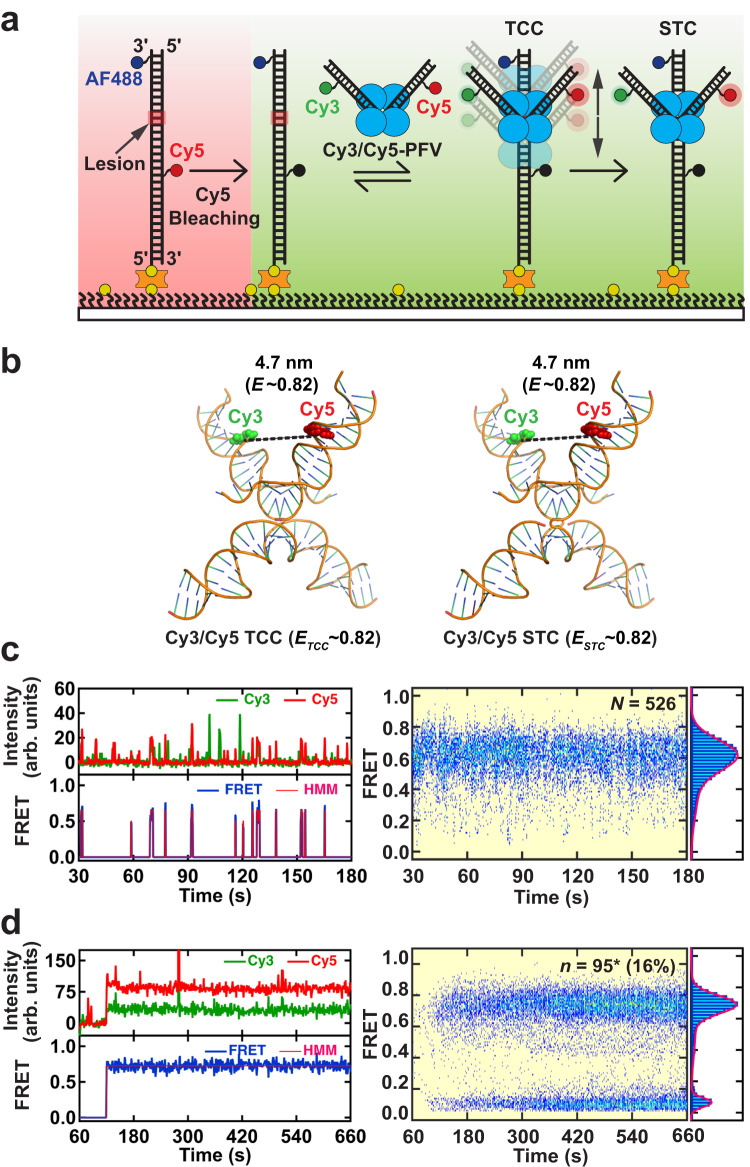
Retrovirus integration into a host genome is essential for productive infections. The integration strand transfer reaction is catalyzed by a nucleoprotein complex (Intasome) containing the viral integrase (IN) and the reverse transcribed (RT) copy DNA (cDNA). Previous studies suggested that DNA target-site recognition limits intasome integration. Using single molecule Förster resonance energy transfer (smFRET), we show prototype foamy virus (PFV) intasomes specifically bind to DNA strand breaks and gaps. These break and gap DNA discontinuities mimic oxidative base excision repair (BER) lesion-processing intermediates that have been shown to affect retrovirus integration in vivo. The increased DNA binding events targeted strand transfer to the break/gap site without inducing substantial intasome conformational changes. The major oxidative BER substrate 8-oxo-guanine as well as a G/T mismatch or +T nucleotide insertion that typically introduce a bend or localized flexibility into the DNA, did not increase intasome binding or targeted integration. These results identify DNA breaks or gaps as modulators of dynamic intasome-target DNA interactions that encourage site-directed integration.


Conflict of interest statement

The authors declare no competing interests.

Figures

Fig. 1
Fig. 1. Real-time PFV intasome target capture dynamics.
a An illustration of the smFRET experimental setup for visualizing the target capture by a PFV intasome labeled with Cy3 at non-transfer strands (Cy3-PFV). The intasome was introduced in real-time onto DNA targets containing AlexaFluor488 (AF488) and Cy5. b Positioning of the DNAs within the PFV TCC structure (PDB: 10.2210/pdb3os2/pdb) showing the fluorophore positions on the vDNAs (Cy3-PFV) and the target DNA (F-Cy5). The estimated inter-dye distances, corresponding FRET efficiencies, and the average FRET value (ETCC) of a mixture of molecules containing a single Cy3 on the left or right vDNA. A representative intensity trajectory (left), the corresponding FRET trajectory with the HMM fit (middle), and the post-synchronized histogram (right) displaying intasome interactions with GC duplex target DNA (c), and target DNA containing a 1nt Gap (5’-P) (d). Inset shows the total number of DNA molecules (N) analyzed for each substrate and the total number of transitions with >0.1 FRET (n). e Normalized smFRET histograms and Gaussian fits using 100 ms frame rate pseudo-FRET data (Supplementary Table 2), showing the distributions of FRET efficiency for target DNAs containing a GC duplex, 8-oxo-G lesion, G/T mismatch, +T insertion. Normalized smFRET histograms and Gaussian fits using 100 ms frame rate data (Supplementary Table 2) showing the distributions of FRET efficiency for target DNAs containing single strand scission (Nick), a 1 nt Gap, and a 2 nt Gap with a 5’-phosphate (5’-P) (f) or 5’-hydroxyl (5’-OH) (g). The GC duplex target DNA was included for comparison. Source data are provided in the Source Data File.
Fig. 2
Fig. 2. Binding and Dissociation Lifetimes of the Target Capture Complex Events.
a The TCC binding lifetime (τon) and (b) lifetime of the dissociated state (τoff) for different target DNA substrates. Bars represent the mean, and error bars represent the standard deviation from the fittings of dwell time distributions (Supplementary Fig. 8). c Normalized smFRET histograms and Gaussian fits (Supplementary Tables 3 and 4) showing the FRET distribution for the 1nt Gap (5’-OH) DNA with or without blocking the open DNA end. The binned data, single exponential decay fits, and number of molecules (N) for each substrate DNA examined are shown in Supplementary Fig. 8. Source data are provided in the Source Data File.
Fig. 3
Fig. 3. Real-time PFV intasome catalyzed strand transfer.
a Illustration of the DNA configuration found in the PFV strand transfer complex (STC) crystal structure (PDB 3OS0) showing the fluorophore positions on the vDNAs (Cy3-PFV) and the target DNA (F-Cy5). The estimated inter-dye distances, corresponding FRET efficiencies, and the average FRET value (ESTC) of a mixture of molecules containing a single Cy3 on the left or right vDNA. b, c Representative intensity trajectories and corresponding FRET trajectories with HMM fits showing stable strand transfer by a Cy3-PFV intasome. Green arrows mark the photobleaching of the Cy3 FRET donor. The Post-synchronized histogram and smFRET histograms corresponding to STC events for target DNAs containing a 1nt Gap (5’-P) (d) or 1nt Gap (5’-OH) (e). The Gaussian fits to the FRET histograms are shown as red lines. Data were collected at 100 ms frame rate (b) or 1 s frame rate (ce). Inset shows the total number of transitions with >0.1 FRET (n) and the percentage (%) of strand transfer events. The post-synchronized histogram and smFRET histograms corresponding to TCC (f) and STC (g) events for Cy3-PFV-ddA interacting with 1nt Gap (5’-OH) target DNA. Data were collected at 100 ms frame rate (f) and 1 s frame rate (g). Inset shows the total number of DNA molecules analyzed (N) (f); and the number of stable transitions with >0.1 FRET (n) and the percentage (%) of STC events (g; N = 564). h Illustration of the DNA configuration found in the PFV strand transfer complex (STC) crystal structure (PDB 3OS0) showing the fluorophore positions on the vDNAs (Cy3) and the reverse-Cy5 (R-Cy5) target DNA, respectively. The estimated inter-dye distances, corresponding FRET efficiencies, and the average FRET value (ETCC) of a mixture of molecules containing a single Cy3 on the left or right vDNA. i A representative intensity trajectory (top) and the corresponding FRET trajectory (bottom) with the HMM fit showing Cy3-PFV binding to R-Cy5 target DNA containing a 1nt Gap (5’-OH). j The post-synchronized histogram (left) and the smFRET histogram (right) produced by averaging the total number (N) of TCC smFRET traces. k A representative intensity trajectory (top) and the corresponding FRET trajectory (bottom) with HMM fit showing Cy3-PFV strand transfer into R-Cy5 target DNA containing a 1nt Gap (5’-OH). I The post-synchronized histogram (left) and the smFRET histogram (right) corresponding to the total number (n) and percentage (%) of STC events. The data in (il) were collected at 1 s frame rate.
Fig. 4
Fig. 4. Analysis of PFV strand transfer activity.
a Quantification of single-molecule FRET (smFRET) and denaturing gel electrophoresis (Gel) analysis of STC integration activity (%) on different DNA targets. Bars indicate the mean and error bars the standard of deviation of smFRET events that were observed on N molecules or from at least three independent Gel quantification analysis (see: •). The smFRET data were generated using Cy3-PFV, and the gel data were obtained using unlabeled PFV with Cy5 and AlexaFluor488 (AF488) labeled target DNAs. Error bars in the gel data are the standard deviations from triplicates. Differences in absolute frequency reflect different intasome reaction concentrations in smFRET (5 nM) and gel analysis (25 nM). b Representative denaturing PAGE gels from bulk integration studies. The lengths of ssDNAs derived from a Sanger sequencing ladder are shown. The blue and red bands show DNA fragments containing AF488 and Cy5, respectively. The target DNA substrates used for each lane are shown above (Supplementary Table 1). c Schematics showing the major strand transfer event with predicted ssDNA length (red line) and alcoholysis (red arrowhead) exhibited by unlabeled PFV intasomes. d Gel analysis (top) and integration sites (bottom) of PFV intasomes labeled with Cy3 on the vDNA transferred strand [Cy3-PFV (TS)]. Integration into different 1nt Gap (5’-OH) substrates containing a forward Cy5 label (F-Cy5), reverse Cy5 label (R-Cy5) or unlabeled as illustrated below. The blue, green and red color gel bands correspond to DNA fragments containing AF488, Cy3, and/or Cy5. The brown color bands contain both Cy3 and Cy5. Green arrows indicate location of autointegration (AI) products. The black dots indicate products resulting from strand transfer and red arrowhead the 42 nt alcoholysis product (see: b,c). Orange arrowhead in illustration represents the predicted location of an undetected alcoholysis product since the DNA strand does not contain a fluorophore label. e Calculated integration sites for each target DNA. Large black arrow indicates major (>90%) half-site integration product similar to major bands in Panel b; red dashed arrows indicate minor concerted strand transfer product; gray arrows show minor half-site products. The numbers indicate the positions of integration relative to the 5’-end of the top target DNA strand. * Indicates products that have more than one integration site solution (see text). Source data are provided in the Source Data File.
Fig. 5
Fig. 5. Probing the structural dynamics of PFV intasome during target capture and strand transfer.
a An illustration of the smFRET experimental setup for visualizing the structural dynamics of PFV intasomes during TCC and STC formation. A PFV intasome labeled with Cy3 and Cy5 at the non-transfer strands (Cy3/Cy5 PFV) was introduced after photobleaching Cy5 on the substrates. b Illustration of the DNA configuration found in the PFV TCC structure (PDB 3OS2) and STC structure (PDB 3OS0) with the fluorophore positions on the vDNAs (Cy3 and Cy5). The estimated inter-dye distances, corresponding FRET efficiencies, and the average FRET value (ETCC and ESTC) are shown. c Left: A representative TCC intensity trajectory (top) and the resulting FRET trajectory (bottom) with the HMM fit showing Cy3/Cy5-PFV binding to a 1nt Gap (5’-OH) target DNA (left). Right: Post-synchronized histogram (left) and smFRET histogram (right) generated by averaging the total number (N) of TCC FRET traces. d Left: A representative STC intensity trajectory (top) and the resulting FRET trajectory (bottom) with HMM fit showing Cy3/Cy5-PFV integration into a 1nt Gap (5’-OH) target DNA (left). Right: Post-synchronized histogram (left) and smFRET histogram (right) generated by averaging the total number (n) of STC Cy3/Cy5-PFV FRET traces (* indicates Cy3/Cy3-PFV events are included in the total number of STC traces). The percentage (%) is the efficiency of Cy3/Cy5-PFV strand transfer that includes Cy3/Cy3-PFV bleed-through events (6%). The Gaussian fits to the histograms are shown as red lines. The TCC and STC data were collected at 1 s frame rate.

References

    1. Varmus H. Retroviruses. Science. 1988;240:1427–1435. doi: 10.1126/science.3287617. - DOI - PubMed
    1. Bowerman B, Brown PO, Bishop JM, Varmus HE. A nucleoprotein complex mediates the integration of retroviral DNA. Genes Dev. 1989;3:469–478. doi: 10.1101/gad.3.4.469. - DOI - PubMed
    1. Wei SQ, Mizuuchi K, Craigie R. A large nucleoprotein assembly at the ends of the viral DNA mediates retroviral DNA integration. EMBO J. 1997;16:7511–7520. doi: 10.1093/emboj/16.24.7511. - DOI - PMC - PubMed
    1. Lesbats P, Engelman AN, Cherepanov P. Retroviral DNA Integration. Chem. Rev. 2016;116:12730–12757. doi: 10.1021/acs.chemrev.6b00125. - DOI - PMC - PubMed
    1. Delelis O, Carayon K, Saib A, Deprez E, Mouscadet JF. Integrase and integration: biochemical activities of HIV-1 integrase. Retrovirology. 2008;5:114. doi: 10.1186/1742-4690-5-114. - DOI - PMC - PubMed

Publication types