

Long-term association of ultra-short heart rate variability with cardiovascular events
- PMID: 37923787
- PMCID: PMC10624663
- DOI: 10.1038/s41598-023-45988-2
Long-term association of ultra-short heart rate variability with cardiovascular events
Abstract
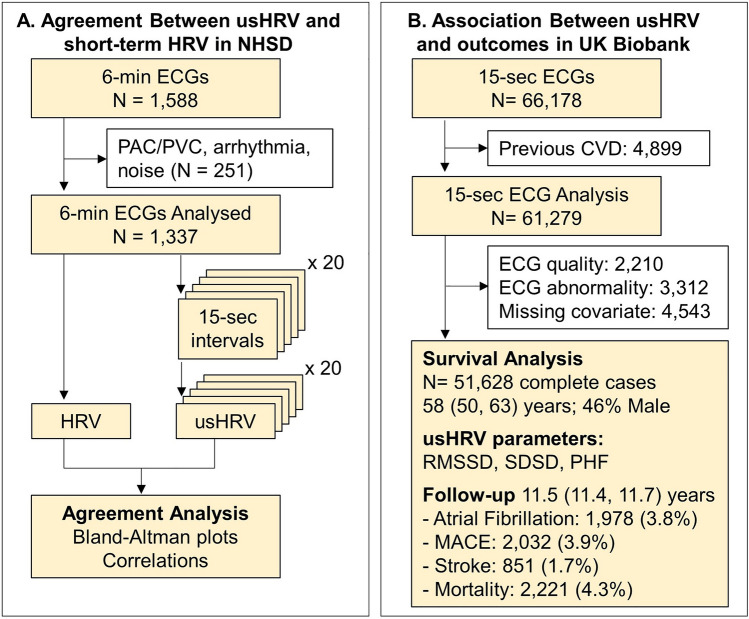
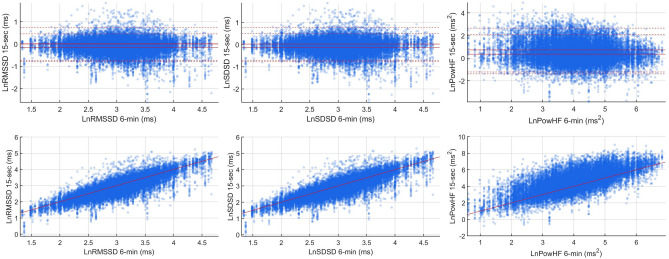
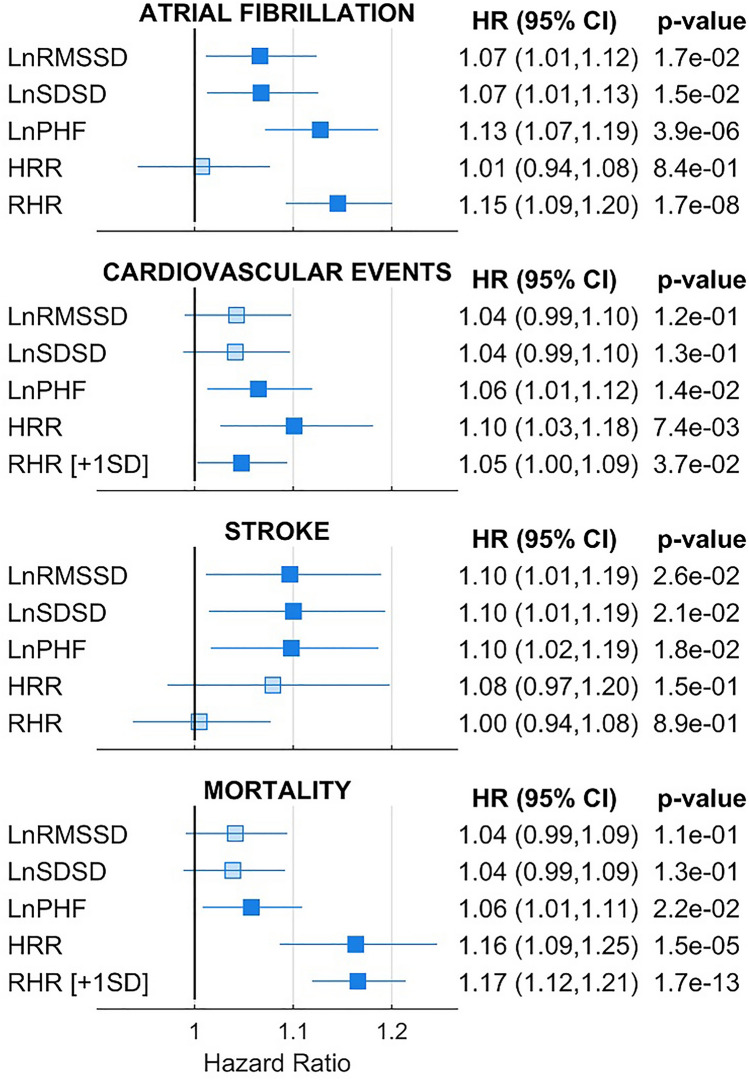
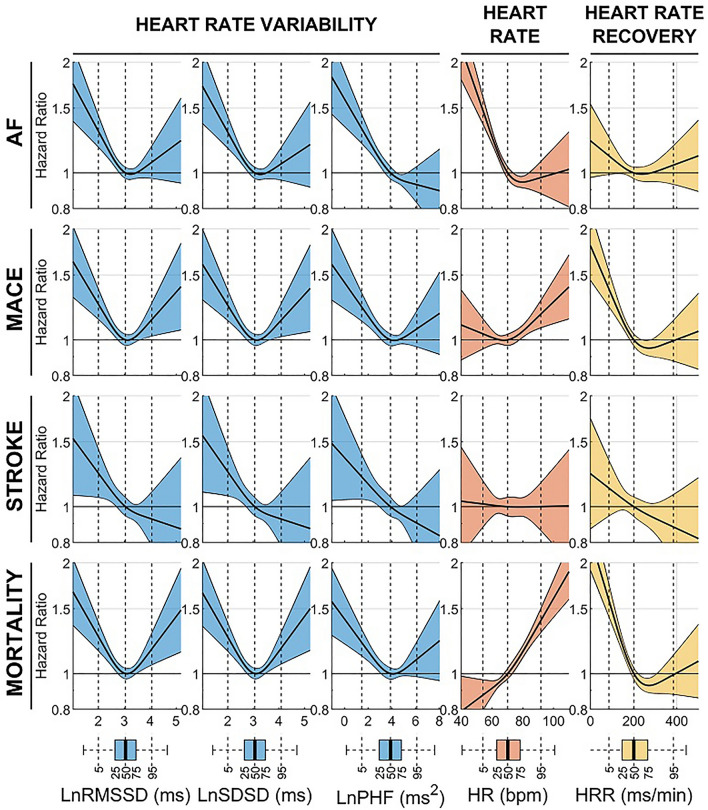
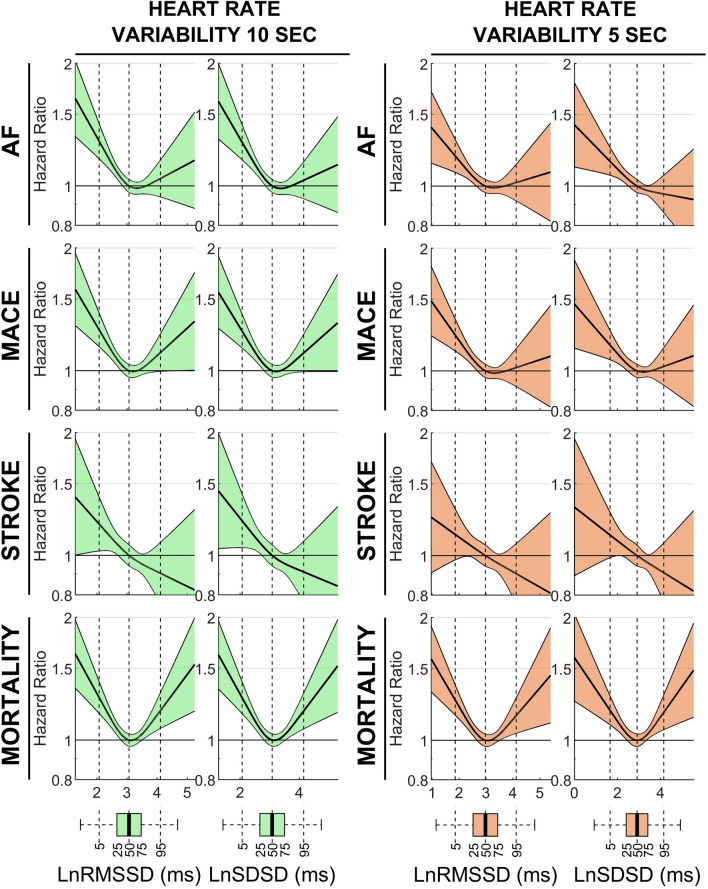
Heart rate variability (HRV) is a cardiac autonomic marker with predictive value in cardiac patients. Ultra-short HRV (usHRV) can be measured at scale using standard and wearable ECGs, but its association with cardiovascular events in the general population is undetermined. We aimed to validate usHRV measured using ≤ 15-s ECGs (using RMSSD, SDSD and PHF indices) and investigate its association with atrial fibrillation, major adverse cardiac events, stroke and mortality in individuals without cardiovascular disease. In the National Survey for Health and Development (n = 1337 participants), agreement between 15-s and 6-min HRV, assessed with correlation analysis and Bland-Altman plots, was very good for RMSSD and SDSD and good for PHF. In the UK Biobank (n = 51,628 participants, 64% male, median age 58), after a median follow-up of 11.5 (11.4-11.7) years, incidence of outcomes ranged between 1.7% and 4.3%. Non-linear Cox regression analysis showed that reduced usHRV from 15-, 10- and 5-s ECGs was associated with all outcomes. Individuals with low usHRV (< 20th percentile) had hazard ratios for outcomes between 1.16 and 1.29, p < 0.05, with respect to the reference group. In conclusion, usHRV from ≤ 15-s ECGs correlates with standard short-term HRV and predicts increased risk of cardiovascular events in a large population-representative cohort.
© 2023. The Author(s).
Conflict of interest statement
The authors declare no competing interests.
Figures
Similar articles
-
Reliability of ultrashort electrocardiographic indices in hypertension: the quest for a clinically applicable prognostic marker.J Investig Med. 2020 Feb;68(2):364-370. doi: 10.1136/jim-2019-001106. Epub 2019 Aug 16. J Investig Med. 2020. PMID: 31420365
-
Evaluating heart rate variability with 10 second multichannel electrocardiograms in a large population-based sample.Front Cardiovasc Med. 2023 May 12;10:1144191. doi: 10.3389/fcvm.2023.1144191. eCollection 2023. Front Cardiovasc Med. 2023. PMID: 37252117 Free PMC article.
-
Reliability of ultra-short-term analysis as a surrogate of standard 5-min analysis of heart rate variability.Telemed J E Health. 2015 May;21(5):404-14. doi: 10.1089/tmj.2014.0104. Epub 2015 Mar 25. Telemed J E Health. 2015. PMID: 25807067
-
Reliability of ultra-short indices for autonomic dysfunction in dyslipidemia.Clin Physiol Funct Imaging. 2020 Nov;40(6):423-433. doi: 10.1111/cpf.12661. Epub 2020 Sep 19. Clin Physiol Funct Imaging. 2020. PMID: 32886849
-
Reliability of Ultra-Short ECG Indices for Heart Rate Variability.Ann Noninvasive Electrocardiol. 2011 Apr;16(2):117-22. doi: 10.1111/j.1542-474X.2011.00417.x. Ann Noninvasive Electrocardiol. 2011. PMID: 21496161 Free PMC article.
Cited by
-
Exploring Stakeholder Perspectives on the Barriers and Facilitators of Implementing Digital Technologies for Heart Disease Diagnosis: Qualitative Study.JMIR Cardio. 2025 Mar 5;9:e66464. doi: 10.2196/66464. JMIR Cardio. 2025. PMID: 40053721 Free PMC article.
-
Heart rate variability measurement and influencing factors: Towards the standardization of methodology.Glob Cardiol Sci Pract. 2024 Aug 1;2024(4):e202435. doi: 10.21542/gcsp.2024.35. eCollection 2024 Aug 1. Glob Cardiol Sci Pract. 2024. PMID: 39351472 Free PMC article. Review.
-
Disruption of Atrial Rhythmicity by the Air Pollutant 1,2-Naphthoquinone: Role of Beta-Adrenergic and Sensory Receptors.Biomolecules. 2023 Dec 31;14(1):57. doi: 10.3390/biom14010057. Biomolecules. 2023. PMID: 38254656 Free PMC article.
-
Using heart rate variability to predict neurological outcomes in preterm infants: a scoping review.Pediatr Res. 2025 May;97(6):1823-1832. doi: 10.1038/s41390-024-03606-5. Epub 2024 Oct 5. Pediatr Res. 2025. PMID: 39369103 Free PMC article.
-
Association between visceral fat area and heart rate variability in high altitude migrants with OSA: the mediating effect of insulin resistance.Lipids Health Dis. 2025 Jul 28;24(1):253. doi: 10.1186/s12944-025-02626-2. Lipids Health Dis. 2025. PMID: 40721786 Free PMC article.
References
-
- Sassi R, et al. Advances in heart rate variability signal analysis: Joint position statement by the e-Cardiology ESC Working Group and the European Heart Rhythm Association co-endorsed by the Asia Pacific Heart Rhythm Society. Europace. 2015;17:1341–1353. doi: 10.1093/europace/euv015. - DOI - PubMed
-
- Task Force of the European Society of Cardiology and the North American Society of Pacing and Electrophysiology. Heart rate variability. Standards of measurement, physiological interpretation, and clinical use. T. Eur. Heart J.17, 354–381 (1996). - PubMed
Publication types
MeSH terms
Grants and funding
LinkOut - more resources
Full Text Sources
