. 2023 Nov 3;13(1):18987.
doi: 10.1038/s41598-023-46431-2.

The inverse association between DNA gaps and HbA1c levels in type 2 diabetes mellitus

Affiliations

The inverse association between DNA gaps and HbA1c levels in type 2 diabetes mellitus

Jirapan Thongsroy et al. Sci Rep. .

Abstract

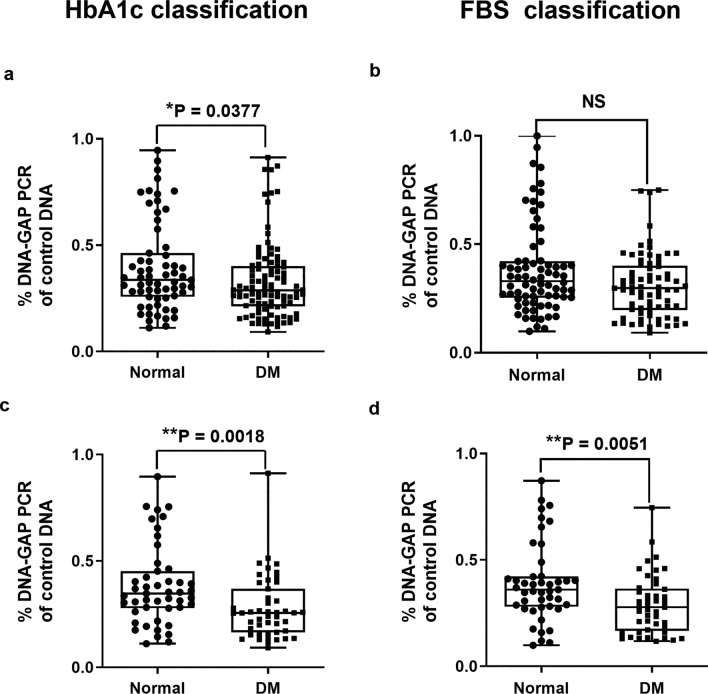
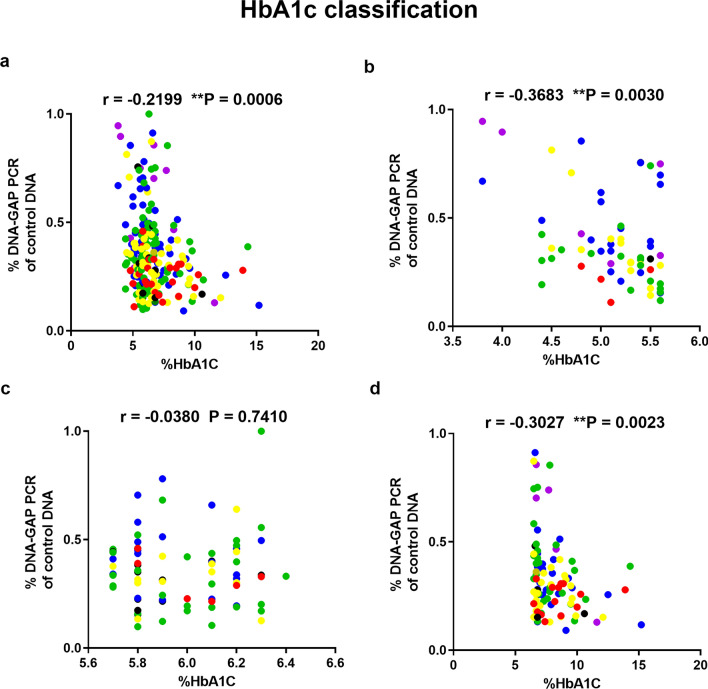
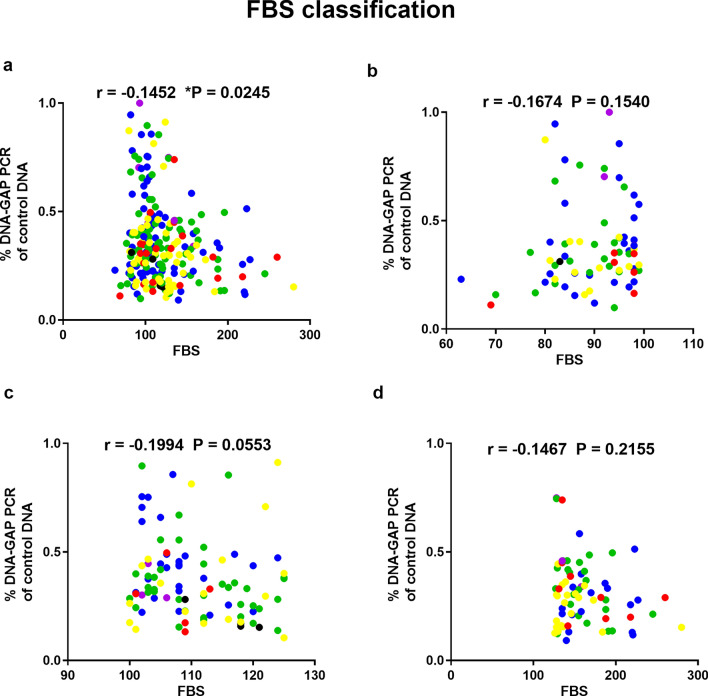
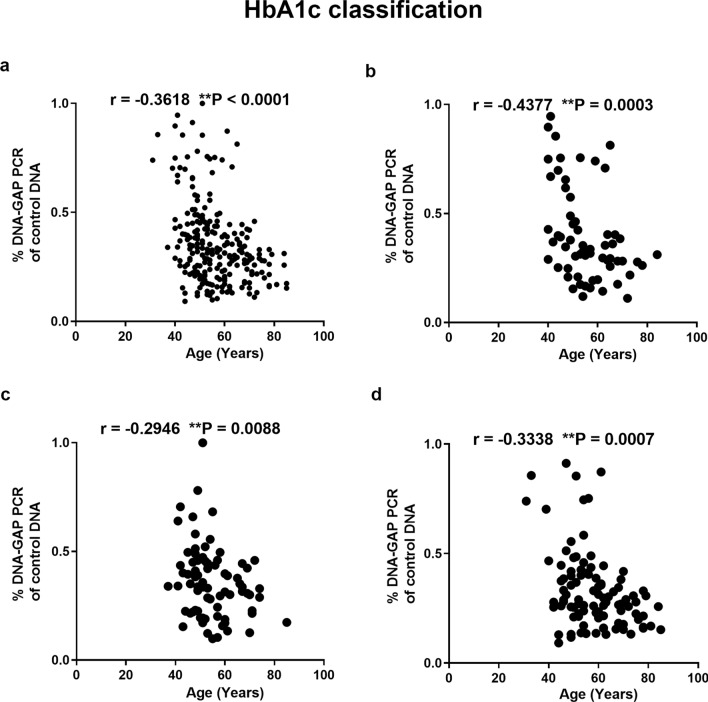
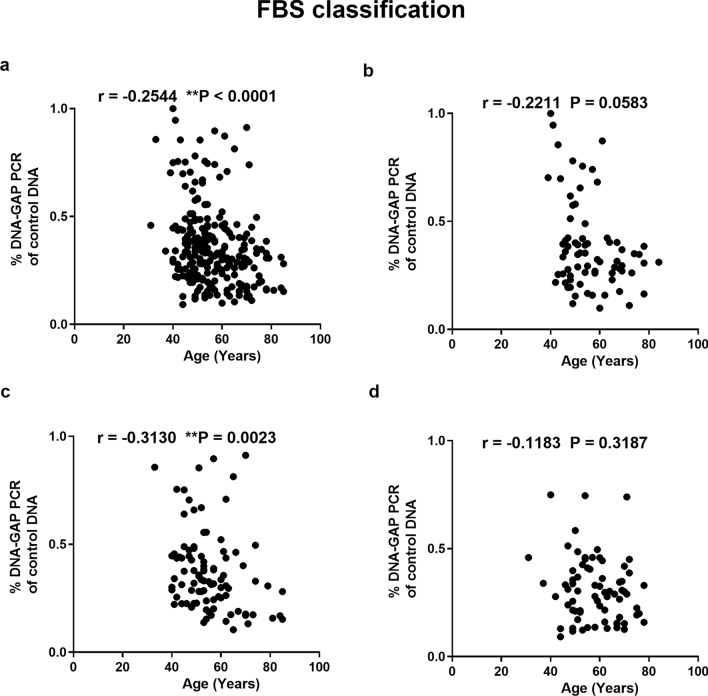
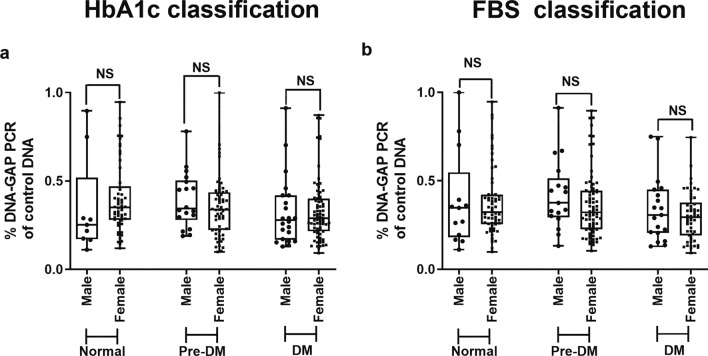
Naturally occurring DNA gaps have been observed in eukaryotic DNA, including DNA in nondividing cells. These DNA gaps are found less frequently in chronologically aging yeast, chemically induced senescence cells, naturally aged rats, D-galactose-induced aging model rats, and older people. These gaps function to protect DNA from damage, so we named them youth-associated genomic stabilization DNA gaps (youth-DNA-gaps). Type 2 diabetes mellitus (type 2 DM) is characterized by an early aging phenotype. Here, we explored the correlation between youth-DNA-gaps and the severity of type 2 DM. Here, we investigated youth-DNA-gaps in white blood cells from normal controls, pre-DM, and type 2 DM patients. We found significantly decreased youth-DNA-gap numbers in the type 2 DM patients compared to normal controls (P = 0.0377, P = 0.0018 adjusted age). In the type 2 DM group, youth-DNA-gaps correlate directly with HbA1c levels. (r = - 0.3027, P = 0.0023). Decreased youth-DNA-gap numbers were observed in patients with type 2 DM and associated with increased HbA1c levels. Therefore, the decrease in youth-DNA-gaps is associated with the molecular pathogenesis of high blood glucose levels. Furthermore, youth-DNA-gap number is another marker that could be used to determine the severity of type 2 DM.


Conflict of interest statement

The authors declare no competing interests.

Figures

Figure 1
Figure 1
The percentage of each DNA-gap number in normal and type 2 DM patients when grouped by HbA1c (a) and FBS levels (b). The values of independent age-matched pairs when grouped by HbA1c (c) and FBS levels (d). The boxes represent the interquartile ranges (25th to 75th percentile), while the median lines represent the 50th percentile. The whiskers represent the minimum and maximum values, and all individual data points are displayed. Significance levels are denoted as follows: *P < 0.05, **P < 0.01 (Mann–Whitney U test).
Figure 2
Figure 2
Association between the percentage of each DNA-gap with HbA1c levels in all samples (a), normal (b), pre-DM (c), and type 2 DM patients (d). Spearman's rank correlation (r) with P values are indicated. (**P < 0.01). The age ranges are represented by the following colors: violet (31–40 years), blue (41–50 years), green (51–60 years), yellow (61–70 years), red (71–80 years), and black (81–90 years).
Figure 3
Figure 3
Correlation of DNA-gap number with FBS level in all samples (a), normal (b), pre-DM (c) and type 2 DM patients (d). Spearman's rank correlation (r) with P values are indicated. (*P < 0.05). The age ranges are represented by the following colors: violet (31–40 years), blue (41–50 years), green (51–60 years), yellow (61–70 years), red (71–80 years), and black (81–90 years).
Figure 4
Figure 4
Association between the percentage of each DNA-gap and age when patients were grouped according to HbA1c levels. Correlation between % DNA-GAPs and age in all samples (a), normal (b), pre-DM (c), and type 2 DM (d). Each plot represents youth-DNA-gap levels of the patients. Spearman's rank correlation (r) with P values are indicated. **P < 0.01.
Figure 5
Figure 5
Correlation between the percentage of each DNA-gap and age in all samples (a), normal (b), pre-DM (c), and type 2 DM patients (d) when grouped according to FBS level. Spearman's rank correlation (r) with P values are indicated. **P < 0.01.
Figure 6
Figure 6
Comparisons of the percentage of DNA-gap levels between males and females in the normal, pre-DM and DM groups when grouped using the HbA1c level (a) and FBS level (b). The boxes represent the interquartile ranges (25th to 75th percentile), while the median lines represent the 50th percentile. The whiskers represent the minimum and maximum values, and all individual data points are displayed. (Mann–Whitney U test).

Similar articles

Cited by

References

    1. Sun H, et al. IDF Diabetes Atlas: Global, regional and country-level diabetes prevalence estimates for 2021 and projections for 2045. Diabetes Res. Clin. Pract. 2022;183:109119. doi: 10.1016/j.diabres.2021.109119. - DOI - PMC - PubMed
    1. Guariguata L, et al. Global estimates of diabetes prevalence for 2013 and projections for 2035. Diabetes Res. Clin. Pract. 2014;103:137–149. doi: 10.1016/j.diabres.2013.11.002. - DOI - PubMed
    1. Chehadeh SE, et al. Genetic variants and their associations to type 2 diabetes mellitus complications in the United Arab Emirates. Front. Endocrinol. 2021 doi: 10.3389/fendo.2021.751885. - DOI - PMC - PubMed
    1. Prasad RB, Groop L. Genetics of type 2 diabetes—pitfalls and possibilities. Genes. 2015;6:87–123. doi: 10.3390/genes6010087. - DOI - PMC - PubMed
    1. Ali O. Genetics of type 2 diabetes. World J. Diabetes. 2013;4:114. doi: 10.4239/wjd.v4.i4.114. - DOI - PMC - PubMed

Publication types