

Revealed versus potential spatial accessibility of healthcare and changing patterns during the COVID-19 pandemic
- PMID: 37923904
- PMCID: PMC10624905
- DOI: 10.1038/s43856-023-00384-9
Revealed versus potential spatial accessibility of healthcare and changing patterns during the COVID-19 pandemic
Abstract
Background: Timely access to healthcare is essential but measuring access is challenging. Prior research focused on analyzing potential travel times to healthcare under optimal mobility scenarios that do not incorporate direct observations of human mobility, potentially underestimating the barriers to receiving care for many populations.
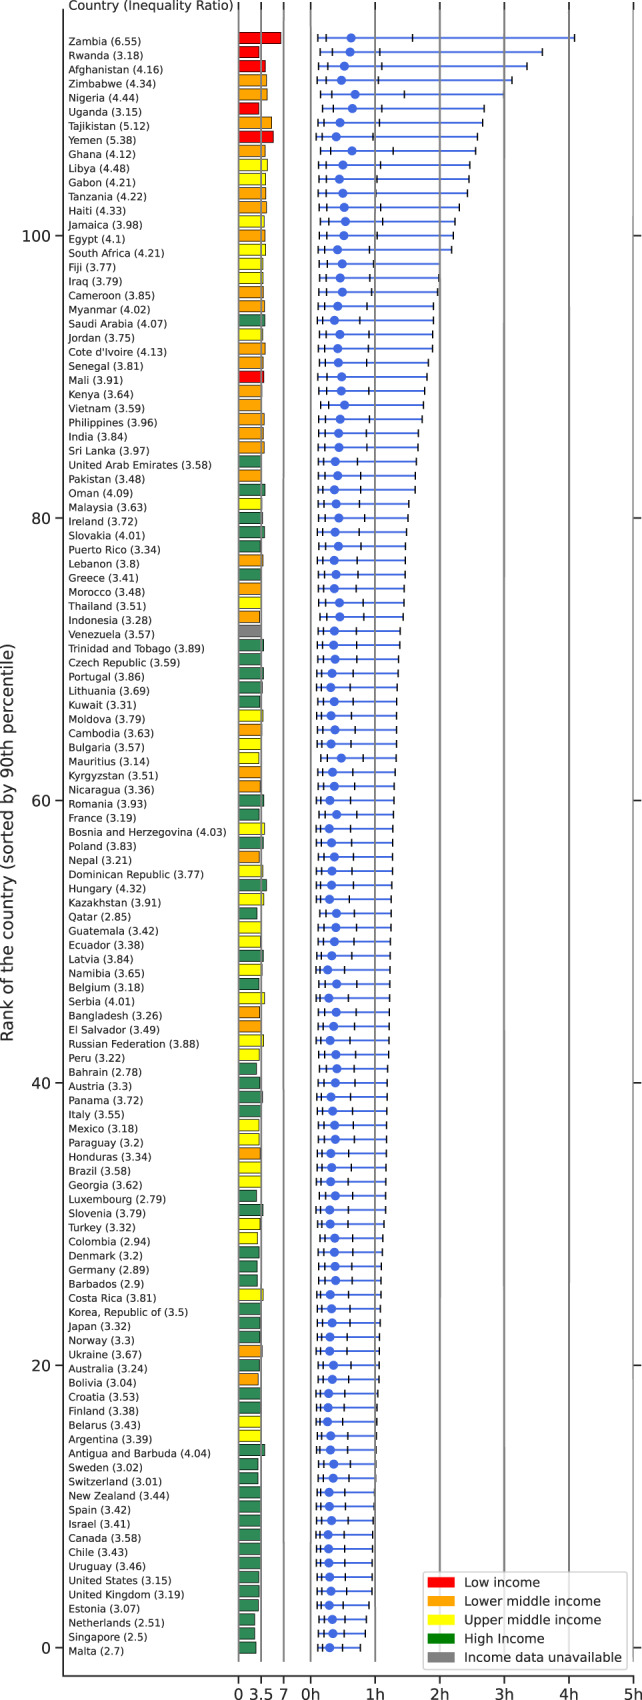
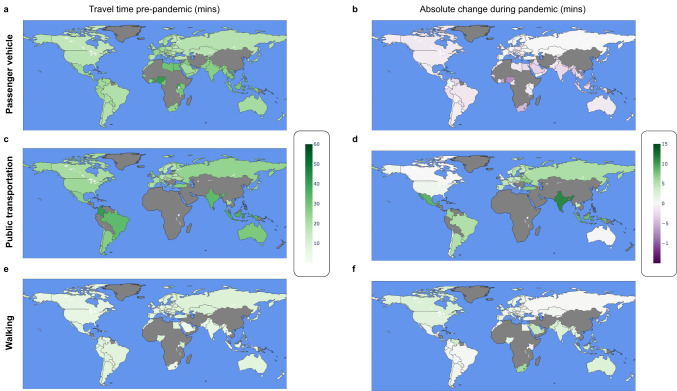
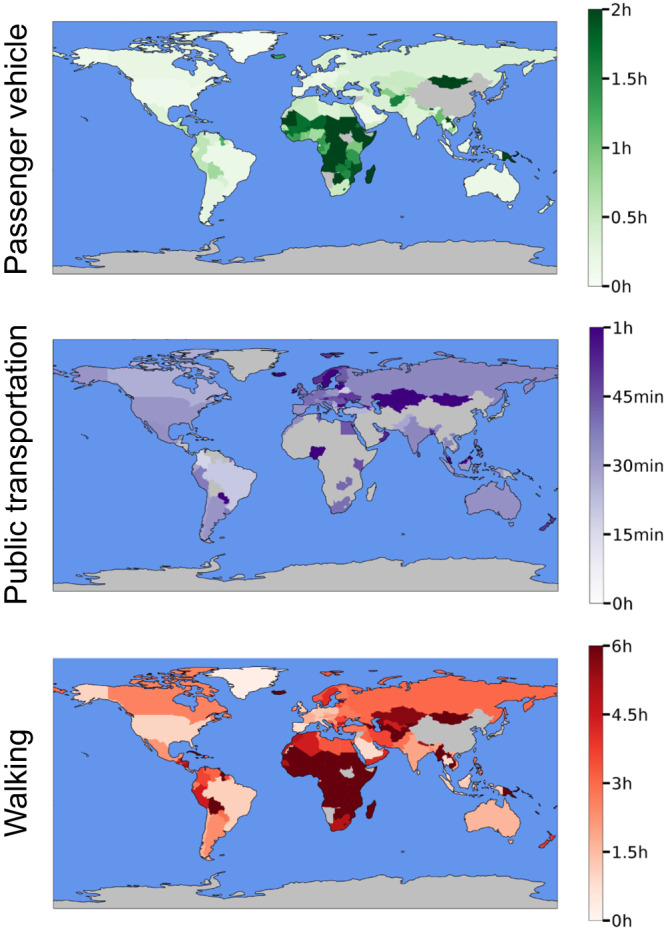
Methods: We introduce an approach for measuring accessibility by utilizing travel times to healthcare facilities from aggregated and anonymized smartphone Location History data. We measure these revealed travel times to healthcare facilities in over 100 countries and juxtapose our findings with potential (optimal) travel times estimated using Google Maps directions. We then quantify changes in revealed accessibility associated with the COVID-19 pandemic.
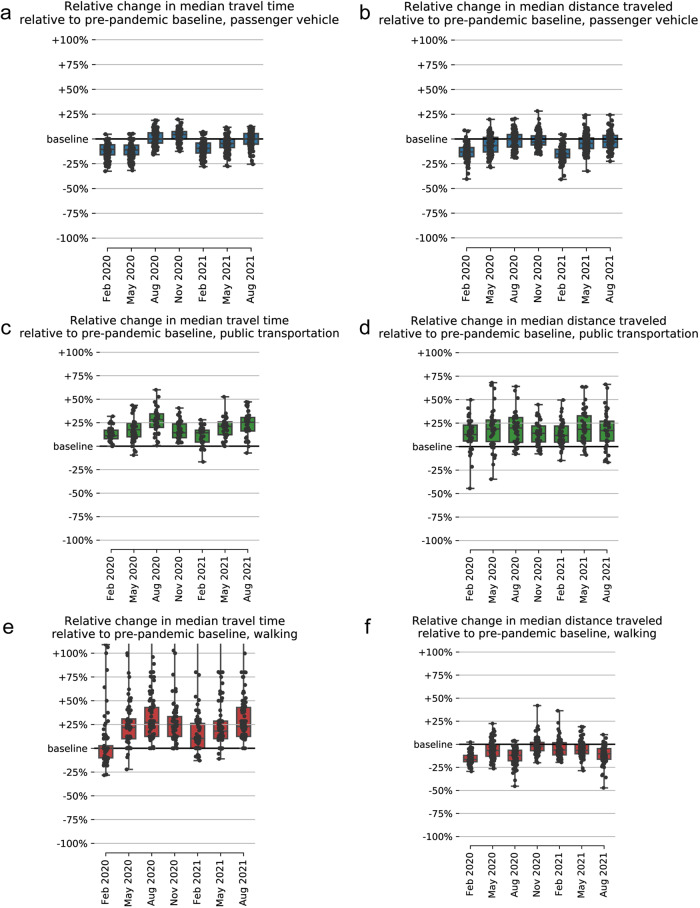
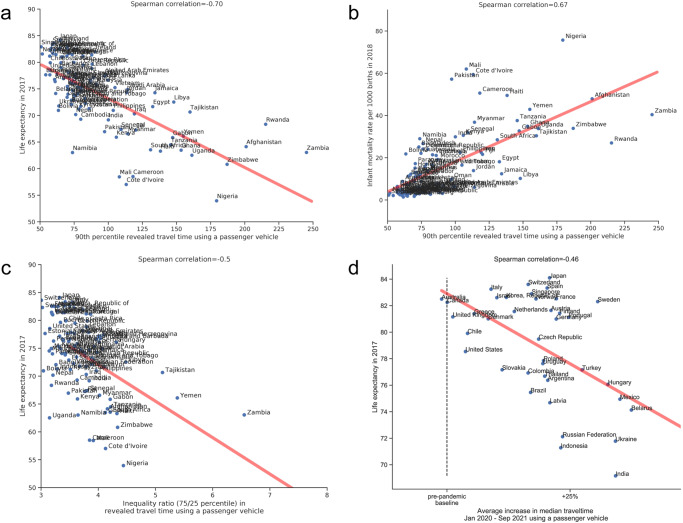
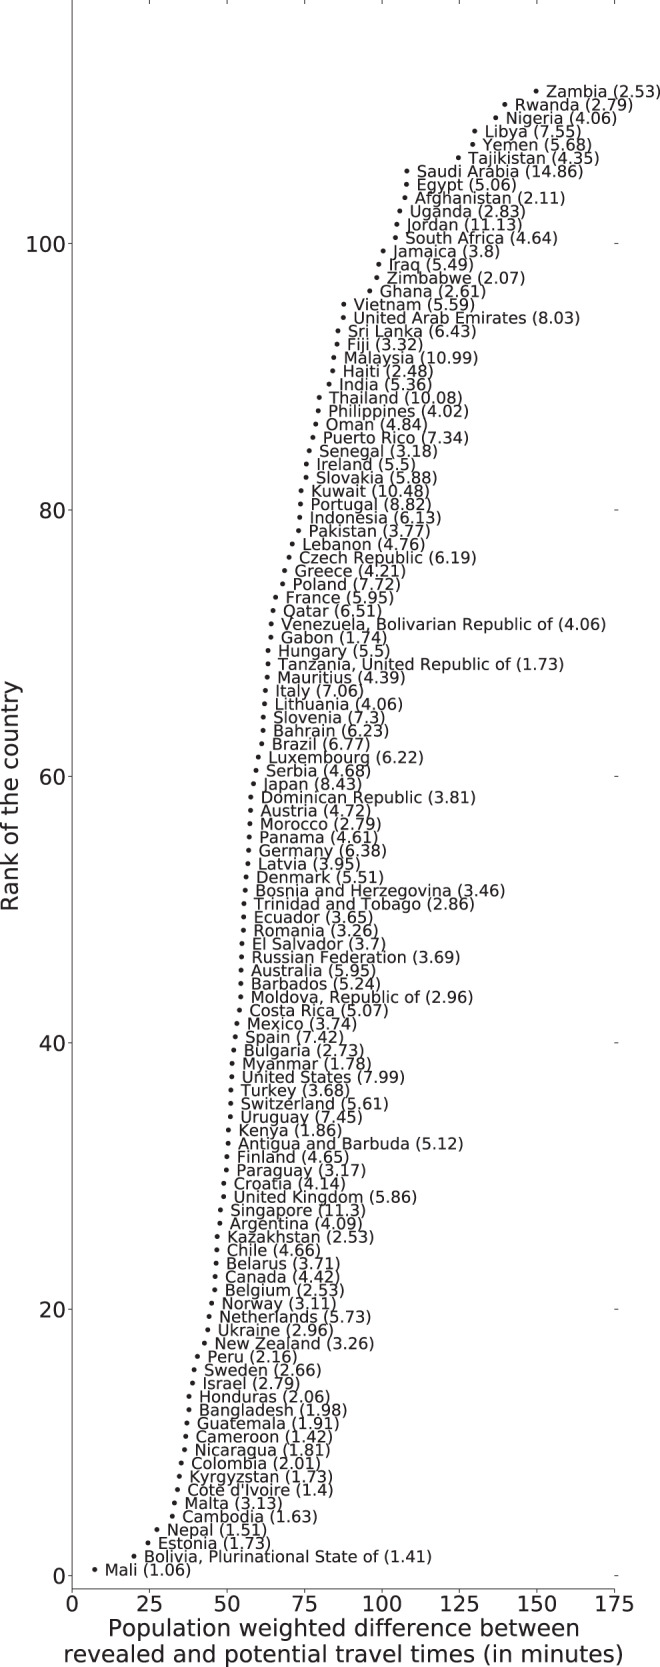
Results: We find that revealed travel time differs substantially from potential travel time; in all but 4 countries this difference exceeds 30 minutes, and in 49 countries it exceeds 60 minutes. Substantial variation in revealed healthcare accessibility is observed and correlates with life expectancy (⍴=-0.70) and infant mortality (⍴=0.59), with this association remaining significant after adjusting for potential accessibility and wealth. The COVID-19 pandemic altered the patterns of healthcare access, especially for populations dependent on public transportation.
Conclusions: Our metrics based on empirical data indicate that revealed travel times exceed potential travel times in many regions. During COVID-19, inequitable accessibility was exacerbated. In conjunction with other relevant data, these findings provide a resource to help public health policymakers identify underserved populations and promote health equity by formulating policies and directing resources towards areas and populations most in need.
Plain language summary
Spatial access to healthcare facilities (i.e., how long people need to travel to reach care) is important for understanding public health, but hard to measure. Most research so far has focused on theoretical (potential) travel times. Using anonymized smartphone location history data, we measure actual (revealed) travel times to healthcare facilities in over 100 countries. We find that revealed travel times exceed theoretical travel times in many regions of the world, meaning that in reality people travel longer to get healthcare. Our data also show that inequities in travel time became worse during the COVID-19 pandemic. When combined with other data, these results can help policymakers identify areas and populations at need, and direct resources to improve public health.
© 2023. The Author(s).
Conflict of interest statement
The Authors declare no Competing Non-Financial Interests but the following Competing Financial Interests. KG declares no Competing Financial Interests. DW is funded by the Bill and Melinda Gates Foundation. The funders had no role in study design, data collection and analysis, decision to publish, or preparation of the manuscript. CK, SB, YL, TS, and EG are current or past employees of Google and own Alphabet stock. KS declares no Competing Financial Interests.
Figures
Similar articles
-
Challenging terrains: socio-spatial analysis of Primary Health Care Access Disparities in West Virginia.Appl Spat Anal Policy. 2023;16(1):141-161. doi: 10.1007/s12061-022-09472-0. Epub 2022 Aug 10. Appl Spat Anal Policy. 2023. PMID: 35967757 Free PMC article.
-
Travel time to health facilities in areas of outbreak potential: maps for guiding local preparedness and response.BMC Med. 2019 Dec 30;17(1):232. doi: 10.1186/s12916-019-1459-6. BMC Med. 2019. PMID: 31888667 Free PMC article.
-
Using smartphone user mobility to unveil actual travel time to healthcare: An example of mental health facilities.Health Place. 2024 Nov;90:103375. doi: 10.1016/j.healthplace.2024.103375. Epub 2024 Oct 29. Health Place. 2024. PMID: 39471703
-
Global maps of travel time to healthcare facilities.Nat Med. 2020 Dec;26(12):1835-1838. doi: 10.1038/s41591-020-1059-1. Epub 2020 Sep 28. Nat Med. 2020. PMID: 32989313
-
The application of spatial measures to analyse health service accessibility in Australia: a systematic review and recommendations for future practice.BMC Health Serv Res. 2023 Apr 1;23(1):330. doi: 10.1186/s12913-023-09342-6. BMC Health Serv Res. 2023. PMID: 37005659 Free PMC article.
Cited by
-
Analysis of travel-time to HIV treatment in sub-Saharan Africa reveals inequities in access to antiretrovirals.Commun Med (Lond). 2025 May 12;5(1):169. doi: 10.1038/s43856-025-00890-y. Commun Med (Lond). 2025. PMID: 40355703 Free PMC article.
-
Advancing the frontiers of geographic accessibility to healthcare services.Commun Med (Lond). 2023 Nov 3;3(1):158. doi: 10.1038/s43856-023-00391-w. Commun Med (Lond). 2023. PMID: 37923833 Free PMC article.
-
Putting health facilities on the map: a renewed call to create geolocated, comprehensive, updated, openly licensed dataset of health facilities in sub-Saharan African countries.BMC Med. 2025 Apr 7;23(1):211. doi: 10.1186/s12916-025-04023-z. BMC Med. 2025. PMID: 40197252 Free PMC article.
References
-
- United Nations Sustainable Development. 2015; published online Jan 7. https://www.un.org/sustainabledevelopment/health/ (accessed March 25, 2022).
LinkOut - more resources
Full Text Sources
