. 2023 Nov 3;21(1):417.
doi: 10.1186/s12916-023-03131-y.

Six-hour time-restricted feeding inhibits lung cancer progression and reshapes circadian metabolism

Affiliations

Six-hour time-restricted feeding inhibits lung cancer progression and reshapes circadian metabolism

Dan Shi et al. BMC Med. .

Abstract

Background: Accumulating evidence has suggested an oncogenic effect of diurnal disruption on cancer progression. To test whether targeting circadian rhythm by dietary strategy suppressed lung cancer progression, we adopted 6-h time-restricted feeding (TRF) paradigm to elucidate whether and how TRF impacts lung cancer progression.

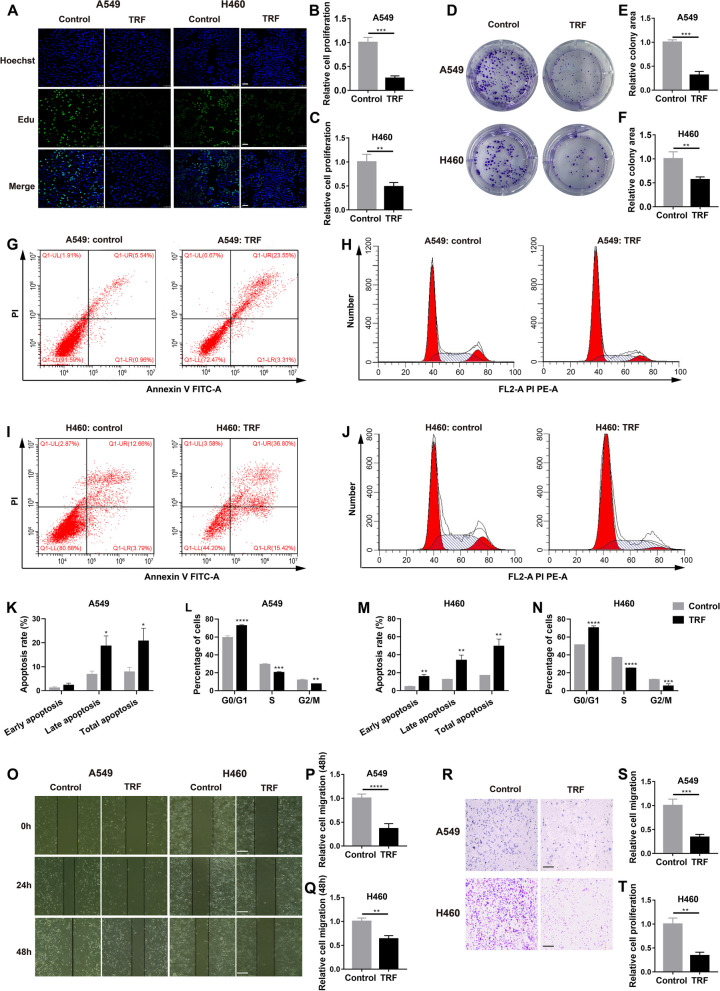
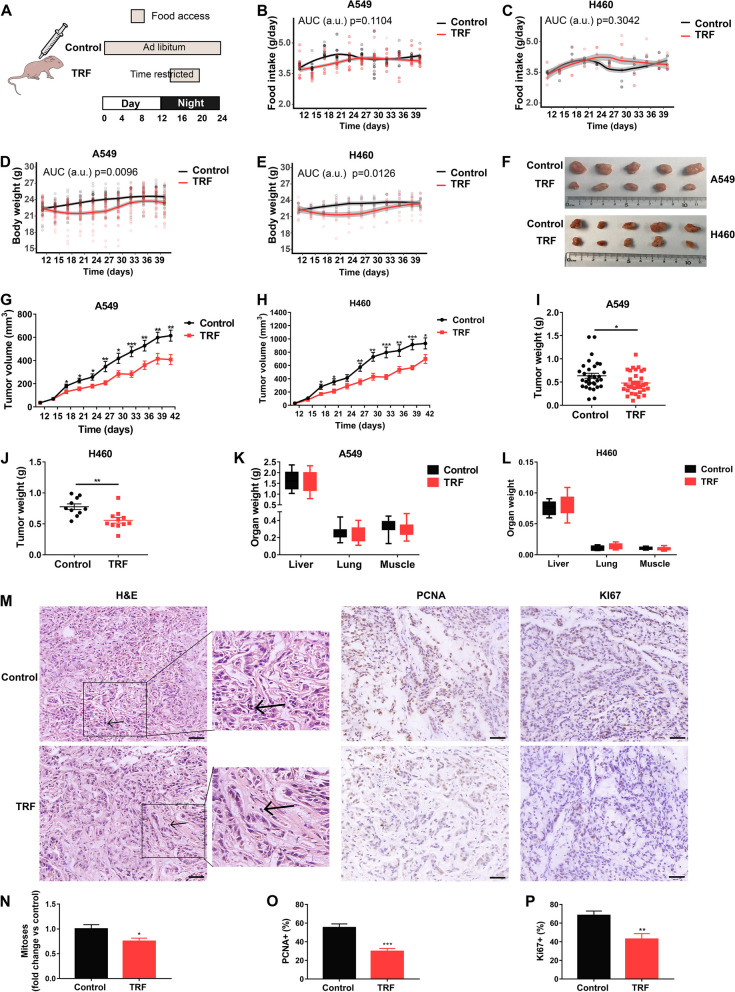
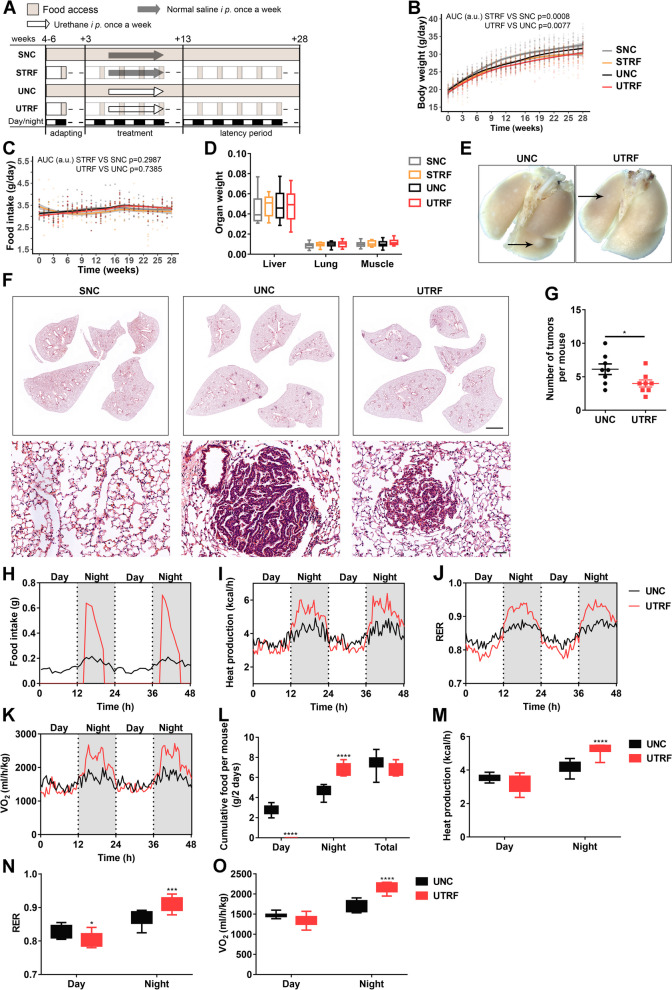
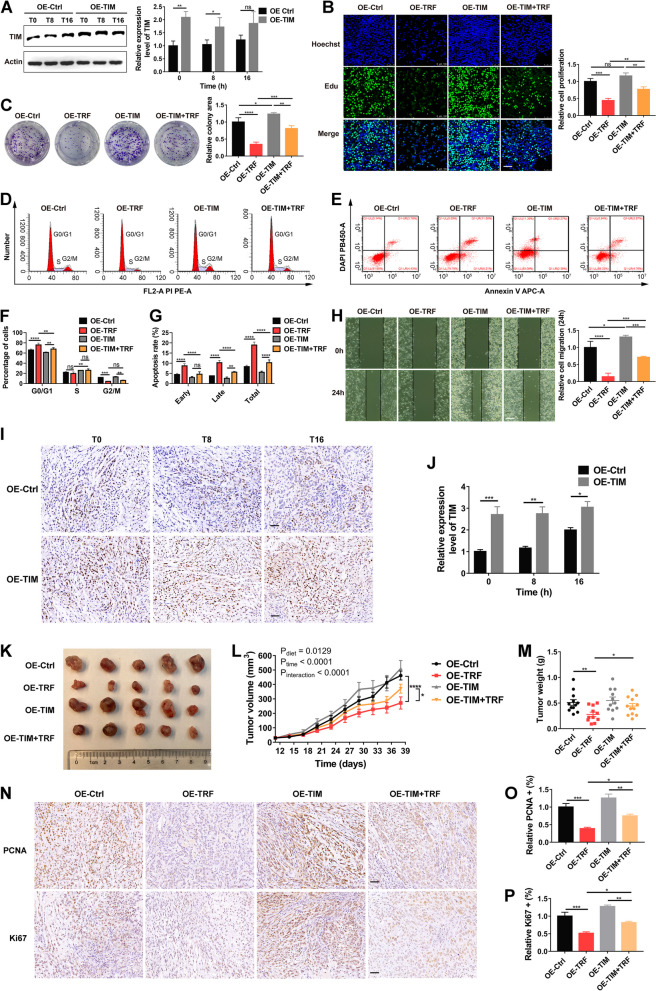
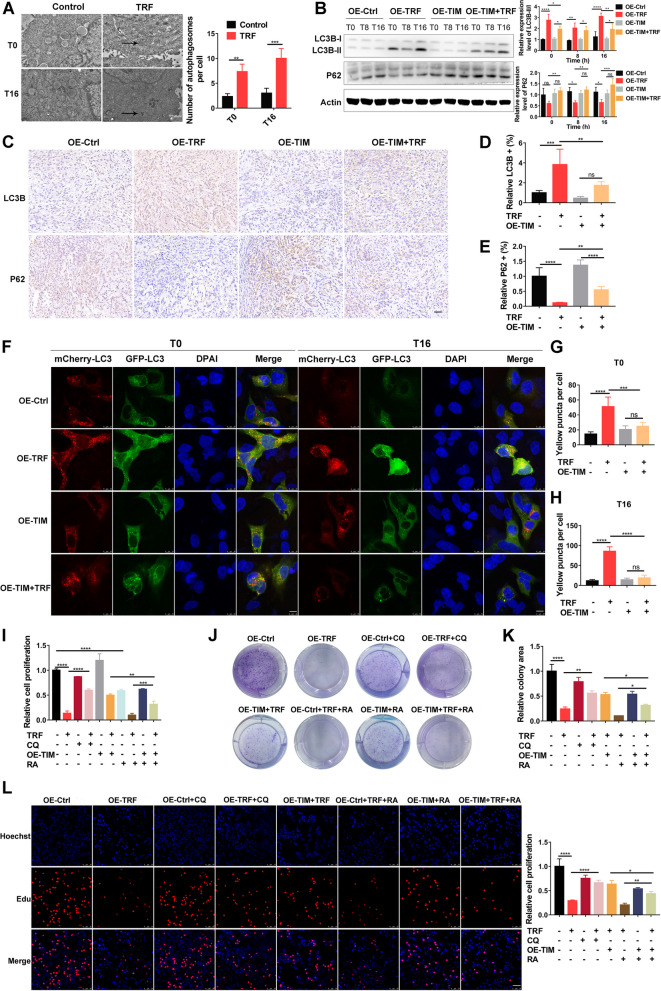
Methods: This study used multiple lung cancer cell lines, two xenograft mouse models, and a chemical-treated mouse lung cancer model. Stable TIM-knockdown and TIM-overexpressing A549 cells were constructed. Cancer behaviors in vitro were determined by colony formation, EdU proliferation, wound healing, transwell migration, flow cytometer, and CCK8 assays. Immunofluorescence, pathology examinations, and targeted metabolomics were also used in tumor cells and tissues. mCherry-GFP-LC3 plasmid was used to detect autophagic flux.

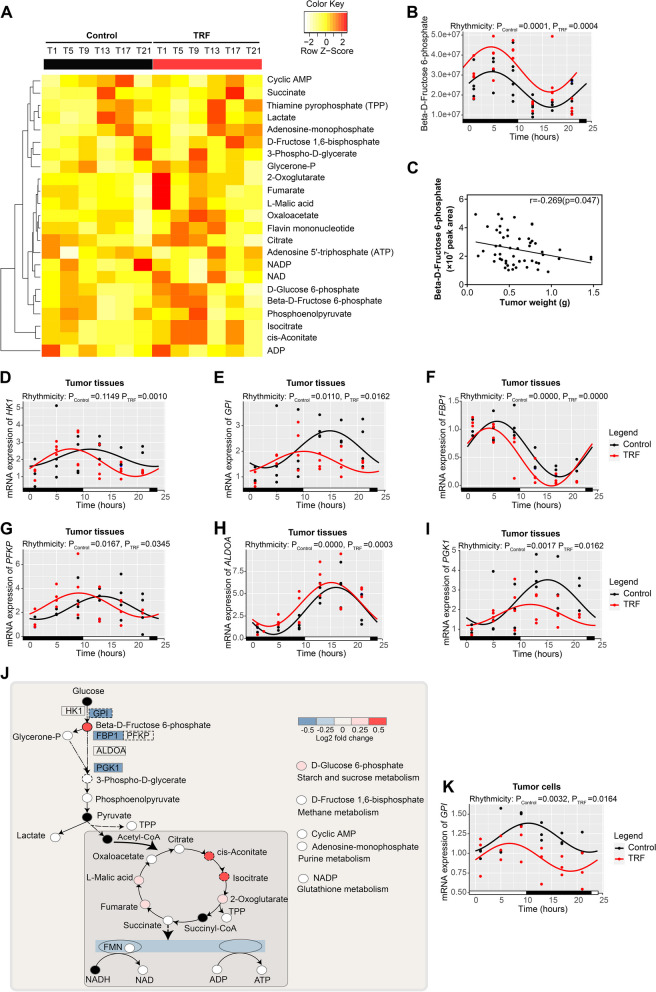
Results: We found for the first time that compared to normal ad libitum feeding, 6-h TRF inhibited lung cancer progression and reprogrammed the rhythms of metabolites or genes involved in glycolysis and the circadian rhythm in tumors. After TRF intervention, only timeless (TIM) gene among five lung cancer-associated clock genes was found to consistently align rhythm of tumor cells to that of tumor tissues. Further, we demonstrated that the anti-tumor effect upon TRF was partially mediated by the rhythmic downregulation of the TIM and the subsequent activation of autophagy. Combining TRF with TIM inhibition further enhanced the anti-tumor effect, comparable to treatment efficacy of chemotherapy in xenograft model.

Conclusions: Six-hour TRF inhibits lung cancer progression and reshapes circadian metabolism, which is partially mediated by the rhythmic downregulation of the TIM and the subsequent upregulation of autophagy.

Keywords: Autophagy; Circadian rhythm; Lung cancer; Progression; TIM; Time-restricted feeding.


Conflict of interest statement

The authors declare no conflict of interests.

Figures

Fig. 1
Fig. 1
TRF inhibits lung cancer cell proliferation and migration in vitro. A Representative images of EdU assay to detect the proliferation of A549 and H460 cells in the control and time-restricted feeding (TRF) groups (scale bar = 50 µm). Control intervention: normal control medium in a day, TRF intervention: normal control medium for 6 h and glucose-free and FBS-free medium for 18 h in a day. Repeat the intervention for 2 days. B, C Quantification of the EdU results for B A549 and c H460 cells (n = 3). DF Colony formation assay to determine the proliferation upon TRF with D representative images and quantification by E A549 and F H460 cells (n = 3). GN Flow cytometry assay. Annexin V staining for early apoptosis and PI staining for late apoptosis and cell cycle distribution. GJ Representative images showing the effect of TRF on G apoptosis and H cell cycle distribution in the A549 cell. IJ Representative images showing the I apoptosis and J cell cycle distribution of H460 cells treated with TRF. K, L Quantification of K apoptosis and L the cell cycle in A549 cells (n = 3). M, N Quantification of M apoptosis and N the cell cycle in H460 cells (n = 3). OQ Wound healing assay with O representative images (scale bar = 100 µm) and quantitative analysis performed with P A549 or Q H460 cells (n = 4). RT Transwell migration assays with R representative images (scale bar = 100 µm), and quantitative analysis performed with S A549 or T H460 cells (n = 3–4). Data were analyzed by a two-tailed Student’s t test or two-way ANOVA with Tukey’s post hoc test. Expression relative to the control. Error bars, when present, show the SD. *P < 0.05; **P < 0.01; ***P < 0.001; ****P < 0.0001
Fig. 2
Fig. 2
TRF attenuates lung cancer progression in two mouse xenograft models. A Schematic outline of the experimental design. B, C Food intake trajectories from the B A549 xenograft model and C H460 xenograft model (n = 30 mice per group). The dots on the graphs represent the values of individual mice. The gray outline represents the confidence interval. D, E Body weight trajectories from the D A549 xenograft model (n = 37–39 mice per group) and E H460 xenograft model (n = 10–11 mice per group). F Photograph of dissected tumors derived from the two xenograft models. G, H Tumor volume from the G A549 xenograft model (n = 37–39 mice per group) and H H460 xenograft model (n = 10–11 mice per group). I–J Tumor weight from the I A549 xenograft model (n = 33 mice per group) and J H460 xenograft model (n = 10–11 mice per group) at the end of the study. K, L Organ weight from the K A549 xenograft model (n = 33 mice per group) and L H460 xenograft model (n = 10–11 mice per group). Organ mass values are expressed as the organ weight relative to total body weight. M Histopathology. Representative H&E, PCNA, and Ki67 staining of tumor tissue from A549 xenograft model (scale bar = 50 µm), and the images of H&E-stained tumors on the right is an enlargement of the images on the left. The arrows indicate the mitoses. N–P Quantification of N mitoses, O PCNA-positive staining, and P Ki67-positive staining (n = 8 per group). Time-restricted feeding, TRF. Data were analyzed by area under the curve (AUC), two-tailed Student’s t test or two-way ANOVA with Tukey’s post hoc test. Error bars, when present, show the SEM. *P < 0.05; **P < 0.01; ***P < 0.001; ****P < 0.0001
Fig. 3
Fig. 3
TRF suppresses lung tumorigenesis in a urethane-administered mouse model. A Schematic illustration of the experimental design for the urethane-administered mouse model. B Body weight trajectories (n = 16–26 mice per group). The dots on the graphs represent the values of individual mice. The gray outline to the lines represents the confidence interval. C Food intake trajectories (SNC: n = 20 mice; STRF: n = 16 mice; UNC: n = 26 mice; UTRF: n = 24 mice). D Organ weight (SNC: n = 16–20 mice; STRF: n = 15–16 mice; UNC: n = 18–26 mice; UTRF: n = 16–24 mice). Organ mass values are expressed as the organ weight relative to total body weight. E Representative photographs of lung tumors. F H&E staining of whole-mount lungs showing reduced tumorigenesis following TRF in the top row and higher magnification images of H&E-stained lung tumors in the bottom row (top: scale bar = 2000 µm; bottom: scale bar = 50 µm). G Number of lung tumors at the end of the study (n = 8 mice per group). H–O Two 24-h energy metabolism cycles showing metabolic remodeling upon TRF (n = 8 mice per group, 24 weeks). The temporal patterns of H food intake, I heat production, J the respiratory exchange ratio (RER), and K oxygen consumption (VO2) is presented. Bar charts of L food intake, M heat production, N the RER, and O VO2 are shown. The data in H–K are shown as the mean. Data were analyzed by AUC, two-tailed Student’s t test, one-way ANOVA or two-way ANOVA with Tukey’s post hoc test. Saline-treated normal control, SNC; saline-treated time-restricted feeding, STRF; urethane-treated normal control, UNC; urethane-treated time-restricted feeding, UTRF. Error bars, when present, show the SEM. *P < 0.05; **P < 0.01; ***P < 0.001; ****P < 0.0001
Fig. 4
Fig. 4
TRF reshapes the rhythms of metabolites and genes implicated in glycolysis. A Heatmap showing reprogramming of energy metabolites in tumor tissues of mice inoculated with A549 tumor cells upon TRF versus control treatment. B Abundance of beta-d-fructose 6-phosphate in tumor tissues from the mouse xenograft model collected at different times (ZT1, 5, 9, 13, 17, 21) over 24 h (Control: n = 5–6 mice per timepoint; TRF: n = 4–5 mice per timepoint). ZT0 indicates 10 pm, which was the start of the TRF intervention during the experiment. C Correlation analysis between beta-d-fructose 6-phosphate level and tumor weight (n = 55 mice). D–I qRT–PCR detects mRNA expression of rate-limiting enzymes implicated in beta-d-fructose 6-phosphate metabolism including D HK1, E GPI, F FBP1, G PFKP, H ALDOA, and I PGK1, in tumor tissues at different times over 24 h (Control: n = 3–4 mice per timepoint; TRF: n = 3–4 mice per timepoint). J The abundance of metabolites and genes involved in energy metabolism between the TRF and control groups. Log2-fold changes in genes and metabolites are color-coded; red represents an increase and blue represents a decrease upon TRF compared to control. Black dots represent metabolites not detected by MS. Only enzymes detected by qRT‒PCR are shown. K mRNA expression of GPI gene in A549 tumor cells in vitro was measured by qRT‒PCR at different times over 24 h (n = 3). ZT0 indicates the end of the two cycles of 24-h TRF intervention. Data were analyzed and visualized with circacompare or by Pearson correlation analysis. Error bars, when present, show the SEM
Fig. 5
Fig. 5
TRF remodels the rhythmic expression of clock genes in vitro and in vivo. A Schematic illustration of in vitro sample collection. B–F mRNA expression in A549 tumor cells at different times (ZT1, 5, 9, 13, 17, 21); the genes included B CRY1, C CRY2, D FBXL3, E TIM, and F GPER1 (n = 3 per timepoint in each group). ZT0 indicates the end of the two cycles of 24-h TRF intervention. G Illustration of the sample collection for A549 xenograft-bearing mice. H–L Gene expression in tumor tissue at different times; the genes included H CRY1, I CRY2, J FBXL3, K TIM, and L GPER1 (n = 3–4 per timepoint in each group). ZT0 indicates 10 pm, which was the start of the TRF intervention in mice. M–R Visual plots showing rhythmic and AUC results for clock genes from different cell lines and A549 xenograft model tissues analyzed with circacompare package. M, N Rhythmicity in the M control and N TRF groups. Dark and light red both indicate rhythmicity in the control or TRF groups (P value < 0.05); light red indicates higher P value upon TRF versus control. O MESOR. Blue indicates that MESOR values were decreased upon TRF versus control, light gray identifies genes that could not be compared since there was no circadian oscillation in both groups, and white indicates nonsignificant results. P Amplitude upon TRF versus control. Light gray identifies genes that could not be compared, and white indicates nonsignificant results. Q Phase-shift upon TRF versus control. Red indicates P value < 0.05, light gray identifies genes that could not be compared, and white indicates nonsignificant results. R AUC analysis. Red and blue indicates higher and lower AUC values upon TRF versus control, respectively; white indicates nonsignificant results. Error bars, when present, show the SEM
Fig. 6
Fig. 6
TIM contributes to TRF-dependent changes in tumor suppression in vitro and in vivo. A The protein expression of TIM in stable TIM-overexpressing A549 cells. Left: representative blots; right: quantitative results. Expression relative to OE-control group at T0. B EdU proliferation assay in stable TIM-overexpressing A549 cells. Left: representative images (scale bar = 100 µm); right: quantitative results (n = 3). C Colony formation proliferation assay. Left: representative images; right: quantitative results (n = 3). D, E Representative images of a flow cytometry assay to detect D the cell cycle (PI staining) and E cell apoptosis (Annexin V staining for early apoptosis and DAPI staining for late apoptosis) in stable TIM-overexpressing A549 cells. F, G Quantification of the F cell cycle and G cell apoptosis (n = 3). H Wound healing migration assay. Left: representative images (scale bar = 100 µm); right: quantitative results (n = 3). I, J TIM expression of the xenograft model mice inoculated with stable TIM-overexpressing A549 cells detected by immunohistochemistry; I representative images (scale bar = 50 µm) and J quantification result (n = 3). K Photograph of dissected tumors from xenograft model mice injected with TIM-overexpressing A549 cells with or without TRF. L Tumor volume (n = 11–12 mice per group). M Tumor weight (n = 11–12 mice per group). NP Histopathology. N Representative PCNA and Ki67 staining of tumor tissue (scale bar = 50 µm). O, P Quantification of the O PCNA-positive staining and P Ki67-positive staining (n = 8 in each group). OE-Ctrl, negative-overexpression-control; OE-TRF, negative-overexpression-control with TRF; OE-TIM, TIM-overexpression; and OE-TIM + TRF, TIM-overexpression with TRF. Data were analyzed by one-way or two-way ANOVA with Tukey’s post hoc test. Data was expressed as mean ± SD for Fig. 6A–H and mean ± SEM for Fig. 6 J–P. *P < 0.05; **P < 0.01; ***P < 0.001; ****P < 0.0001
Fig. 7
Fig. 7
TIM overexpression attenuates the tumor-suppressive effect of TRF by regulating autophagy. Transmission electron microscopy shows autophagosomes in TRF-treated A549 cells. Left: representative images (scale bar = 1 µm); right: quantitative analysis (n = 3). Arrows indicate the autophagosomes. Autophagosomes were counted in 20 cells in three independent replicates. B The protein levels of LC3B and P62 in stable TIM-overexpressing A549 cells, left: representative blots; right: quantitative analysis (n = 3). ZT0 indicates the end of the two cycles of 24-h TRF intervention. C Immunohistochemistry. Representative LC3B and P62 staining of tumor tissue from A549 xenograft model mice injected with stable TIM-overexpressing cells (scale bar = 50 µm). D Quantification of LC3B-positive staining (n = 5 in each group). E Quantification of P62-positive staining (n = 5 in each group). FH Autophagic flux assays. Stable TIM-overexpressing A549 cells were transfected with mCherry-GFP-LC3 plasmids. F Representative images (scale bar = 10 µm). G, H Quantitative analysis of autophagosomes (mCherry + /GFP +) based on yellow puncta per cell at G T0 and H T16 (n = 3 in each group). I CCK-8 assay in stable TIM-overexpressing A549 cells after culture with 15 nM rapamycin (RA) for 12 h or 30 µM chloroquine (CQ) for 24 h with or without TRF (n = 3–4 in each group). J, K Colony formation assay in TIM-overexpressing cells after culture with RA or CQ upon TRF; J representative images, and K quantitative analysis (n = 3 in each group). L EdU assay. Left: representative images (scale bar = 75 µm); right: quantitative analysis (n = 3). OE-Ctrl, negative-overexpression-control; OE-TRF, negative-overexpression-control with TRF; OE-TIM, TIM-overexpression. Data were analyzed by one-way or two-way ANOVA with Tukey’s post hoc test. Error bars, when present, show the SD. *P < 0.05; **P < 0.01; ***P < 0.001; ****P < 0.0001
Fig. 8
Fig. 8
Combining TIM inhibition with TRF enhances antineoplastic efficacy in lung cancer. A TIM protein expression in A549 cells was robustly inhibited by a lentivirus expressing TIM-targeting shRNA (sh-TIM1 and sh-TIM2) versus control shRNA (sh-Ctrl) at ZT0, ZT8, and ZT16. ZT0 indicates the end of the two cycles of 24-h TRF intervention. Top: representative blots; bottom: quantitative results. B EdU proliferation assay in two stable TIM-knockdown A549 cell lines. Left: representative images (scale bar = 100 µm); right: quantitative results (n = 3). C Colony formation assay. Left: representative images; right: quantitative results (n = 3). D Wound healing assay. Left: representative blots (scale bar = 100 µm); right: quantitative results (n = 3–4). EF Representative images of a flow cytometry assay to evaluate the E cell cycle and F cell apoptosis of stably transfected TIM-knockout A549 cells. G, H Quantification analysis of the G cell cycle and H cell apoptosis data (n = 3). I TIM expression from ZT0, ZT8, and ZT16 in the xenograft mouse model inoculated with stable sh-TIM1 A549 cells was confirmed by immunohistochemistry. Left: representative images (scale bar = 50 µm); right: Quantification of TIM expression (n = 3). All expressions are relative to sh-Ctrl: T0. ZT0 indicates 10 pm, which was the start of the TRF intervention in mice. J Photograph of tumors formed by implantation of stable sh-TIM1 A549 cells. K Tumor volume (n = 11–13 mice per group). L Tumor weight (n = 11–13 mice per group). Data were analyzed by one-way or two-way ANOVA with Tukey’s post hoc test. sh-Ctrl, negative shRNA control; sh-TRF negative shRNA with TRF; sh-TIM1, TIM shRNA1; sh-TIM2, TIM shRNA2. Data was expressed as mean ± SD for Fig. 8A-H and mean ± SEM for Fig. 8I, K, L. *P < 0.05; **P < 0.01; ***P < 0.001; ****P < 0.0001

References

    1. Sung H, Ferlay J, Siegel RL, Laversanne M, Soerjomataram I, Jemal A, Bray F. Global Cancer Statistics 2020: GLOBOCAN estimates of incidence and mortality worldwide for 36 cancers in 185 countries. CA Cancer J Clin. 2021;71(3):209–249. doi: 10.3322/caac.21660. - DOI - PubMed
    1. Allemani C, Matsuda T, Di Carlo V, Harewood R, Matz M, Niksic M, Bonaventure A, Valkov M, Johnson CJ, Esteve J, et al. Global surveillance of trends in cancer survival 2000–14 (CONCORD-3): analysis of individual records for 37 513 025 patients diagnosed with one of 18 cancers from 322 population-based registries in 71 countries. Lancet. 2018;391(10125):1023–1075. doi: 10.1016/S0140-6736(17)33326-3. - DOI - PMC - PubMed
    1. Pariollaud M, Lamia KA. Cancer in the fourth dimension: what is the impact of circadian disruption? Cancer Discov. 2020;10(10):1455–1464. doi: 10.1158/2159-8290.CD-20-0413. - DOI - PMC - PubMed
    1. Shafi AA, Knudsen KE. Cancer and the circadian clock. Cancer Res. 2019;79(15):3806–3814. doi: 10.1158/0008-5472.CAN-19-0566. - DOI - PMC - PubMed
    1. Sulli G, Lam MTY, Panda S. Interplay between circadian clock and cancer: new frontiers for cancer treatment. Trends Cancer. 2019;5(8):475–494. doi: 10.1016/j.trecan.2019.07.002. - DOI - PMC - PubMed

Publication types