. 2024 Apr;46(2):1789-1806.
doi: 10.1007/s11357-023-00986-0. Epub 2023 Nov 4.

ATAC-clock: An aging clock based on chromatin accessibility

Affiliations

ATAC-clock: An aging clock based on chromatin accessibility

Francesco Morandini et al. Geroscience. 2024 Apr.

Abstract

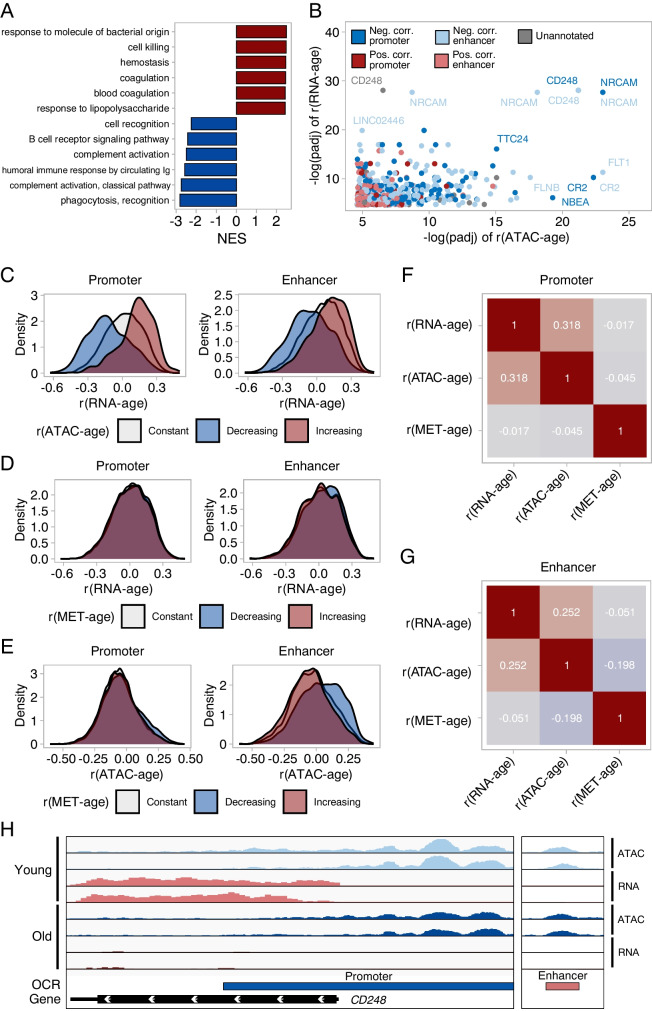
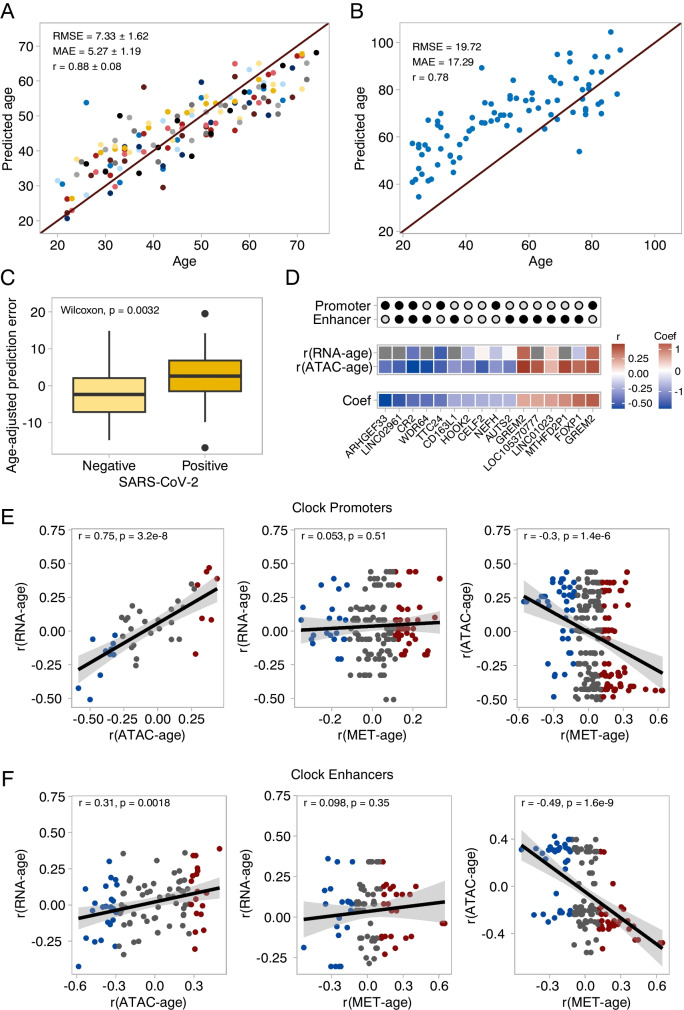
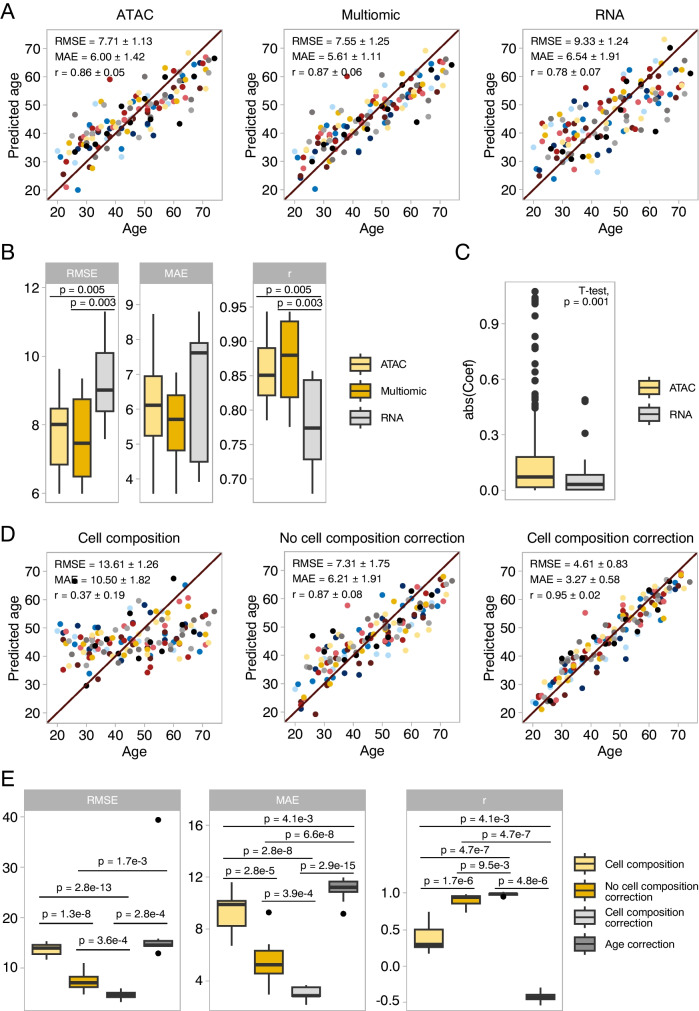
The establishment of aging clocks highlighted the strong link between changes in DNA methylation and aging. Yet, it is not known if other epigenetic features could be used to predict age accurately. Furthermore, previous studies have observed a lack of effect of age-related changes in DNA methylation on gene expression, putting the interpretability of DNA methylation-based aging clocks into question. In this study, we explore the use of chromatin accessibility to construct aging clocks. We collected blood from 159 human donors and generated chromatin accessibility, transcriptomic, and cell composition data. We investigated how chromatin accessibility changes during aging and constructed a novel aging clock with a median absolute error of 5.27 years. The changes in chromatin accessibility used by the clock were strongly related to transcriptomic alterations, aiding clock interpretation. We additionally show that our chromatin accessibility clock performs significantly better than a transcriptomic clock trained on matched samples. In conclusion, we demonstrate that the clock relies on cell-intrinsic chromatin accessibility alterations rather than changes in cell composition. Further, we present a new approach to construct epigenetic aging clocks based on chromatin accessibility, which bear a direct link to age-related transcriptional alterations, but which allow for more accurate age predictions than transcriptomic clocks.

Keywords: ATAC sequencing; Aging; Biomarker; Chromatin accessibility; Epigenetic clock.


Conflict of interest statement

K.P. and A.O. are co-founders and shareholders of EPITERNA SA (non-financial interests). A.O. is co-founder of Longevity Consultancy Group (non-financial interests). The rest of the authors have declared no financial or commercial conflict of interest.

Figures

Fig. 1
Fig. 1
Chromatin accessibility changes during aging. (A) PBMCs were isolated from blood samples of 159 healthy donors with a broad age distribution (20—74). ATAC-seq, RNA-seq, and flow cytometry profiles were generated from all samples. (B) Distribution of correlations between chromatin accessibility and age (Spearman’s r). Statistically significant closing OCRs are highlighted in blue, while statistically significant opening OCRs are highlighted in red (FDR < 0.01). (C) Annotation of statistically significant OCRs to regulatory elements. Enrichment for promoters and enhancers among opening and closing OCRs. Log(odds ratios) and p-values were calculated using Fisher’s Exact test. (D) GSEA of chromatin accessibility changes during aging. Gene ontology biological process terms are plotted against the normalized enrichment score (NES). Terms with the top six positive (red) and negative (blue) NES are shown. (E) Accessibility profiles at the top two opening and closing OCRs, shown for representative samples of different ages. The y axis was rescaled using the same scale factors used for normalization of raw counts. The last column represents a housekeeping gene whose accessibility did not change during aging. Young: 20—22 years; Middle-aged: 45—47 years, Old: 70—71 years. (F) Scatterplots of chromatin accessibility (log(TPM)) against age of four OCRs with the strongest age correlation. Pearson’s r and p-values are indicated
Fig. 2
Fig. 2
Integrative analysis of gene expression, chromatin accessibility and DNA methylation during aging. (A) GSEA of gene expression changes during aging. Gene ontology biological process terms are plotted against the normalized enrichment score (NES). Terms with the top six positive (red) and negative (blue) NES are shown. (B) Genes whose expression and accessibility at regulatory elements both correlated with age (Spearman’s r). The x-axis represents the significance of correlation in the ATAC-seq data while the y-axis represents the significance of correlation in the RNA-seq data. The significance of the correlation is represented by the -log of FDR-corrected p-values. (C) Distribution of gene expression age correlations of genes linked to promoters/enhancers which open during aging (Spearman’s r > 0, FDR < 0.01), close during aging (Spearman’s r < 0, FDR < 0.01) or do not change (FDR ≥ 0.01). (D) Distribution of gene expression age correlations of genes linked to CpGs in promoters/enhancers which gain methylation during aging (Spearman’s r > 0, FDR < 0.01), lose methylation during aging (Spearman’s r < 0, FDR < 0.01) or do not change (FDR ≥ 0.01). (E) Distribution of accessibility age correlations of OCRs containing CpGs which gain methylation during aging (Spearman’s r > 0, FDR < 0.01), lose methylation during aging (Spearman’s r < 0, FDR < 0.01) or do not change (FDR ≥ 0.01). (F) Pairwise correlations between gene expression age correlations, accessibility age correlations, CpG methylation age correlations, specifically in promoter regions. (G) Pairwise correlations between gene expression age correlations, accessibility age correlations, CpG methylation age correlations, specifically in enhancer regions. (H) ATAC-seq and RNA-seq coverage tracks for the gene CD248, whose expression and accessibility at promoter and enhancer both decrease with age. Two young and two old samples are shown. The y axis was rescaled using the same scale factors used for normalization of raw counts
Fig. 3
Fig. 3
Chromatin accessibility predicts age. (A) Age predictions of the chromatin accessibility clock. The scatter plot shows the test set predictions from each outer fold of nested cross-validation (11 different models, each sample in the test set once). Mean and standard deviation for root mean squared error (RMSE), median absolute error (MAE), and Pearson correlation coefficient (r) are shown. (B) Age predictions of a clock trained on all our chromatin accessibility data and tested on an external dataset by Marquez et al. (22) RMSE, MAE, and Pearson’s r are indicated. (C) Age predictions on SARS-CoV-2 positive and negative patients. Prediction errors were adjusted to account for overestimation of age of young individuals compared to old. Statistical tests for unadjusted predictions are included in the main text. (D) Annotation of the 16 OCRs with the higher absolute coefficients in the final model ranked. Clock coefficients and age correlation of chromatin accessibility and gene expression level are shown for each OCR/gene pair. (E) Relationship between changes in gene expression, chromatin accessibility, and DNA methylation at promoters selected by the clock. (F) Relationship between changes in gene expression, chromatin accessibility, and DNA methylation at enhancers selected by the clock
Fig. 4
Fig. 4
Chromatin accessibility allows for better age prediction than gene expression. Correcting for cell composition improves clock accuracy. (A) Age predictions of chromatin accessibility, transcriptomic and multiomic clocks trained on matched samples (n = 132). RMSE, MAE, and Pearson’s r are indicated. (B) Score comparison of the chromatin accessibility, transcriptomic and multiomic clocks. Inner boxplots depict medians and first and third quartiles, with whiskers extending up to 1.5 × interquartile range. p-values were calculated using a two-tailed T-test. (C) Absolute coefficients of gene and OCR features selected by the multiomic clock. Features were standardized prior to clock training, bringing gene expression and chromatin accessibility features to the same scale (D) Age predictions of clocks trained on cell composition alone, chromatin accessibility without cell composition correction, and chromatin accessibility with cell composition correction (n = 142). (E) Score comparison of the cell composition, chromatin accessibility, and corrected chromatin accessibility clocks

References

    1. López-Otín C, Blasco MA, Partridge L, Serrano M, Kroemer G. The Hallmarks of Aging. Cell. 2013;153(6):1194–1217. doi: 10.1016/j.cell.2013.05.039. - DOI - PMC - PubMed
    1. Partridge L, Deelen J, Slagboom PE. Facing up to the global challenges of ageing. Nature. 2018;561(7721):45–56. doi: 10.1038/s41586-018-0457-8. - DOI - PubMed
    1. Booth LN, Brunet A. The Aging Epigenome. Mol Cell. 2016;62(5):728–744. doi: 10.1016/j.molcel.2016.05.013. - DOI - PMC - PubMed
    1. Bocklandt S, Lin W, Sehl ME, Sánchez FJ, Sinsheimer JS, Horvath S, et al. Epigenetic Predictor of Age. PLoS One. 2011;6(6):e14821. doi: 10.1371/journal.pone.0014821. - DOI - PMC - PubMed
    1. Garagnani P, Bacalini MG, Pirazzini C, Gori D, Giuliani C, Mari D, et al. Methylation of ELOVL2 gene as a new epigenetic marker of age. Aging Cell. 2012;11(6):1132–1134. doi: 10.1111/acel.12005. - DOI - PubMed

Publication types