. 2023 Nov 14;56(11):2523-2541.e8.
doi: 10.1016/j.immuni.2023.10.004. Epub 2023 Nov 3.

Gasdermin D permeabilization of mitochondrial inner and outer membranes accelerates and enhances pyroptosis

Affiliations

Gasdermin D permeabilization of mitochondrial inner and outer membranes accelerates and enhances pyroptosis

Rui Miao et al. Immunity. .

Abstract

Gasdermin D (GSDMD)-activated inflammatory cell death (pyroptosis) causes mitochondrial damage, but its underlying mechanism and functional consequences are largely unknown. Here, we show that the N-terminal pore-forming GSDMD fragment (GSDMD-NT) rapidly damaged both inner and outer mitochondrial membranes (OMMs) leading to reduced mitochondrial numbers, mitophagy, ROS, loss of transmembrane potential, attenuated oxidative phosphorylation (OXPHOS), and release of mitochondrial proteins and DNA from the matrix and intermembrane space. Mitochondrial damage occurred as soon as GSDMD was cleaved prior to plasma membrane damage. Mitochondrial damage was independent of the B-cell lymphoma 2 family and depended on GSDMD-NT binding to cardiolipin. Canonical and noncanonical inflammasome activation of mitochondrial damage, pyroptosis, and inflammatory cytokine release were suppressed by genetic ablation of cardiolipin synthase (Crls1) or the scramblase (Plscr3) that transfers cardiolipin to the OMM. Phospholipid scramblase-3 (PLSCR3) deficiency in a tumor compromised pyroptosis-triggered anti-tumor immunity. Thus, mitochondrial damage plays a critical role in pyroptosis.

Keywords: CRLS1; GSDMD; IL-1; PLSCR3; cardiolipin; mitochondria; pyroptosis.


Conflict of interest statement

Declaration of interests J.L. and H.W. are cofounders and advisors of Ventus Therapeutics. J.C.K. consults and holds equity in Corner Therapeutics, Larkspur Biosciences, and Neumora Therapeutics.

Figures
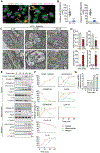
Figure 1.
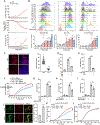
Figure 1.. Pyroptosis damages mitochondria.
(A-B) LPS-primed THP-1 were treated with nigericin for 1 h. (A) Confocal fluorescence live cell images of LPS+nigericin-treated THP1 stained with MitoTracker Deep Red (MTDR), MitoTracker green (MTG) and PI (left) or TMRM, MTG and SYTOX Deep Red (SYTOX DR) (right). White arrows indicate pyroptotic cells. Scale bar: 5 μm. (B) Relative mean fluorescence intensity (MFI) of MTDR and TMRM in PI or SYTOX negative and positive cells, normalized to MTG. (C-D) LPS-primed THP-1 were treated with nigericin for indicated times. Transmission electron microscopy images of LPS+nigericin-treated THP1 at indicated times (C). Lower panels show higher magnification of the boxed area in upper panels. Black arrows indicate normal mitochondria; yellow arrows, mitochondria with loss of cristae or membrane damage; red arrow, damaged mitochondria within an autophagosome. Scale bars: 500 nm. Mitochondrial (mito) mean length and number, percentage of damaged mitochondria, and mitophagosome number were quantified (D). (E-G) THP-1 were LPS+nigericin-treated for indicated times. Immunoblots probed for indicated proteins in cytosolic and mitochondrial fractions and culture supernatants (E) and densitometry of 3 independent experiments (F). (G) Cytosolic mtDNA by qPCR, normalized to time 0. Data are mean ± s.d. of at least 50 cells (B), 8 cells or 50 mitochondria (mean length) or at least 100 mitochondria (percentage of damaged mitochondria) (D), or biological triplicates (F, G), and are representative of 3 independent experiments, analyzed by two-tailed Student’s t-test (B, D) or one-way ANOVA using the Holm-Sidak method for multiple comparisons (G). **P<0.01; ***P<0.001. Please also see Figure S1.
Figure 2.
Figure 2.. Mitochondrial damage occurs before plasma membrane damage and enhances pyroptosis.
(A) Kinetic analysis of DCF and TMRM intensity and SYTOX green uptake in LPS- or LPS+nigericin-treated THP-1 by plate reader. * indicate first time the variable significantly changed. (B) Flow cytometry histograms (top) and quantification of multiple samples (bottom) of LPS+nigericin-treated THP1 stained with MitoSOX, DiIC1(5) or SYTOX Green. P: positive control (Antimycin A for MitoSOX, CCCP for DiIC1(5), and Triton X-100 for SYTOX Green); UNT: untreated. (C-E) iBMDMs were untreated (UNT) or treated with ethidium bromide (EB) for 5 days. (C) Confocal fluorescence images (left) and MitoTracker MFI quantification in individual cells (right). Cell death by LDH release (D) or CellTiter-Glo assay (E) 1 h after adding LPS+nigericin (D) or LPS transfection (trans) (E). (F-I) iBMDMs, pre-treated with MitoTEMPO for 30 min, were treated with nigericin (F, G), LPS transfection (H), or poly(dA:dT) (I). Cell death was measured by SYTOX green uptake (F) or CellTiter-Glo assay (G-I). (J-L) iBMDMs stably expressing HyPer7-DAAO-nuclear export signal (NES) (J, K) or HyPer7-DAAO-nuclear localization sequence (NLS) (L) were pre-incubated with D- or L-alanine for 4 h. (J) Confocal fluorescence images (left) and the quantification of their ratio in multiple experiments (right). (K, L) LPS+nigericin-induced cell death in cells expressing Hyper7-DAAO-NES (K) or Hyper7-DAAO-NLS (L) assessed by SYTOX green uptake. Data are mean ± s.d. of 100 cells (C), 30 cells (J), or biological triplicates, and are representative of 3 independent experiments, analyzed by multiple t-tests (A), two-tailed Student’s t-test (C, J) or one-way ANOVA using the Holm-Sidak method for multiple comparisons (B, D-I, K, L). *P<0.05; **P<0.01; ***P<0.001. Please also see Figure S1.
Figure 3.
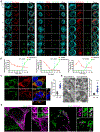
Figure 3.. GSDMD-NT translocates to and damages mitochondria before the plasma membrane.
(A-B) Mitochondrial damage and cell death assessed by live cell imaging of iBMDMs stably expressing DOX-inducible GSDMD-NT(I105N)-BFP and co-stained with MitoTracker Deep Red and PI (left), TMRM and SYTOX Deep Red (SYTOX DR) (middle) or MitoSOX Red and PI (right), imaged beginning 6 h after adding DOX. Time 0 indicates first detection of PI or SYTOX in the cell (blue dashed lines). Scale bar: 2 μm. Time lapse images (A) and quantification of relative fluorescence dye intensity in individual cells (B). (C-E) HEK293T transiently transfected to express Flag-GSDMD-FL or Flag-GSDMD-NT and analyzed 18 h later. (C) Confocal fluorescence images stained for COX IV, Flag and DAPI (left). XZ and YZ projections are shown. Scale bar: 5 μm. Quantification of Pearson’s correlation of COX IV and Flag (right). (D) Structured Illumination Microscopy (SIM) images stained for COX IV and Flag. Higher magnification images and 3D rendering of the boxed area are shown. Scale bar: 5 μm or as indicated. (E) Transmission electron microscopy images stained with Flag-immunogold (left). Lower panels show higher magnification of the boxed area in upper panels; yellow dashed lines outline mitochondria. Scale bar: 500 nm. Quantification of gold particles in mitochondria (mito) versus cytosol (right). Data are mean ± s.d. of 3 cells (B), at least 30 cells (C) or at least 30 mitochondria (E), and are representative of 3 independent experiments, analyzed by two-tailed Student’s t-test. ***P<0.001. Please also see Figures S2 and S3.
Figure 4.
Figure 4.. GSDMD-NT permeabilizes and damages isolated mitochondria.
Mitochondria isolated from HCT116 (A-E) or iBMDMs (F-G) treated with GSDMD and/or caspase-11 or t-Bid in the presence or absence of z-VAD-FMK or disulfiram (DSF) for 45 min or indicated times. (A, B, F) Immunoblots of post-treatment supernatant or mitochondria (A, F) and densitometry of multiple experiments (B). (C, G) mtDNA in supernatants by qPCR, normalized to untreated mitochondria. (D, E) Flow cytometry histograms of MitoSOX Red (D) or DiIC1(5) (E) stained mitochondria (left) and quantification of MFI of treated mitochondria, relative to MFI of untreated mitochondria (right). CCCP and antimycin A were positive controls. Data are mean ± s.d. of biological triplicates, and are representative of 3 independent experiments, analyzed by one-way ANOVA using the Holm-Sidak method for multiple comparisons. **P<0.01; ***P<0.001.
Figure 5.
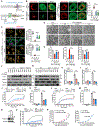
Figure 5.. OMM cardiolipin is required for GSDMD-mediated mitochondrial damage, pyroptosis, and anti-tumor immune response.
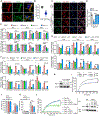
(A) Schematic of cardiolipin synthesis and translocation. (B) Confocal live cell imaging of LPS- or LPS+nigericin-treated WT, Plscr3−/− or Crls1−/− iBMDMs expressing mNG-GSDMD, stained for MitoTracker Deep Red 30 min after adding nigericin. White arrows indicate mitochondrial recruitment of GSDMD. Pearson’s correlation of MitoTracker and mNG-GSDMD (right). (C-M) LPS-primed WT, Crls1−/− or Plscr3−/− iBMDMs were treated with nigericin. (C) Confocal live cell images stained for MitoTracker Deep Red (MTDR), MitoTracker green (MTG) and PI (left) or TMRM, MTG and SYTOX Deep Red (SYTOX DR) (middle) 1 h after nigericin treatment (Scale bar: 5 μm) and quantification of relative mean fluorescence intensity (MFI) of MTDR and TMRM (right). (D, E) Transmission electron microscopy images 1 h after adding nigericin (D) and quantification of mitochondrial (mito) number, mean length and damaged mitochondria (E). Lower panels show magnification of the area marked in upper panels. Black arrows, normal mitochondria; yellow arrows, mitochondria with loss of cristae or membrane damage. Scale bars: 500 nm. (F, G) Immunoblots of whole cell lysates (WCL), cytosolic (cyto) and mitochondrial (mito) fractions of LPS-primed iBMDMs 30 min after no treatment or nigericin. (H, I) Cytosolic mtDNA by qPCR normalized to untreated WT cells. (J-M) Cell death by PI uptake (J, L) or LDH release after 30 min (K, M). (N-P) Comparison of growth of subcutaneous WT J774 tumors injected after mixing with LPS+nigercin- or mitomycin C (MMC)-pretreated, WT or Plscr3−/− J774. (N) Immunoblot of control (CTL) WT or Plscr3−/− J774 lysates probed for PLSCR3 and β-actin. (O) SYTOX green uptake after in vitro treatment with LPS or LPS+nigericin. (P) WT J774 tumor volume after mixing with LPS+nigericin (left) or MMC (right) pretreated CTL or Plscr3−/− J774. Data are mean ± SEM of 5 mice and are representative of 2 independent experiments. The area under the curve was compared by two-tailed Student’s t-test. Data are mean ± s.d. of at least 30 cells (B, C), 8 cells or 50 mitochondria (mean length) or at least 100 mitochondria (percent damaged mitochondria) (E), or biological triplicates (H-M, O), and are representative of 3 independent experiments unless otherwise indicated, analyzed by one-way ANOVA using the Holm-Sidak method for multiple comparisons. *P<0.05; **P<0.01; ***P<0.001. Please also see Figures S4 and S5.
Figure 6.
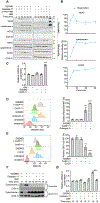
Figure 6.. OMM cardiolipin is weakly exposed under basal conditions but increases in response to mitochondrial oxidants or activated GSDMD.
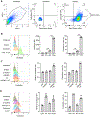
HEK293T isolated mitochondria were treated with Triton (B), GSDMD engineered with a linker 3C proteinase cleavage site and/or 3C proteinase (C), or mitochondrial poisons [Antimycin A (AA), Rotenone (Rot) or FCCP] (D) for 45 min and stained with MitoTracker Green and anti-cardiolipin. (A) Flow cytometry gating strategy for isolated mitochondria. (B-D) Flow cytometry histograms of anti-cardiolipin stained mitochondria (left), quantification of cardiolipin MFI relative to untreated (UNT) mitochondria (middle), and percentage of cardiolipin+ mitochondria (right). UNS: unstained, ISO: isotype staining control without treatment; UNT: untreated control stained for cardiolipin. Data are mean ± s.d. of biological triplicates, and are representative of 3 independent experiments, analyzed by one-way ANOVA using the Holm-Sidak method for multiple comparisons. *P<0.05; **P<0.01; ***P<0.001.
Figure 7.
Figure 7.. Pyroptosis causes cardiolipin-dependent PNPT1 release and mRNA decay.
(A, B) (A) Confocal fluorescence images of iBMDMs, primed with LPS and then treated or not with nigericin for 30 min, and stained for MitoTracker Deep Red, PNPT1 and DAPI. Scale bar: 5 μμm. (B) Pearson’s correlation of MitoTracker and PNPT1. (C, D) Poly(A) mRNA and 18S rRNA visualized by FISH in indicated LPS-primed iBMDMs treated or not with nigericin for 30 min. Confocal images (C) and quantification of the fluorescence intensity of poly(A) versus 18S (D). Scale bar: 20 μm. (E-G) WT, Crls1−/− or Plscr3−/− iBMDMs, rescued to express WT or mutant PLSCR3 (F) or CRLS1 (G) or neither (E) were treated with LPS or LPS+nigericin for 30 min or infected with Salmonella for 1 h. Housekeeping gene mRNAs relative to 7SL and normalized to the ratio in untreated WT cells. (H-L) Effect of Pnpt1 genetic ablation on pyroptosis. (H) Immunoblot of iBMDM cell lysates of control (CTL) WT or Pnpt1−/− clones. Pyroptosis in WT or Pnpt1-deficient after treatment with LPS or LPS+nigericin by SYTOX Green (I), LPS electroporation by CellTiter-Glo (J), or Salmonella infection by LDH release (K). (L) Pnpt1−/− iBMDMs, rescued with empty vector (EV), WT or RNase-defective PNPT1, were analyzed for PI uptake after treatment with LPS or LPS+nigericin. PNPT1 expression by immunoblot (right). Data are mean ± SEM of at least 50 cells (B), 5 images (D), or biological triplicates, and are representative of 3 independent experiments, analyzed by two-tailed Student’s t-test (B), one-way ANOVA using the Holm-Sidak method (D, I- L), or two-way ANOVA using the Tukey method (E-G) for multiple comparisons. ***P<0.001. Please also see Figures S6 and S7.

References

    1. Liu X, and Lieberman J (2017). A Mechanistic Understanding of Pyroptosis: The Fiery Death Triggered by Invasive Infection. Adv Immunol 135, 81–117. 10.1016/bs.ai.2017.02.002. - DOI - PMC - PubMed
    1. Zanoni I, Tan Y, Di Gioia M, Broggi A, Ruan J, Shi J, Donado CA, Shao F, Wu H, Springstead JR, and Kagan JC (2016). An endogenous caspase-11 ligand elicits interleukin-1 release from living dendritic cells. Science 352, 1232–1236. 10.1126/science.aaf3036. - DOI - PMC - PubMed
    1. Shi J, Zhao Y, Wang K, Shi X, Wang Y, Huang H, Zhuang Y, Cai T, Wang F, and Shao F (2015). Cleavage of GSDMD by inflammatory caspases determines pyroptotic cell death. Nature 526, 660–665. 10.1038/nature15514. - DOI - PubMed
    1. Kayagaki N, Stowe IB, Lee BL, O'Rourke K, Anderson K, Warming S, Cuellar T, Haley B, Roose-Girma M, Phung QT, et al. (2015). Caspase-11 cleaves gasdermin D for non-canonical inflammasome signalling. Nature 526, 666–671. 10.1038/nature15541. - DOI - PubMed
    1. Liu X, Zhang Z, Ruan J, Pan Y, Magupalli VG, Wu H, and Lieberman J (2016). Inflammasome-activated gasdermin D causes pyroptosis by forming membrane pores. Nature 535, 153–158. 10.1038/nature18629. - DOI - PMC - PubMed

Publication types

MeSH terms