. 2023 Nov 4;14(1):7081.
doi: 10.1038/s41467-023-42625-4.

Tissue-resident B cells orchestrate macrophage polarisation and function

Affiliations

Tissue-resident B cells orchestrate macrophage polarisation and function

Ondrej Suchanek et al. Nat Commun. .

Abstract

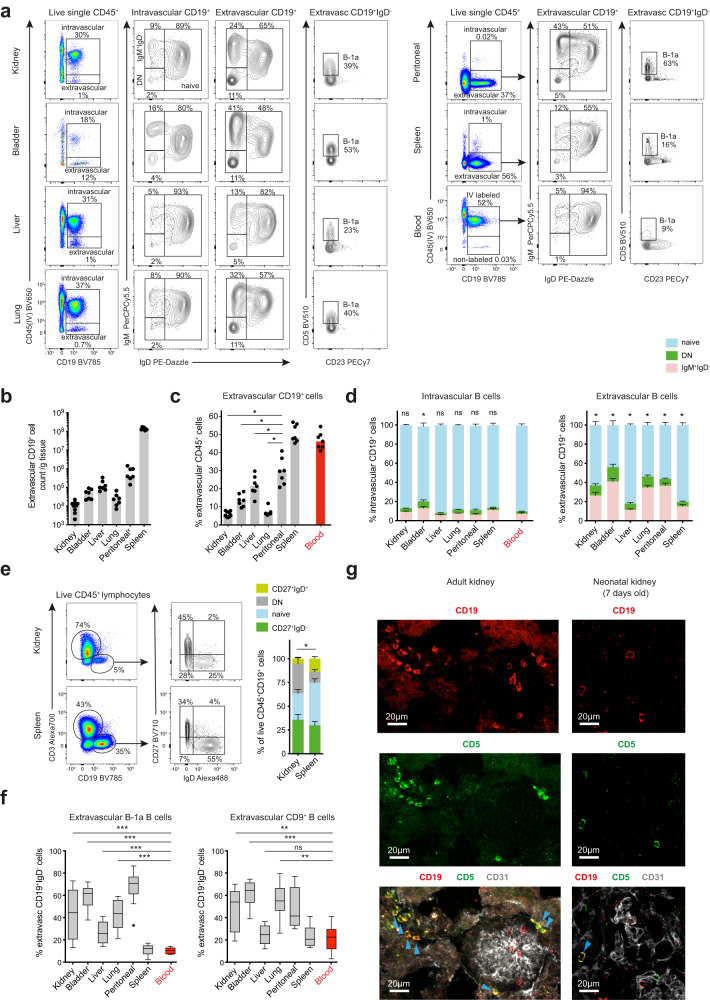
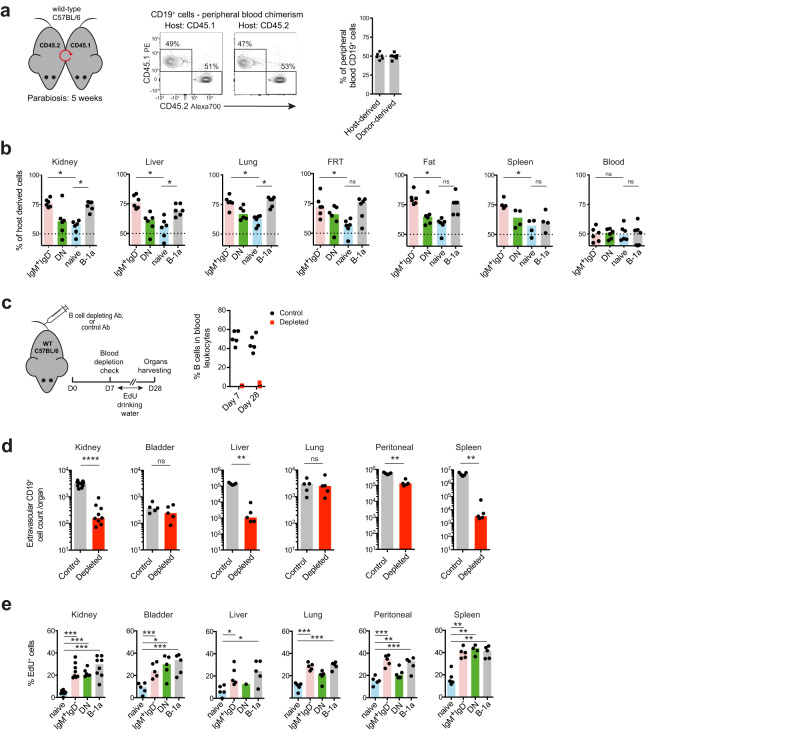
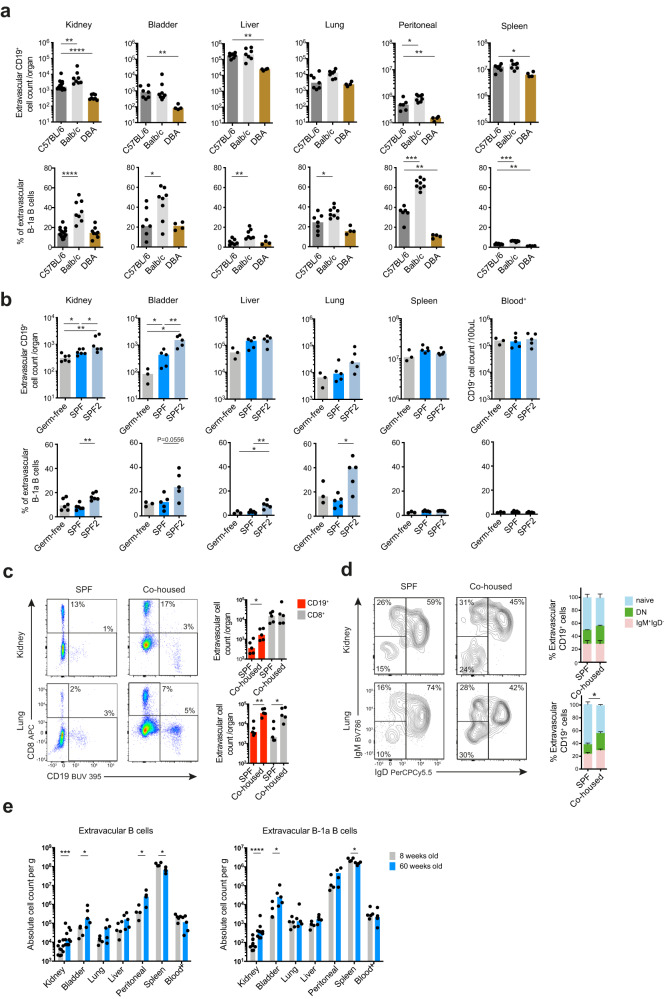
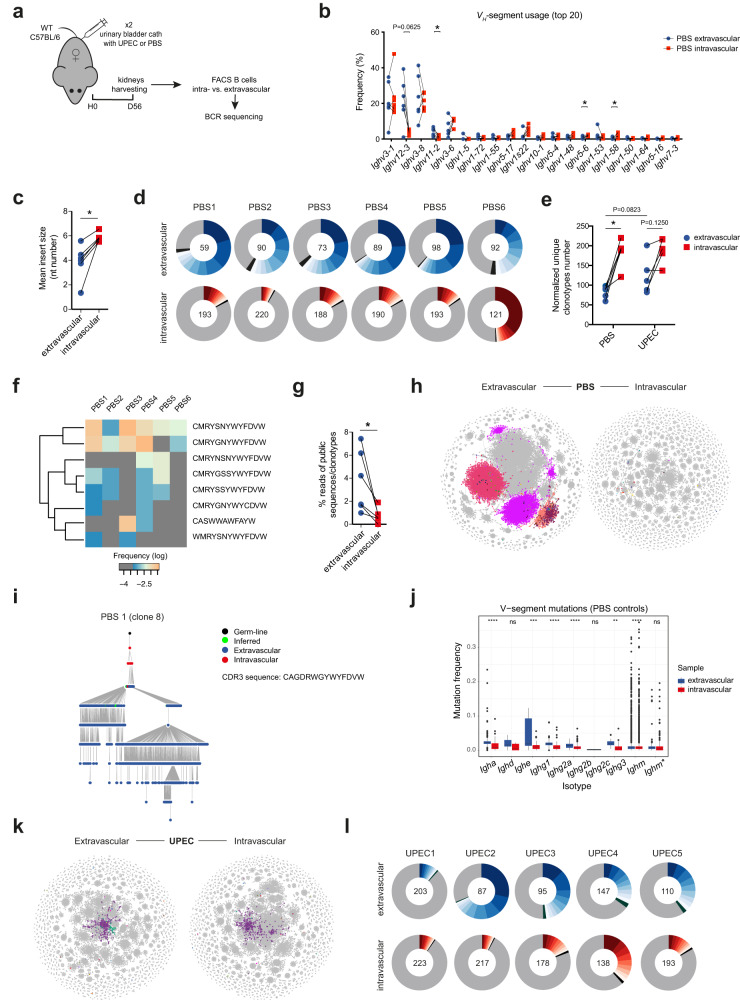
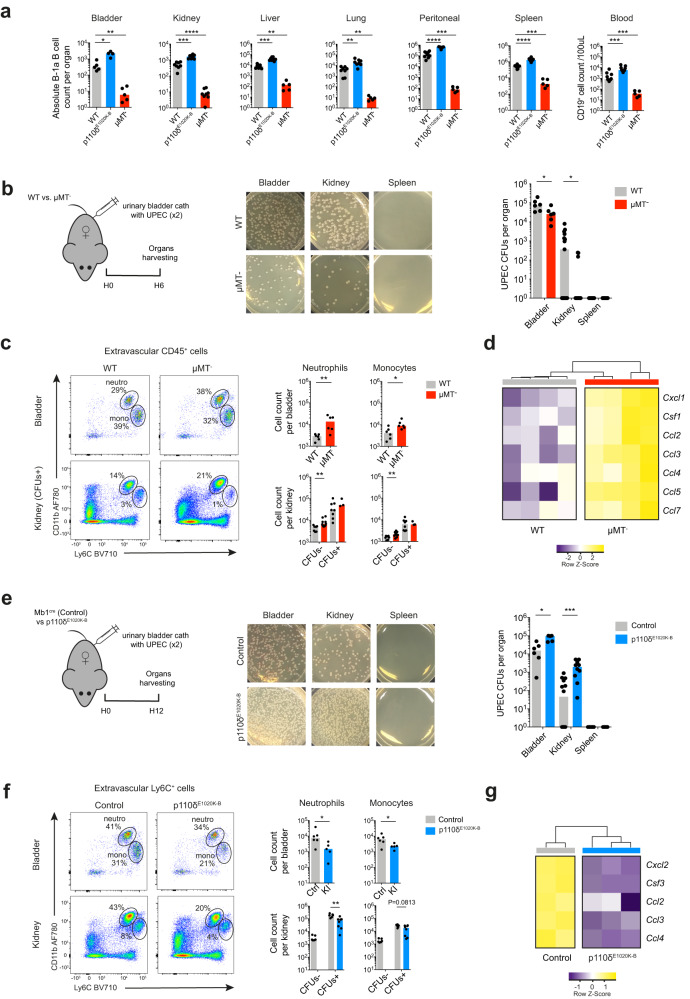
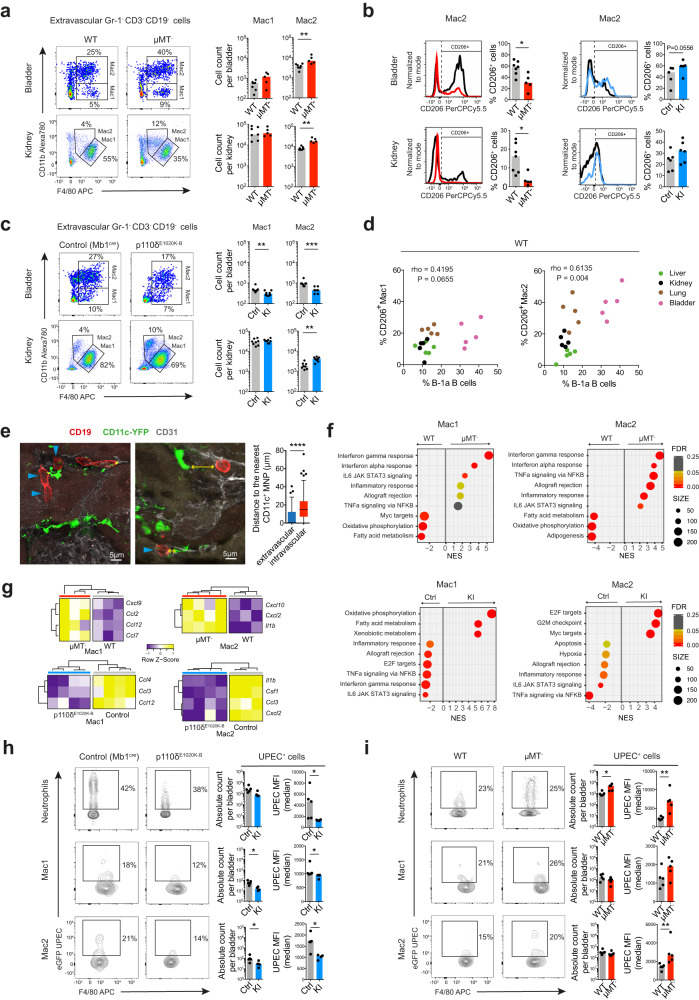
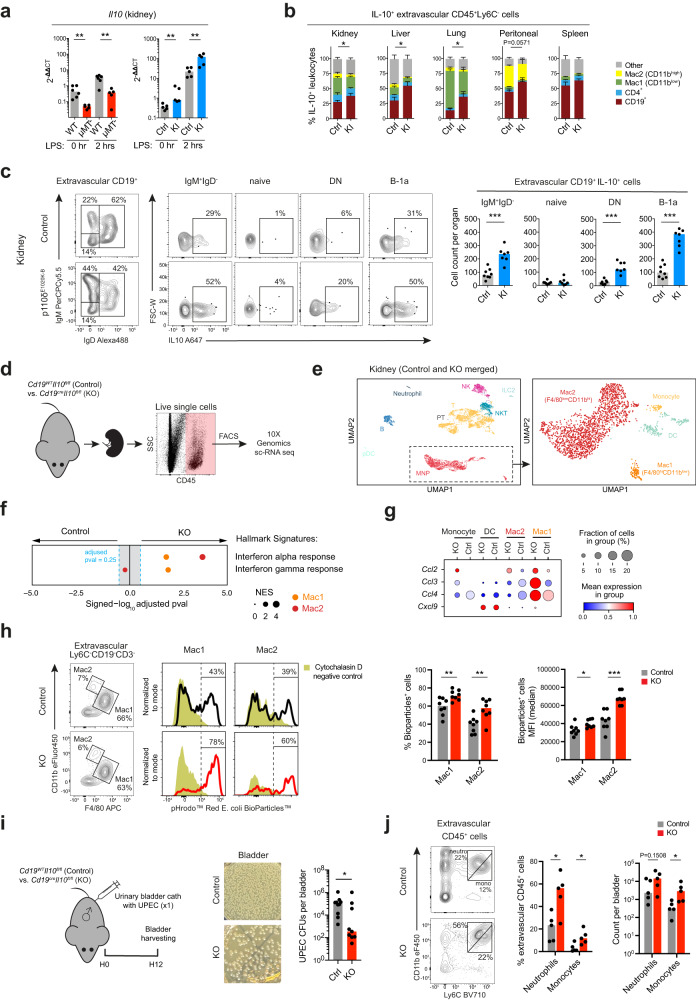
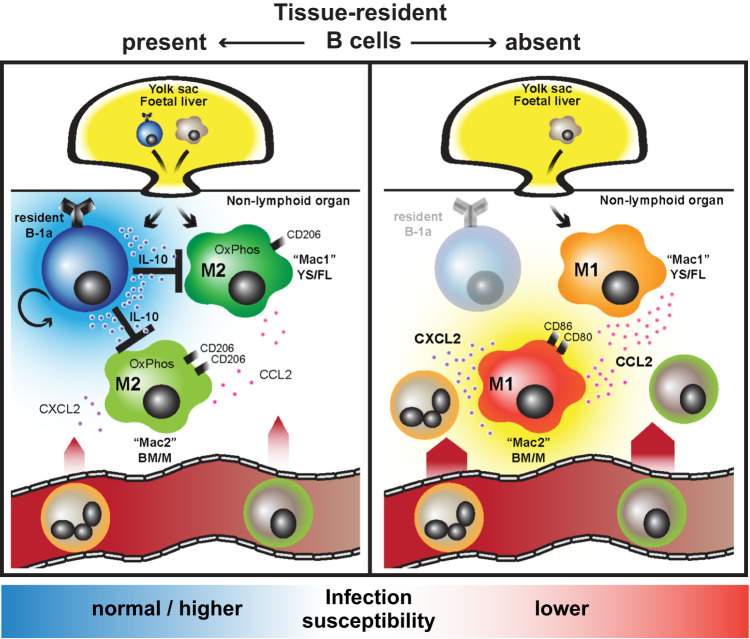
B cells play a central role in humoral immunity but also have antibody-independent functions. Studies to date have focused on B cells in blood and secondary lymphoid organs but whether B cells reside in non-lymphoid organs (NLO) in homeostasis is unknown. Here we identify, using intravenous labeling and parabiosis, a bona-fide tissue-resident B cell population in lung, liver, kidney and urinary bladder, a substantial proportion of which are B-1a cells. Tissue-resident B cells are present in neonatal tissues and also in germ-free mice NLOs, albeit in lower numbers than in specific pathogen-free mice and following co-housing with 'pet-store' mice. They spatially co-localise with macrophages and regulate their polarization and function, promoting an anti-inflammatory phenotype, in-part via interleukin-10 production, with effects on bacterial clearance during urinary tract infection. Thus, our data reveal a critical role for tissue-resident B cells in determining the homeostatic 'inflammatory set-point' of myeloid cells, with important consequences for tissue immunity.


Conflict of interest statement

The authors declare no competing interests.

Figures

Fig. 1
Fig. 1. Extravascular B cells present across murine organs in homeostasis.
a Flow-cytometry profiling of extra- and intravascular CD19+ cells in WT C57BL/6 mouse kidney, urinary bladder, liver, lung, spleen, peritoneal lavage and blood (kidneys n = 9, other organs n = 7). Data representative of three independent experiments. b Absolute extravascular B cell counts per gram of tissue across organs shown in a. xPeritoneal B cell counts calculated per single lavage and adjusted for total volume of PBS injected. c Percentage of B cells within live extravascular CD45+ cell subset across organs shown in a. Kidney *P = 0.0156, bladder *P = 0.0156, liver *P = 0.0312, lung *P = 0.0156. d Proportion of naïve (IgD+IgM+), IgM+IgD- and switched (double negative, DN) B cells from intra- (left) and extravascular (right) compartments in organs shown in a, n = 7 per group, means with SEM shown. The difference in naïve B cells proportions between blood and a tested organ is compared; intravascular: kidney P = 0.2188, bladder *P = 0.0156, liver P = 0.1562, lung P = 0.3750, peritoneal P = 0.6250, spleen P = 0.0781; extravascular: *P = 0.0156. e Flow-cytometry identification of CD45+CD3-CD19+ cells in matched kidney and spleen from deceased human organ donors (left) and their phenotyping based on expression of IgD and CD27 (middle). Percentage of naïve (IgD+CD27-), switched memory (IgD-CD27+), DN and double positive cells within CD45+CD3-CD19+ cell subset shown (right) (n = 10 per group, means with SEM shown). The difference in naïve B cells proportions between kidney and spleen is tested, *P = 0.0137. f Tukey plots show percentage of B-1a (CD19+CD23-CD5+) and CD9+ cells in extravascular IgD- B cell compartments of organs described in a. Data pooled from three independent experiments at two independent SPF animal facilities (total n = 12 per organ); %B-1: kidney ***P = 0.0010, bladder, liver and lung ***P = 0.0005; %CD9+ cells: kidney **P = 0.0024, bladder ***P = 0.0005, liver P = 0.4785, lung **P = 0.0029. g Confocal microscopy of adult (left) and neonatal (right) renal cortex from WT C57BL/6 mice focusing on extravascular localization of CD5+ B cells. Sections stained for CD19 (red), CD5 (green) and CD31 (grey). Representative of three independent experiments. Blue arrows point at extravascular CD19+CD5+ B cells. Blood samples represent always only intravascular cells. P values were calculated using two-tailed Wilcoxon matched-pairs signed rank test (c-f). Bar plots show medians unless stated otherwise. Source data are provided with this paper.
Fig. 2
Fig. 2. Bona-fide tissue-resident B cell compartments in non-lymphoid organs confirmed by parabiosis.
a Schematic showing parabiosis experimental setup (left): Congenically marked WT animals were connected for 5 weeks before organs harvesting. Flow cytometry (middle) and quantification (right) of peripheral blood CD19+ lymphocytes chimerism in each parabiont, (n = 6 per group). Data representative of two independent experiments. b Percentages of host-derived extravascular IgM+IgD-, DN, naïve and B-1a B cells found in kidney, liver, lung, female reproductive tract (FRT), spleen and blood from parabiosis experiment described in a. P values were calculated with two-tailed Wilcoxon matched-pairs signed rank test: *P = 0.0312, FRT & Fat (B-1a) P = 0.0625, spleen (B-1a) P = 0.1250, blood (IgM+IgD-) P = 0.8438, blood (B-1a) P = 0.9999. c Schematic showing B-cell depletion experimental setup (left): WT C57BL/6 mice were injected with anti-mouse CD20 depleting antibody or isotype control. On day 7, EdU was introduced into their drinking water for 21 days, after which organs (incl. blood) were harvested. Percentage of B cells in peripheral blood leukocytes from these mice was checked both on day 7 and 28 (right, n = 5 per group). Data representative of two independent experiments. d Absolute extravascular CD19+ cell counts found in kidney (controls n = 10, depleted n = 9, ****P < 0.0001), urinary bladder (n = 5, P = 0.5476), liver (n = 5, **P = 0.0079), lung (n = 5, P = 0.6905), peritoneal wash (n = 5, **P = 0.0079) and spleen (n = 5, **P = 0.0079) from depleted mice or controls on day 28 as described in c. P values were calculated with two-tailed Mann-Whitney U test. e Percentage of EdU positive cells in extravascular naïve, IgM+IgD-, DN and B-1a B cell compartment found in organs from circulating B-cell depleted mouse cohort as described in c. P values were calculated with paired two-tailed t test (data normality confirmed with Shapiro-Wilk test): Kidney (n = 8) ***P = 0.0003 (IgM+IgD-), ***P = 0.0002 (DN), ***P = 0.0004 (B-1a); bladder (n = 5) ***P = 0.0005 (IgM+IgD-), *P = 0.0313 (DN), ***P = 0.0010 (B-1a); liver (n = 5) *P = 0.0193 (IgM+IgD-), *P = 0.0119 (B-1a); lung (n = 5) ***P = 0.0006 (IgM+IgD-), ***P = 0.0004 (B-1a); peritoneal (n = 5) ***P = 0.0001 (IgM+IgD-), **P = 0.0060 (DN), ***P = 0.0006 (B-1a); spleen (n = 5) **P = 0.0047 (IgM+IgD-), **P = 0.0089 (DN), **P = 0.0055 (B-1a). Representative flow cytometry plots are shown in Supplementary Fig. 2d. All box plots show medians. Source data are provided with this paper.
Fig. 3
Fig. 3. Strain-specific and microbiome-dependent effects on tissue-resident B cells.
a Absolute extravascular CD19+ cell counts (top) and percentage of B-1a B cells within the extravascular B cells (bottom) found in organs from three commonly used WT laboratory mouse strains: C57BL/6, Balb/c and DBA. Data pooled from two independent experiments. Kidney (C57BL/6 n = 14, Balb/c n = 8, DBA n = 8): top **P = 0.0064, ****P < 0.0001, bottom ****P < 0.0001; bladder (C57BL/6 n = 7, Balb/c n = 8, DBA n = 4): top **P = 0.0061, bottom *P=0.0401; liver (C57BL/6 n = 7, Balb/c n = 7, DBA n = 4): top **P = 0.0061, bottom**P = 0.0041; lung (C57BL/6 n = 7, Balb/c n = 8, DBA n = 4): bottom *P = 0.0289; peritoneal (C57BL/6 n = 6, Balb/c n = 8, DBA n = 4): top *P = 0.0127, **P = 0.0095, bottom ***P = 0.0007, **P = 0.0095; spleen (C57BL/6 n = 7, Balb/c n = 7, DBA n = 4): top *P = 0.0242, bottom ***P = 0.0006, **P = 0.0061. b Absolute extravascular CD19+ cell counts (top) and B-1a cell percentage within extravascular B cell compartment (bottom) found in NLOs, spleen and peripheral blood from WT C57BL/6 mice maintained under different barrier status: Germ-free (kidney n = 6, other organs n = 3), specific-pathogen-free (SPF, kidneys n = 6, other organs n = 5) and specific-pathogen-free in an animal facility with a lower barrier status (SPF2, kidneys n = 6, other organs n = 5). Kidney: top *P = 0.0260, **P = 0.0022, bottom **P = 0.0022; bladder: top *P = 0.0357, **P = 0.0079, bottom P = 0.0556; liver: bottom *P = 0.0357, **P = 0.0079; lung: bottom *P = 0.0159. c Flow cytometry plots (left) and absolute counts (right) of live single extravascular CD8+ and CD19+ cells found in kidney and lung from SPF WT C57BL/6 mice co-housed with pet store mice (Co-housed) for 60 days and their non-cohoused matched controls (SPF), n = 5 per group, data representative of two independent experiments. Kidney: *P = 0.0317; lung: **P = 0.0079, *P = 0.0159. d Flow cytometry phenotyping and percentages of naïve (IgD+IgM+), DN and IgM+IgD- extravascular CD19+ cells from SPF and co-housed mice as described in c, n = 5 per group, means with SEM shown, *P = 0.0286. The statistical testing comparing the difference in naïve B cells proportions between SPF and co-housed animals. e Absolute extravascular B cell (left) and B-1a cell counts per gram of kidney (n = 10), urinary bladder (n = 5), liver (n = 5), lung (n = 5), peritoneal wash (n = 4) and spleen (n = 4) and 100 uL blood (n = 5) from 8- and 60-week old WT female C57BL/6 mice. Kidney: left ***P = 0.0004, right ****P < 0.0001; bladder & peritoneal: *P = 0.0317; spleen: *P = 0.0286. All P values were calculated with two-tailed Mann-Whitney U test. Box plots show medians unless stated otherwise. Source data are provided with this paper.
Fig. 4
Fig. 4. Tissue-resident B cell repertoire is less diverse and is expanded following bacterial challenge.
a BCR-seq experimental setup: WT C57BL/6 female mice had urinary bladders inoculated twice with UPEC (n = 5), or PBS (n = 6). After 56 days, their intra- and extravascular kidney B cells were sorted and BCR-sequenced. b, c Comparison of 20 most abundant VH-segment frequencies (b) and mean insert sizes (c) between matched extra- and intravascular kidney BCR compartments from control (PBS) animals, *P = 0.0312. d, l Donut plots showing proportion of ten most abundant Igh clonotypes (each clone coloured) found in matched extra- and intravascular kidney BCR compartments from control (PBS) (d) and infected (UPEC) mice (l). Normalized number of unique Igh clonotypes found in each sample is indicated in the centre of each donut. e Pair-wise BCR repertoire diversity comparison of extra- and intravascular kidney B cells from control (PBS) and infected (UPEC) mice based on normalized number of unique Igh clonotypes per sample, *P = 0.0312. f Heatmap showing log frequencies of “public” Igh clonotypes (complete CDR3, V- and J-segment nucleotide match), shared by extravascular B cells across control (PBS1-6) kidneys. Clonotypes CDR3 amino-acid sequence displayed. g Pair-wise comparison of percentage of “public” Igh clonotypes (defined in f) reads within extra- vs. intravascular kidney BCRs from control (PBS) animals, *P = 0.0312. h, k Representative BCR network plots capturing Igh immune repertoire of extra- and intravascular kidney B cells in control (PBS1) (h) and infected (UPEC1) (k) mouse. Each vertex represents a unique Igh sequence. Edges are generated between vertices that differ by a single nucleotide (non-indel). Clusters/vertices sharing the same CDR3 sequence and present both in extra- and intravascular repertoire are coloured. i Representative lineage tree of one Igh clone (No. 8) shared between extra- and intravascular kidney compartment (based on identical nucleotide CDR3 sequence) found in control mouse 1. The tree is rooted in the closest germ-line VH gene allele in the IMGT database (black dot). Each dot represents a unique Igh sequence. j Tukey box plots comparing total mutation frequency (including silent and replacement mutations) in VH-segments (downsampled to n = 1000 per group/isotype) between extra- and intravascular kidney B cells from control (PBS) mice. Ighm* represents only sequences with no Ighd counterpart (sharing CDR3 nucleotide sequence). **P < 0.01, ***P < 0.001, ****P < 0.0001 and ns P > 0.05. P values were calculated with two-tailed Wilcoxon matched-pairs signed ranked test (b, c, e, g, j) and two-tailed Mann-Whitney U test (e – comparison between extravascular compartments of PBS and UPEC groups). Source data are provided with this paper.
Fig. 5
Fig. 5. Tissue-resident B-1 cells contribute to bacterial defence in the renal tract.
a Flow cytometry quantification of absolute B-1a cells counts found in extravascular organ compartments and blood of WT C57BL/6, p110δE1020K-B and μMT- mice. Bladder (WT n = 5, p110δE1020K-B n = 4, μMT- n = 5): *P = 0.0159, **P = 0.0079; kidney (WT n = 8, p110δE1020K-B n = 8, μMT- n = 9): ***P = 0.0002, ****P < 0.0001; liver (WT n = 8, p110δE1020K-B n = 8, μMT- n = 5): **P = 0.0016, ***P = 0.0002; lung (WT n = 8, p110δE1020K-B n = 8, μMT- n = 5): p110δE1020K-B **P = 0.0019, μMT- **P = 0.0016; peritoneal (WT n = 9, p110δE1020K-B n = 8, μMT- n = 5): ***P = 0.0010, ****P < 0.0001; spleen (WT n = 10, p110δE1020K-B n = 8, μMT- n = 5): ***P = 0.0007, ****P < 0.0001; blood (WT n = 10, p110δE1020K-B n = 9, μMT- n = 5): p110δE1020K-B ***P = 0.0004, μMT- ***P = 0.0007. Data pooled from two independent experiments. b, e Schematic experimental setup (left) for short UTI experiments: μMT- female mice and their matched WT controls (b), or p110δE1020K-B female mice and their matched (Mb1cre) controls (e) had urinary bladders inoculated twice (within 45 mins) with UPEC. Their organs were harvested after 6 or 12 hours, respectively. Representative LB agar plates photographs (middle) and UPEC colony forming units (CFU) counts (right) recovered from urinary bladder, kidney and spleen single cell suspensions are shown. A pseudo-count of 1 was added to all CFUs counts. Top (b): Bladder (n = 6) *P = 0.0316; kidney (WT n = 15, μMT- n = 13) *P = 0.0260; spleen (WT n = 8, μMT- n = 7). Bottom (e): Bladder (Ctrl n = 6, KI n = 5) *P = 0.0108; kidney (Ctrl n = 14, KI n = 10) ***P = 0.0002; spleen (Ctrl n = 7, KI n = 5). c, f Flow cytometry quantification of absolute extravascular neutrophils (Ly6CintCD11bhi) and monocytes (Ly6ChiCD11bint) counts in urinary bladders and kidneys from μMT- mice and their WT controls (c), or p110δE1020K-B mice and their controls (f) based on experiments described in b and e, respectively. Top (c): Bladder **P = 0.0087, *P = 0.0260; kidney neutrophils **P = 0.0020, kidney monocytes **P = 0.0068. Bottom (f): Bladder neutrophils *P = 0.0303, monocytes *P = 0.0455; kidney **P = 0.0027. d, g Heatmap with hierarchical clustering showing selected significant (Padj <0.05) differentially expressed neutrophil- and monocyte-recruiting chemokines genes in kidneys from μMT- mice and their WT controls (d), or p110δE1020K-B mice and their controls (g) based on experiments described in b and e, respectively. Data generated from RNA sequencing of whole kidneys positive for UPEC CFUs. UTI experiment data representative of three independent experiments. P values were calculated with two-tailed Mann-Whitney U test and DESeq2 based Wald test with adjustment for multiple testing (d, g), box plots show medians. Source data are provided with this paper.
Fig. 6
Fig. 6. Tissue-resident B cells orchestrate macrophage polarisation in the renal tract.
a, c Representative flow cytometry plots with gating Ly6C-F4/80hiCD11blow (Mac1) and Ly6C-F4/80lowCD11bhi (Mac2) MNPs in the extravascular compartment of urinary bladders (top) and kidneys (bottom) at steady state from μMT- mice (n = 5) and their matched WT controls (n = 7) (a), or p110δE1020K-B mice (n = 8) and their Mb1cre controls (n = 8) (c), respectively. Bar charts show absolute counts of these MNPs subsets per organ. Data representative of three independent experiments. μMT- mice: Bladder **P = 0.0051; kidney **P = 0.0051; p110δE1020K-B mice: Bladder **P = 0.0044, ***P = 0.0002; kidney **P = 0.0011. b Representative histograms showing CD206 MFI of Mac2 analyzed in a and c. Bar charts quantify percentage of CD206+ cells within each subset. μMT- (n = 5)/WT (n = 7) mice *P = 0.0177; p110δE1020K-B/control mice: bladders (n = 5 per group), kidneys (n = 6 per group), *P = 0.0044, ***P = 0.0002. d Correlation between the percentage of B-1a B cells (within extravascular B cells) and the percentage of CD206+ cells within Mac1 (left) or Mac2 (right) subsets, respectively, found in WT C57BL/6 mouse liver, kidney, lung and urinary bladder (n = 5 per organ). e Confocal microscopy of B cells (CD19, red), MNPs (CD11c, green) and endothelium (CD31, grey) in renal cortex from 10-week old CD11c-YFP reporter mice at steady state. Tukey box plot compares the median distance (yellow arrow) of extra- versus intravascular B cells to the nearest CD11c+ MNP, n = 100 cells per group, ****P < 0.0001. f Hallmark GSEA on pre-ranked genes differentially expressed in sorted extravascular Mac1 (F4/80hiCD11blow, left plots) and Mac2 (F4/80lowCD11bhi, right plots) subsets, respectively, from kidney single-cell suspensions stimulated with LPS for 2 hrs and obtained from either μMT- (n = 4, upper plots), or p110δE1020K-B (n = 4, lower plots) mice, respectively, and their matched controls (WT n = 3, Mb1cre controls n = 3). Top six positively and top three negatively enriched Hallmark gene sets shown. NES–normalized enrichment score, FDR–false discovery rate. g Heatmap showing significant (Padj < 0.05) neutrophil- and monocyte-recruiting chemokines genes differentially expressed in the same μMT- (upper plots), or p110δE1020K-B (lower plots) mouse kidney macrophages datasets as described in f. h, i Flow cytometry evaluation of in-vivo eGFP UPEC phagocytosis by extravascular neutrophils, Mac1 and Mac2 in p110δE1020K-B (KI, n = 4) (h) and μMT- (n = 5) (i) urinary bladders, respectively, and their controls (Mb1cre controls n = 5, WT n = 5), 6 hours after inoculation. Bar charts show absolute counts of eGFP UPEC+ cells per urinary bladder (left) and their median eGFP MFI (right). Data representative of two independent experiments. Detailed gating strategy shown in Supplementary Fig. 6f, g. μMT- mice: Mac2 *P = 0.0317, others *P = 0.0159; p110δE1020K-B mice: *P = 0.0317, **P = 0.0079. P values were calculated with two-tailed Mann-Whitney U test (ac, e, h, i), two-tailed Spearman correlation (d) or DESeq2 based Wald test with adjustment for multiple testing (f, g). Box plots show medians shown unless stated otherwise. Source data are provided with this paper.
Fig. 7
Fig. 7. Tissue-resident B cells in non-lymphoid organs are an important source of IL10 regulating local tissue immunity.
a Il10 mRNA expression by quantitative PCR in whole kidney single-cell suspensions from μMT- (left) or p110δE1020K-B (right) mice (n = 5 per group), respectively, and their matched controls (WT n = 6, Mb1cre control n = 5) at baseline and after 2-hr stimulation with LPS. μMT- kidneys: 0-hr **P = 0.0043, 2-hr **P = 0.0087; p110δE1020K-B kidneys **P = 0.0079. b Proportion of five cell subsets (CD19+, CD4+, Mac1, Mac2 and other) within IL10-producing extravascular CD45+Ly6C- leukocytes from Mb1cre (control, Ctrl, n = 6) and p110δE1020K-B (KI, n = 6) mouse organs. The statistical testing compares the difference in CD19+ cell proportions. Kidney *P = 0.0325; liver & lung *P = 0.0206; peritoneal P = 0.0571. Data pooled from two independent experiments. c Flow cytometry quantification of IL10 expression in extravascular kidney B cell subsets (IgM+IgD-, naïve, DN, B-1a) from Mb1cre (control, Ctrl, n = 8) and p110δE1020K-B (KI, n = 7) mice. Bar charts show absolute cell counts IL10+ B cells within each subset. Data representative of three independent experiments. IgM+IgD-***P = 0.0006; DN ***P = 0.0006; B-1a ***P = 0.0003. d Schematic for the scRNA-seq experiment setup: Live CD45+ cells were FACS-sorted from single-cell suspensions of unchallenged kidneys from Cd19creIl10fl/fl (KO) mice and their (Cd19cre) controls (Ctrl) (n = 5 per group), and subjected to scRNA sequencing (10X). e UMAP plots show all sorted cells (left, n = 6538) and MNPs-only (right, n = 1894) coloured according to major cell type annotations. f GSEA for Hallmark ‘interferon alpha’ and ‘interferon gamma’ response based on pre-ranked genes differentially expressed in Mac1 (F4/80hiCD11blow) or Mac2 (F4/80lowCD11bhi), respectively, obtained from control or KO kidneys described in d. NES – normalized enrichment score. g Mean expression dot plot of monocyte-recruiting chemokine genes in MNPs showed in e, split by experimental group. h In-vitro phagocytosis of pHrodo™ Red E. coli BioParticles™ by both macrophage subsets from control (Cd19WTIl10fl/fl) and KO (Cd19creIl10fl/fl) kidneys (n = 8 per group). Representative flow cytometry plots show gating of extravascular Ly6C-F4/80hiCD11blow (Mac1) and Ly6C-F4/80lowCD11bhi (Mac2) MNPs (left). Representative histograms (normalized to mode) display E. coli bioparticles MFI and gating of bioparticles+ Macs (right). Dark yellow histograms represent cytochalasin D treated negative controls. Bar charts show percentage of bioparticles+ cells (left) and their median MFI (right). %Bioparticles+ cells: Mac1 **P = 0.0043, Mac2 **P = 0.0070; MFI: Mac1 *P = 0.0148, Mac2 *P = 0.0002. Data combined from two independent experiments. i Schematic for the UTI experiment setup (left): Urinary bladders of Cd19cre+/-Il10f/fl (KO, n = 9) male mice and their matched controls (n = 10) were inoculated once with UPEC and harvested after 12 hours. Representative LB agar plates photographs (middle) and UPEC CFU counts (right) recovered from urinary bladders shown. Data combined from two independent experiments, *P = 0.0220. j Representative flow cytometry plots and quantification of extravascular neutrophils (Ly6CintCD11bhi) and monocytes (Ly6ChiCD11bint) in urinary bladders treated as described in i. Data representative of three independent experiments, *P = 0.0317. P values were calculated with one-tailed (b) and two-tailed (a, c, h, i, j) Mann-Whitney U test. Medians shown unless stated otherwise. Source data are provided with this paper.
Fig. 8
Fig. 8. Graphical abstract - Tissue-resident B cells orchestrate macrophage polarisation and function.
Homeostatic seeding of B-1 cells is not limited to body cavities and the spleen, but extends to major non-lymphoid organs, in an analogous way to macrophages. These two cell types reside side by side in tissue niches, enabling B cells to shape macrophage polarisation, at least in part, via IL10 secretion and to set their ‘inflammatory set-point’, with important consequences for tissue immunity and defence.

References

    1. Aw Yeang, H. X. et al. Cutting edge: Human CD49e- NK cells are tissue resident in the liver. J. Immunol. 10.4049/jimmunol.1601818 (2017). - PMC - PubMed
    1. Schenkel JM, et al. T cell memory. Resident memory CD8 T cells trigger protective innate and adaptive immune responses. Science. 2014;346:98–101. doi: 10.1126/science.1254536. - DOI - PMC - PubMed
    1. Hashimoto D, et al. Tissue-resident macrophages self-maintain locally throughout adult life with minimal contribution from circulating monocytes. Immunity. 2013;38:792–804. doi: 10.1016/j.immuni.2013.04.004. - DOI - PMC - PubMed
    1. Schenkel JM, Masopust D. Identification of a resident T-cell memory core transcriptional signature. Immunol. Cell Biol. 2014;92:8–9. doi: 10.1038/icb.2013.67. - DOI - PubMed
    1. Cheuk S, et al. Epidermal Th22 and Tc17 cells form a localized disease memory in clinically healed psoriasis. J. Immunol. 2014;192:3111–3120. doi: 10.4049/jimmunol.1302313. - DOI - PMC - PubMed

Publication types