. 2023 Nov 4;18(1):831.
doi: 10.1186/s13018-023-04200-x.

Molecular mechanisms of AMPK/YAP/NLRP3 signaling pathway affecting the occurrence and development of ankylosing spondylitis

Affiliations

Molecular mechanisms of AMPK/YAP/NLRP3 signaling pathway affecting the occurrence and development of ankylosing spondylitis

Ruiyang Fu et al. J Orthop Surg Res. .

Abstract

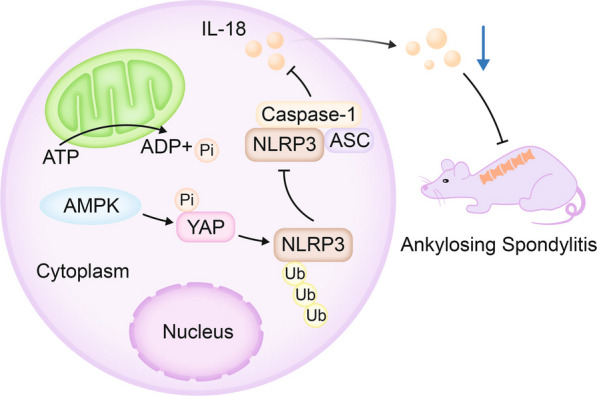
Background: Investigate the AMPK (protein kinase AMP-activated catalytic subunit alpha 1)/YAP (Yes1 associated transcriptional regulator)/NLRP3 (NLR family pyrin domain containing 3) signaling pathway's role in ankylosing spondylitis (AS) development using public database analysis, in vitro and in vivo experiments.

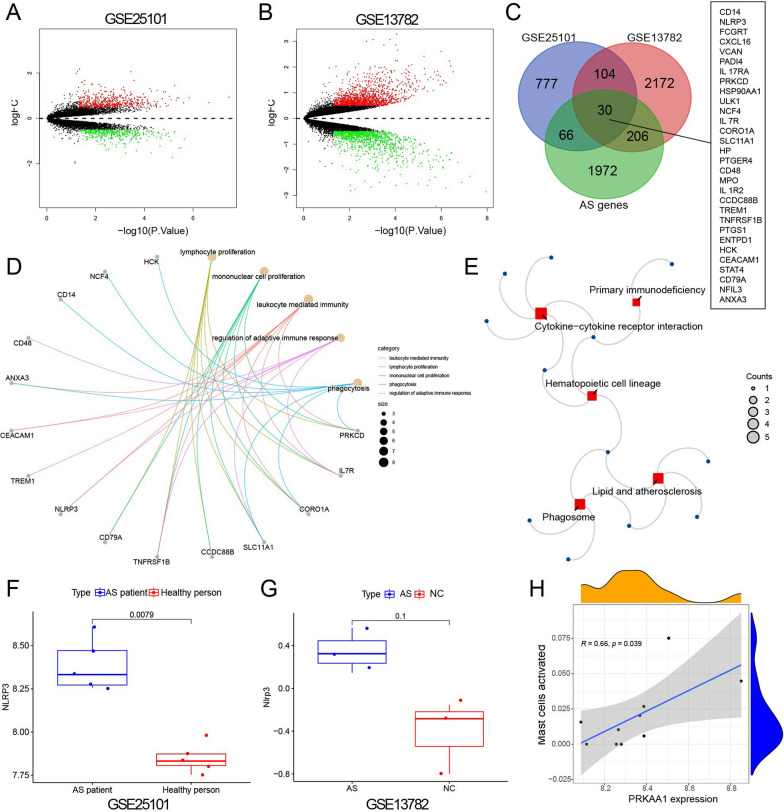
Methods: Retrieve AS dataset, analyze differential gene expression in R, conduct functional enrichment analysis, collect 30 AS patient and 30 normal control samples, and construct a mouse model. ELISA, IP, and knockdown experiments were performed to detect expression changes.

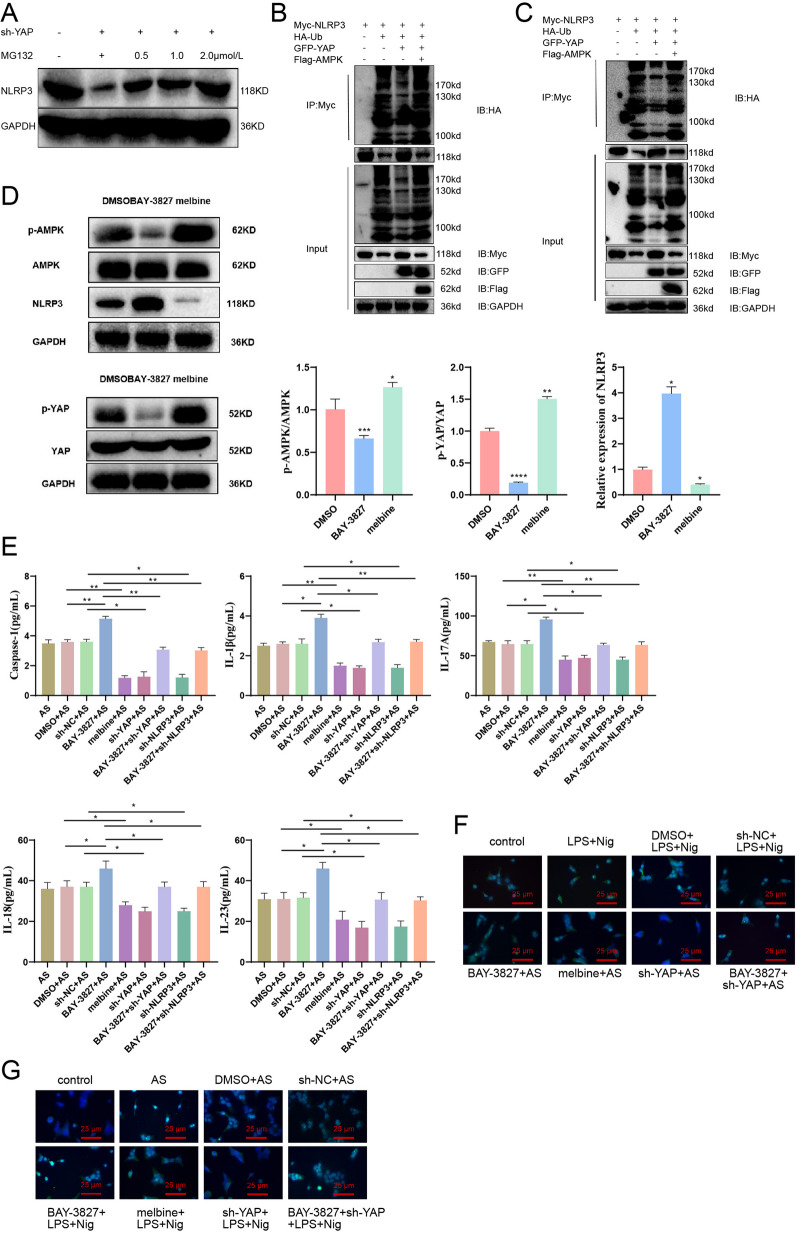
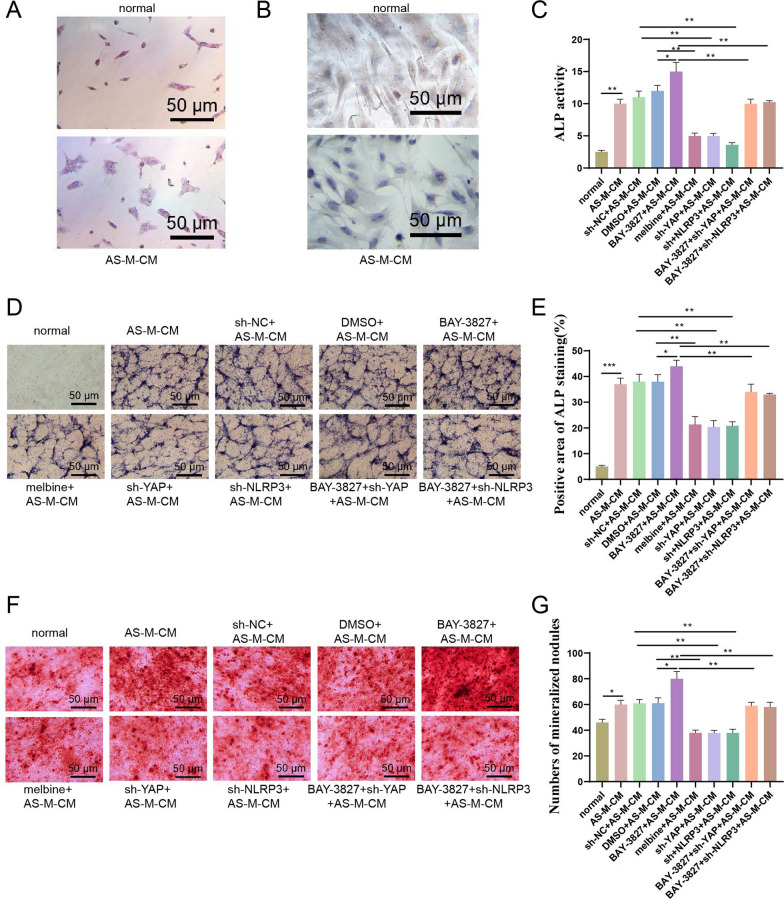
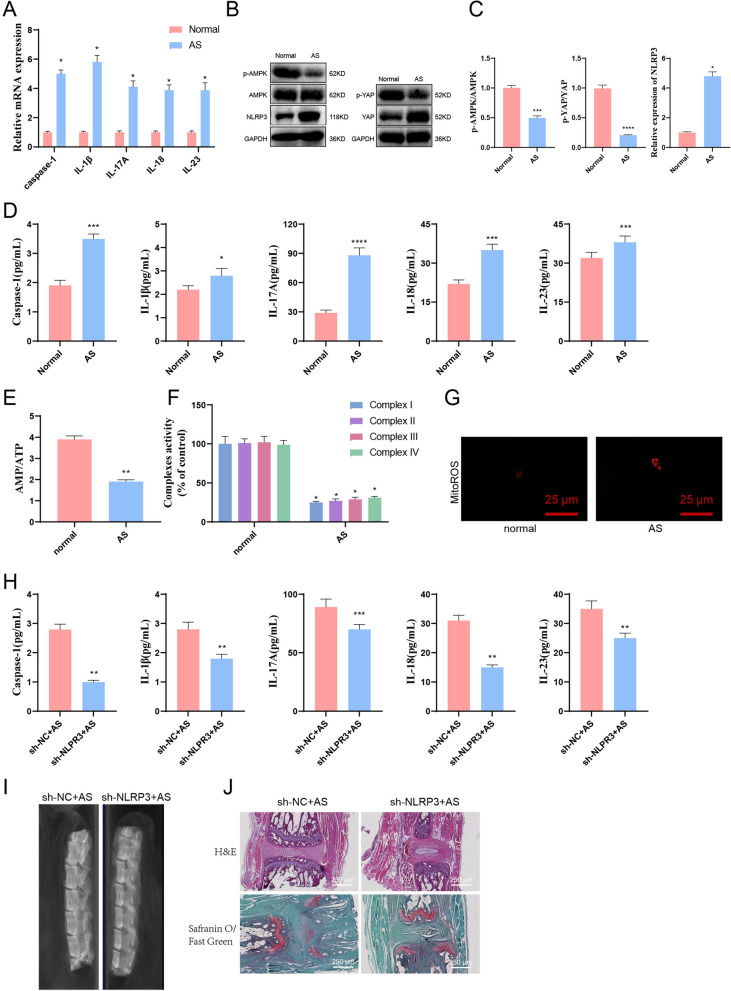
Results: NLRP3 was identified as a significant AS-related gene. Caspase-1, IL-1β, IL-17A, IL-18, IL-23, YAP, and NLRP3 were upregulated in AS patients. Overexpressing AMPK inhibited YAP's blockade on NLRP3 ubiquitination, reducing ossification in fibroblasts. Inhibiting AMPK exacerbated AS symptoms in AS mice.

Conclusion: AMPK may suppress YAP expression, leading to NLRP3 inflammasome inhibition and AS alleviation.

Keywords: AMPK; Ankylosing spondylitis; NLRP3; Phosphorylation activation; Ubiquitination degradation; YAP.


Conflict of interest statement

The authors declare that they have no competing interests.

Figures

Fig. 1
Fig. 1
Bioinformatics analysis suggests the involvement of the AMPK/YAP/NLRP3 signaling pathway in the occurrence and development of ankylosing spondylitis (AS). Note A Volcano plot of differentially expressed genes in GSE25101 dataset (AS patient group: n = 5; Healthy person group: n = 5), with red dots representing significantly upregulated genes, green dots representing significantly downregulated genes, and black dots representing genes with no significant difference. B Volcano plot of differentially expressed genes in the GSE13782 dataset (AS group: n = 3; NC group: n = 3), with red dots representing significantly upregulated genes, green dots representing significantly downregulated genes, and black dots representing genes with no significant difference. C Venn diagram of the intersection of differentially expressed genes in GSE25101, GSE13782 datasets, and AS-related genes. D—KEGG E Functional enrichment analysis of 30 differentially expressed genes. F Box plot of NLRP3 differential expression in GSE25101 dataset (AS patient group: n = 5; Healthy person group: n = 5). G Box plot of NLRP3 differential expression in GSE13782 dataset (AS group: n = 3; NC group: n = 3). H Correlation analysis of AMPK (PRKAA1) with Mast cells
Fig. 2
Fig. 2
Differential expression of AMPK, YAP, and NLRP3 in peripheral blood of AS patients and healthy controls. Note A RT-qPCR was performed to detect the mRNA expression levels of caspase-1, IL-1β, IL-17A, IL-18, and IL-23 in peripheral blood of AS patients and healthy individuals; B ELISA was conducted to measure the levels of inflammatory factors caspase-1, IL-1β, IL-17A, IL-18, and IL-23 in the peripheral blood serum of AS patients and healthy individuals; C Western blot analysis was employed to assess the protein expression levels of AMPK, YAP, and NLRP3 in PBMCs from AS patients and healthy individuals; D The AMP/ATP ratio was determined in PBMCs from AS patients and healthy individuals; E The activities of mitochondrial complexes I-IV in PBMCs from AS patients and healthy individuals were measured; F Mitochondrial ROS in PBMCs from AS patients and healthy individuals were observed under a laser confocal microscope, with Bar = 10 μm. Numerical values are presented as mean ± standard deviation. All cell experiments were performed in triplicate. *indicates P < 0.05 and ***, ****indicates P < 0.001 and P < 0.0001, respectively, for comparing the two groups (Healthy donors = 30, AS = 30)
Fig. 3
Fig. 3
The impact of AMPK on NLRP3 K27 ubiquitination and inflammasome activation regulated by YAP. Note A Ubiquitinated immunoprecipitation was performed to detect the ubiquitination bands of NLRP3; B Ubiquitinated immunoprecipitation was conducted to examine the ubiquitination bands of NLRP3; C Ubiquitinated immunoprecipitation was employed to assess the ubiquitination bands of NLRP3; D Western blot analysis was used to measure the expression levels of AMPK, YAP, and NLRP3 in monocytes; E ELISA was performed to measure the levels of caspase-1, IL-1β, IL-17A, IL-18, and IL-23 in peripheral blood monocytes; F, G Formation of ASC specks in monocytes from healthy individuals (F) and AS patients G was observed through fluorescence microscopy. ASC: green, nucleus: blue, white arrows indicate ASC specks, Bar = 10 μm. Values are presented as mean ± standard deviation. All cell experiments were repeated three times. *Indicates P < 0.05 for comparison between two groups, **Indicates P < 0.01, and ***Indicates P < 0.001
Fig. 4
Fig. 4
Effects of AMPK/YAP/NLRP3 signaling pathway on osteogenesis of fibroblasts. Note A, B A H&E staining and B Vimentin immunohistochemistry staining of normal fibroblasts and AS fibroblasts; Bar = 200 μm; C Detection of ALP activity in fibroblasts, normal for femoral neck fracture fibroblasts; D ALP staining, Bar = 200 μm; E Statistical chart of the percentage of ALP-positive cells in Figure D; F Safranin O staining, Bar = 200 μm; G Number of mineralized nodules formed in the statistical chart of Figure F. Values are presented as mean ± standard deviation. All cell experiments were repeated three times. *Indicates P < 0.05, **Indicates P < 0.01, and ***Indicates P < 0.001
Fig. 5
Fig. 5
The effect of knocking down NLRP3 on AS mice. Note A Use RT-qPCR to detect the mRNA expression levels of caspase-1, IL-1β, IL-17A, IL-18, and IL-23 in the peripheral blood of AS mice and normal mice. Normal mice (normal) were used as controls, and GAPDH was used as the internal reference. B Use Western blot to detect the protein expression levels of AMPK, YAP, and NLRP3 in the peripheral blood of AS and normal mice. Normal mice (normal) were used as controls, and GAPDH was used as the internal reference. C The statistical analysis chart of B. Normal mice (normal) was used as control, and GAPDH was used as the internal reference. D ELISA was used to detect the levels of inflammatory factors caspase-1, IL-1β, IL-17A, IL-18, and IL-23 in the serum of AS and normal mice. Normal mice (normal) were used as controls. E Detect the ratio of AMP/ATP in peripheral blood mononuclear cells of mice. F The activity of mitochondrial complexes I-IV. G Observe mitochondrial ROS under laser confocal microscopy, Bar = 10 μm. H Inject sh-NLRP3 and sh-NC into the tail vein of AS mice, respectively, and detect the levels of inflammatory factors caspase-1, IL-1β, IL-17A, IL-18, and IL-23 by ELISA. The sh-NC was used as a control. I The cervical dislocation was used to euthanize mice, and the spine was dissected and cleaned for CT examination of bone changes in the spine. The arrow indicates the intervertebral disc space. J Stained the tissue near the intervertebral disc of mice with H&E and Safranin-O Fast Green stains (40 × , bar = 25 μm). Numerical values are presented as mean ± standard deviation; each group contains 6 mice, with *indicating P < 0.05, **indicating P < 0.01, and ***indicating P < 0.001 for comparisons between two groups
Fig. 6
Fig. 6
Mechanisms of the role of the AMPK/YAP/NLRP3 signaling pathway in the occurrence and development of AS validated by in vivo animal experiments. Note A BAY-3827 and metformin (timeline) were injected into the AS mouse joint separately, and RT-qPCR was used to detect the mRNA expression levels of caspase-1, IL-1β, IL-17A, IL-18, and IL-23 in mouse joint tissues. Sh-NC was used as a control, and GAPDH was used as an internal reference. B Western blot was used to detect the mRNA expression levels of YAP, p-YAP, and NLRP3 in mouse joint tissues. Sh-NC was used as a control. C Fluorescence microscopy was used to observe the formation of ASC specks. ASC: green, cell nucleus: blue, white arrows indicate ASC specks, bar = 10 μm. D BAY-3827, metformin (timeline), sh-YAP, and sh-NLRP3 were injected into the AS mouse joint separately, and ELISA was used to detect the inflammation factors caspase-1, IL-1β, IL-17A, IL-18, and IL-23. E The cervical dislocation was used to kill the mice, and the spine was removed, cleaned, and examined by CT for bone changes in the spine. The arrow points to the intervertebral disc space. F H&E staining and Safranin O-fast green staining were used to stain mice's tissues near the intervertebral disc (400 × , bar = 25 μm). The values are expressed as mean ± standard deviation. Each group includes 6 mice. *Indicates P < 0.05 for the comparison between two groups, **indicates P < 0.01, and ***indicates P < 0.001
Fig. 7
Fig. 7
Schematic diagram of the molecular mechanisms by which the AMPK/YAP/NLRP3 signaling pathway affects the occurrence and development of ankylosing spondylitis

References

    1. Mauro D, Thomas R, Guggino G, Lories R, Brown MA, Ciccia F. Ankylosing spondylitis: an autoimmune or autoinflammatory disease? Nat Rev Rheumatol. 2021;17:387–404. doi: 10.1038/s41584-021-00625-y. - DOI - PubMed
    1. Song IH, Hermann K, Haibel H, Althoff CE, Listing J, Burmester G, et al. Effects of etanercept versus sulfasalazine in early axial spondyloarthritis on active inflammatory lesions as detected by whole-body MRI (ESTHER): a 48-week randomised controlled trial. Ann Rheum Dis. 2011;70:590–596. doi: 10.1136/ard.2010.139667. - DOI - PMC - PubMed
    1. Baraliakos X, Haibel H, Listing J, Sieper J, Braun J. Continuous long-term anti-TNF therapy does not lead to an increase in the rate of new bone formation over 8 years in patients with ankylosing spondylitis. Ann Rheum Dis. 2014;73:710–715. doi: 10.1136/annrheumdis-2012-202698. - DOI - PubMed
    1. van der Heijde D, Landewe R, Baraliakos X, Houben H, van Tubergen A, Williamson P, et al. Radiographic findings following two years of infliximab therapy in patients with ankylosing spondylitis. Arthritis Rheum. 2008;58:3063–3070. doi: 10.1002/art.23901. - DOI - PubMed
    1. Voruganti A, Bowness P. New developments in our understanding of ankylosing spondylitis pathogenesis. Immunology. 2020;161:94–102. doi: 10.1111/imm.13242. - DOI - PMC - PubMed

MeSH terms

Substances