. 2023 Nov 4;14(1):7095.
doi: 10.1038/s41467-023-42751-z.

Spatial transcriptomics reveals unique gene expression changes in different brain regions after sleep deprivation

Affiliations

Spatial transcriptomics reveals unique gene expression changes in different brain regions after sleep deprivation

Yann Vanrobaeys et al. Nat Commun. .

Abstract

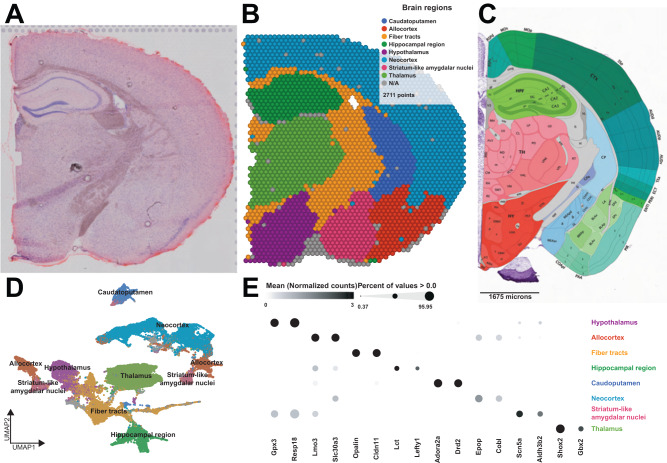
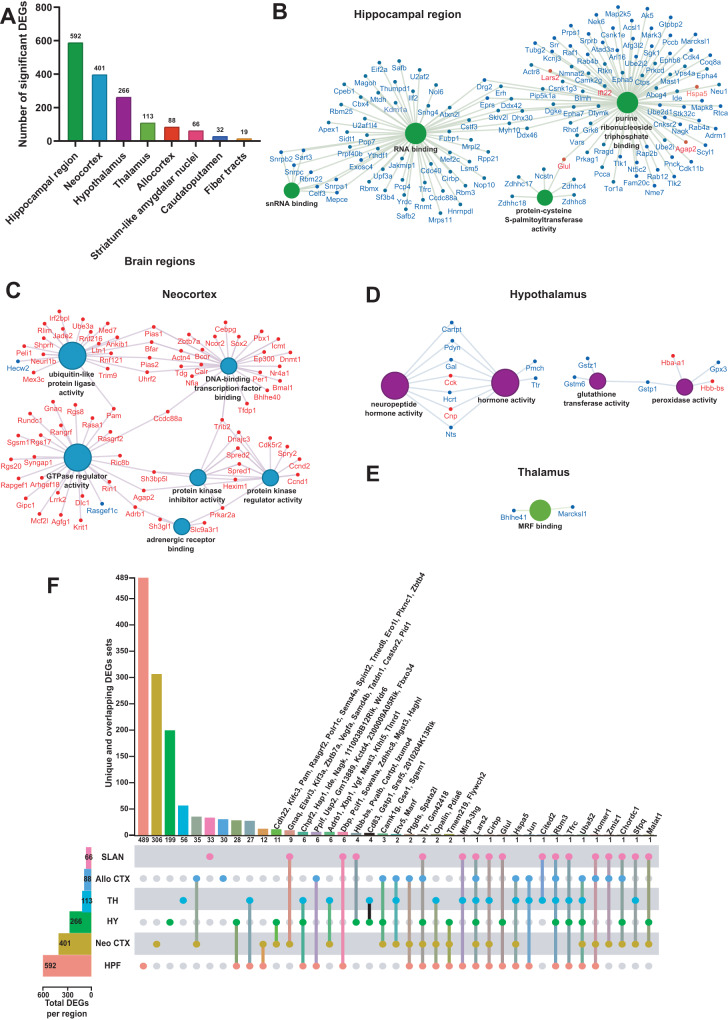
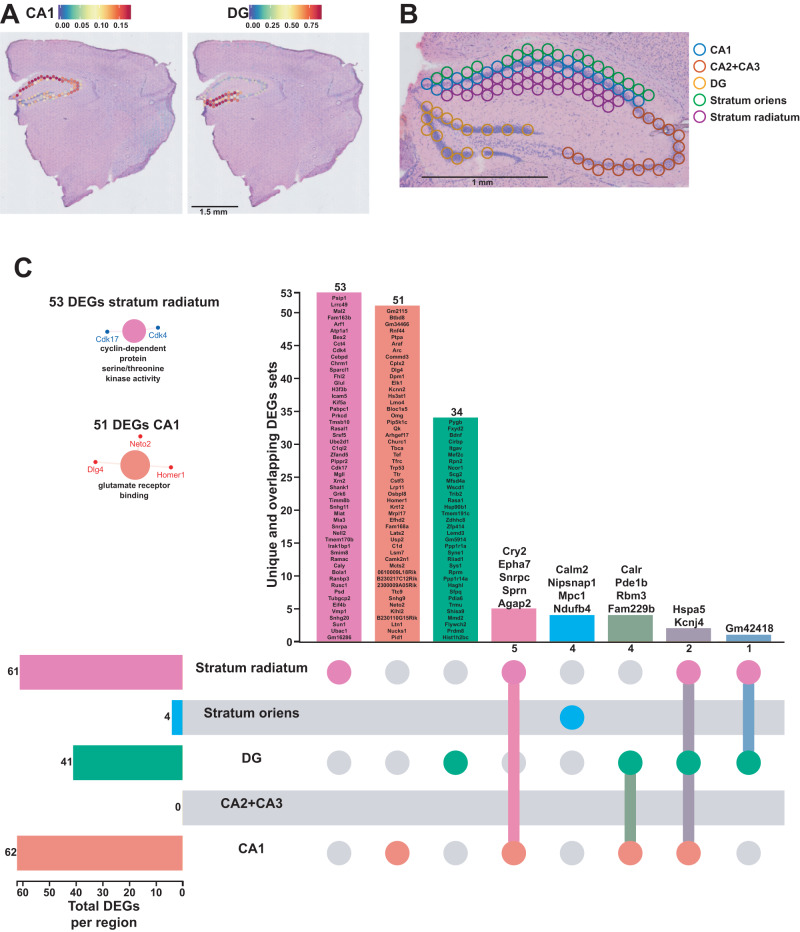
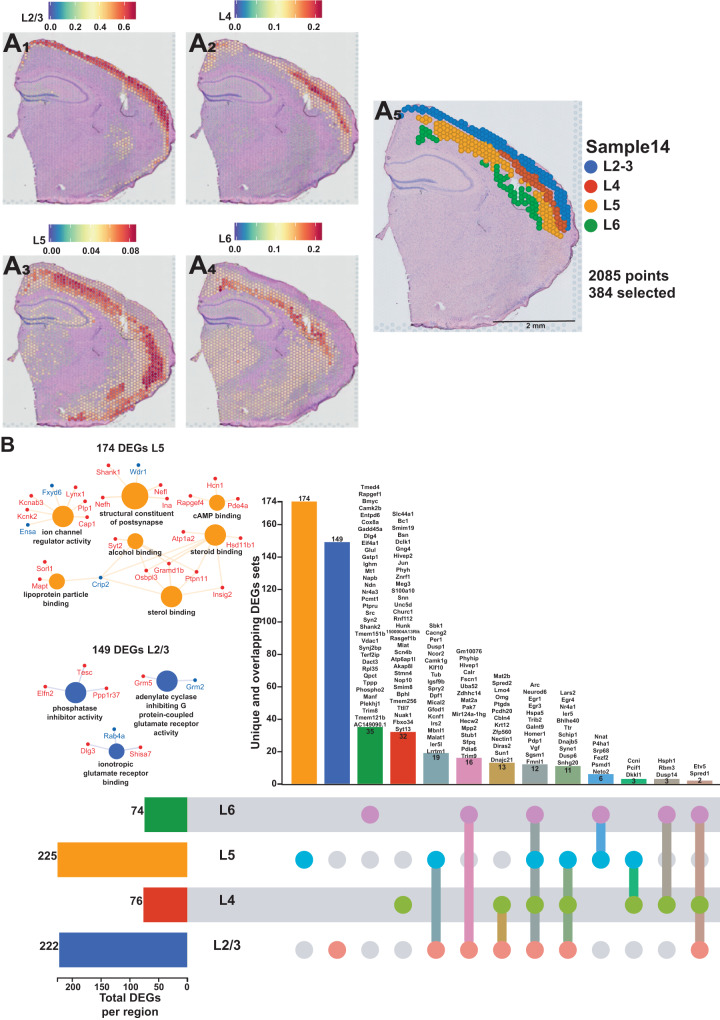
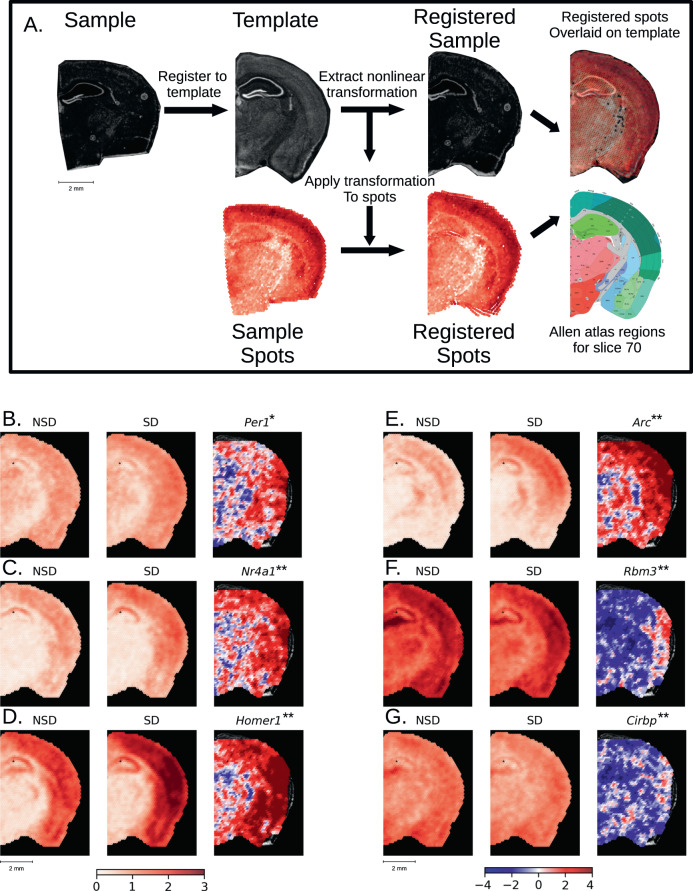
Sleep deprivation has far-reaching consequences on the brain and behavior, impacting memory, attention, and metabolism. Previous research has focused on gene expression changes in individual brain regions, such as the hippocampus or cortex. Therefore, it is unclear how uniformly or heterogeneously sleep loss affects the brain. Here, we use spatial transcriptomics to define the impact of a brief period of sleep deprivation across the brain in male mice. We find that sleep deprivation induced pronounced differences in gene expression across the brain, with the greatest changes in the hippocampus, neocortex, hypothalamus, and thalamus. Both the differentially expressed genes and the direction of regulation differed markedly across regions. Importantly, we developed bioinformatic tools to register tissue sections and gene expression data into a common anatomical space, allowing a brain-wide comparison of gene expression patterns between samples. Our results suggest that distinct molecular mechanisms acting in discrete brain regions underlie the biological effects of sleep deprivation.


Conflict of interest statement

T.A. serves on the Scientific Advisory Board of EmbarkNeuro and is a scientific advisor to Aditum Bio and Radius Health. The other authors declare no conflicting interests.

Figures

Fig. 1
Fig. 1. Spatial patterns of gene expression define anatomically distinct brain regions.
A Example of coronal tissue section H&E histology staining from sample 4. This process was repeated for each of the 16 mice. B Graph-based cluster identification from spot-level (2711 spots) of sample 4. Each spot is colored based on the transcriptional signature computed from 20 principal components using Louvain clustering algorithm. The brain regions are labeled in the colored legend. This process was repeated for each of the 16 mice. C Adapted screenshot of the Allen Reference Atlas—Mouse Brain (coronal section image 72 of 132, position 285, http://atlas.brain-map.org/). D UMAP plot based on the transcriptional signature of each spot. E Bubble plot of the most significant computed biomarkers for each brain region. The bubble chart shows the expression level of biomarkers in each brain region. Bubble diameters are proportional to the percentage of spots that show expression of the biomarker. For each brain region, two significant biomarkers are displayed.
Fig. 2
Fig. 2. The hippocampal region is the brain region the most transcriptionally affected after sleep deprivation.
A Histogram representing the number of significant differentially expressed genes (DEGs) across each brain region previously identified. Molecular functions enriched from the significant DEGs in the hippocampal region (B), neocortex (C), hypothalamus (D), thalamus (E). A gene is significant if its FDR step-up <0.001 and its log2fold-change ≥ |0.2 | . The size of the circle for each enriched molecular function is proportional to the significance. Only molecular functions with a corrected p < 0.05 are displayed (two-sided hypergeometric test, Bonferroni step down). The DEGs within these molecular functions are color coded to show whether they are downregulated (blue) or upregulated (red). F UpSet plot of interactions between each brain region that have more than 50 significant DEGs (fiber tracts and caudatoputamen excluded). The number of DEGs submitted for each brain region is represented by the histogram on the left (0–600 range). Dots alone indicate no overlap with any other lists. Dots with connecting lines indicate one or more overlap of DEGs between brain regions. The number of DEGs in a specific list that overlap is represented by the histogram on the top. For spatial expression patterns with smaller numbers of DEGs, we were able to list the gene names above their respective histogram. Genes are labeled for the smallest lists. HPF Hippocampal Formation, Neo CTX Neocortex, HY Hypothalamus, TH Thalamus, Allo CTX Allocortex, SLAN Striatum-like amygdalar nuclei.
Fig. 3
Fig. 3. Each hippocampal subregions displays a unique transcriptional impact of sleep deprivation.
A Prediction score of the deconvolution step for each of the 2085 spots of a representative example slice for CA1 pyramidal layer and dentate gyrus (DG) granule cells are represented with the color legend from blue to red. The rest of the subregions were selected based on biological knowledge using anatomical structures apparent on the H&E staining images. B Example of identified hippocampal subregions on sample 16. C UpSet plot of interactions between each hippocampal subregion. The number of differentially expressed genes (DEGs) submitted for each subregion is represented by the histogram on the left (0–62 range). A gene is significant if its FDR step-up <0.1 and its log2fold-change ≥ |0.2 | . Dots alone indicate no overlap with any other lists. Dots with connecting lines indicate one or more overlap of DEGs between hippocampal subregion. The number of DEGs in a specific list of overlap is represented by the histogram on the top. Genes are labeled for the smallest lists. The unique lists of 53 DEGs and 51 DEGs for stratum radiatum and CA1 pyramidal cells respectively enriched specific molecular functions displayed on the left. The size of the circle for each enriched molecular function is proportional to the significance. Only molecular functions with a corrected p < 0.05 are displayed (two-sided hypergeometric test, Bonferroni step down). A gene is considered significant if FDR < 0.001 and log2fold change > |0.2 | .
Fig. 4
Fig. 4. Each cortical layer of the neocortex displays a unique transcriptional impact of sleep deprivation.
A Prediction score of the deconvolution step for each of the 2085 spots of a representative example slice for each cortical layer are represented with the color legend from blue to red: layer 2–3 (A1), layer 4 (A2), layer 5 (A3), layer 6 (A4). We can distinguish between distinct sequential laminar excitatory neurons layers on the aggregated profile (A5). B UpSet plot of interactions between each deconvoluted cortical layers of the neocortex. The number of differentially expressed genes (DEGs) submitted for each layer is represented by the histogram on the left (0–225 range). A gene is significant if its FDR step-up <0.001 and its log2fold-change ≥ |0.2 | . Dots alone indicate no overlap with any other lists. Dots with connecting lines indicate one or more overlap of DEGs between cortical layers. The number of DEGs in a specific list of overlap is represented by the histogram on the top. Genes are labeled for the smallest lists. L2/3 = Layer 2 and 3; L4 = Layer 4; L5 = Layer 5; L6 = Layer 6. The unique lists of 174 DEGs for layer 5 and 149 DEGs for layer 2/3 that enrich specific molecular functions are listed on the left. The size of the circle for each enriched molecular function is proportional to the significance. Only molecular functions with a corrected p < 0.05 are displayed (two-sided hypergeometric test, Bonferroni step down). A gene is considered significant if FDR < 0.001 and log2fold change > |0.2 | .
Fig. 5
Fig. 5. Registration of spatial data to Allen Common Coordinate Framework and statistical analysis of aligned transcriptomic spots.
A Nonlinear registration of the tissue image from a single brain slice (A1) and its transcriptomic spot coordinates (A2)—shown as example: the gene Camk2n1 – to the template image (A3), slice 70 from the Allen P56 Mouse Common Coordinate Framework (CCF), Allen Mouse Brain Atlas, mouse.brain-map.org. Due to the nonlinear nature of the registration, we were able to precisely align the sample image (A4) to landmarks in the template image and apply that transformation to the spot coordinates (A5). To account for different numbers of spots in individual samples, digital spots spaced at 150 µm in a honeycomb were created for the template slice. Each digital spot is populated with the log base 2 normalized transcriptomic counts from the 7 nearest spots from each sample in a group (A7). This approach allows the comparison of gene expression across entire brain slices in an unrestricted inference space. BG Samples were split into non-sleep deprived (NSD, n = 6, 42 sample spots per digital spot) and sleep deprived (SD, n = 7, 49 sample spots per digital spot). The range of the color bar for the mean calculations is set from 0 to a log2 fold-change of 3, the maximum fold change for the genes shown, while the color bar for the SD > NSD t-statistic (B3G3) is bounded to [−4,4], which is approximately the equivalent to the FDR < 0.1. *indicates the gene is significant at FDR < 0.1, **indicates significance at FDR < 0.05. We show a selected group of 6 genes from the 413 DEGs (Supplementary Data 10) (BG). Panel 1 shows for each gene (B1G1) the mean normalized gene count in NSD, panel 2 depicts the mean normalized gene count in SD (B2G2) and panel 3 shows the t-statistics (B3G3). The following DEGs are depicted: B Per1, 4 significant spots. C Nr4a1, 29 significant spots. D Homer1, 306 significant spots. E Arc, 168 significant spots. F Rbm3, 31 significant spots. G Cirbp, 9 significant spots.

Update of

References

    1. Wheaton AG, Jones SE, Cooper AC, Croft JB. Short sleep duration among middle school and high school students—United States, 2015. Morb. Mortal. Wkly. Rep. 2018;67:85–90. doi: 10.15585/mmwr.mm6703a1. - DOI - PMC - PubMed
    1. McHill AW, Wright KP. Role of sleep and circadian disruption on energy expenditure and in metabolic predisposition to human obesity and metabolic disease. Obes. Rev. 2017;18(Suppl 1):15–24. doi: 10.1111/obr.12503. - DOI - PubMed
    1. Hudson AN, Van Dongen HPA, Honn KA. Sleep deprivation, vigilant attention, and brain function: a review. Neuropsychopharmacology. 2020;45:21–30. doi: 10.1038/s41386-019-0432-6. - DOI - PMC - PubMed
    1. Krause AJ, et al. The sleep-deprived human brain. Nat. Rev. Neurosci. 2017;18:404–418. doi: 10.1038/nrn.2017.55. - DOI - PMC - PubMed
    1. Raven F, Van der Zee EA, Meerlo P, Havekes R. The role of sleep in regulating structural plasticity and synaptic strength: Implications for memory and cognitive function. Sleep. Med. Rev. 2018;39:3–11. doi: 10.1016/j.smrv.2017.05.002. - DOI - PubMed

Publication types