. 2023 Nov 4;14(1):7096.
doi: 10.1038/s41467-023-42758-6.

Poor sleep and shift work associate with increased blood pressure and inflammation in UK Biobank participants

Affiliations

Poor sleep and shift work associate with increased blood pressure and inflammation in UK Biobank participants

Monica Kanki et al. Nat Commun. .

Abstract

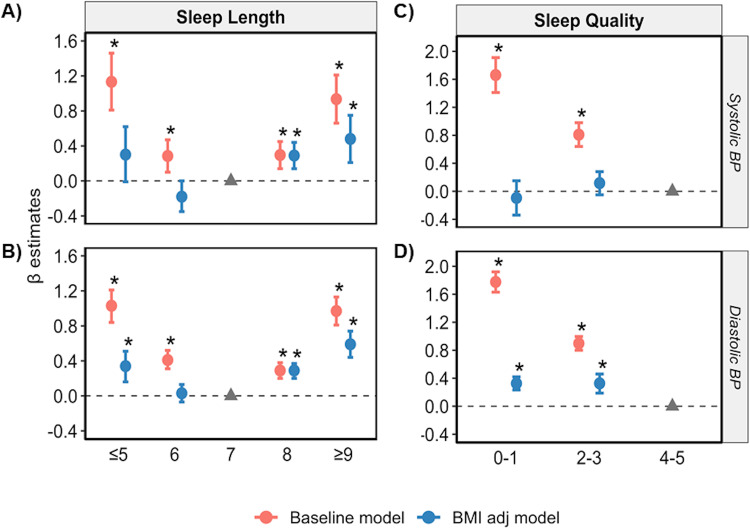
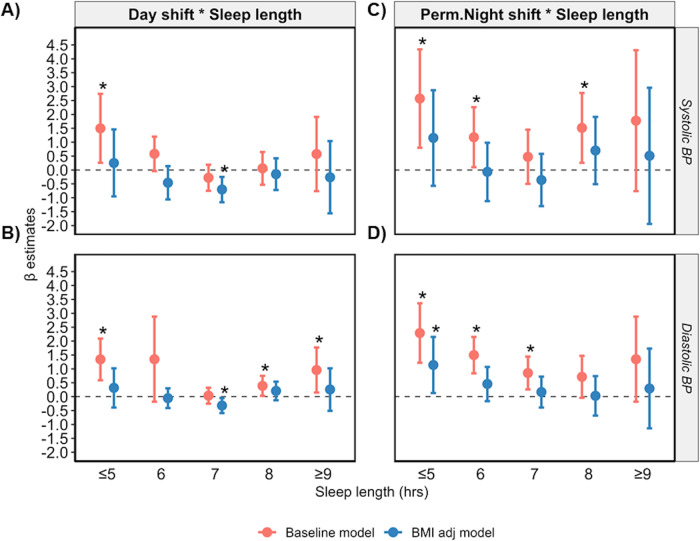
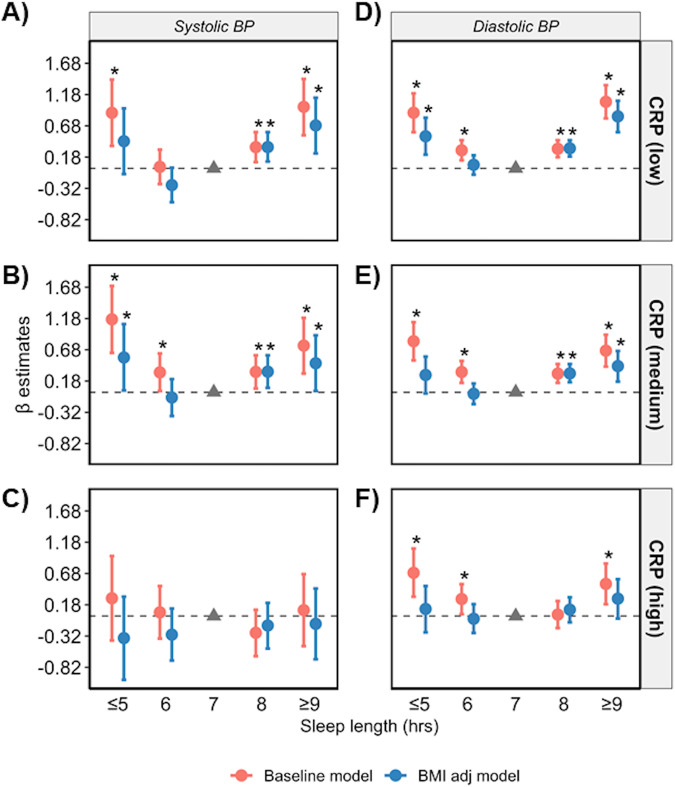
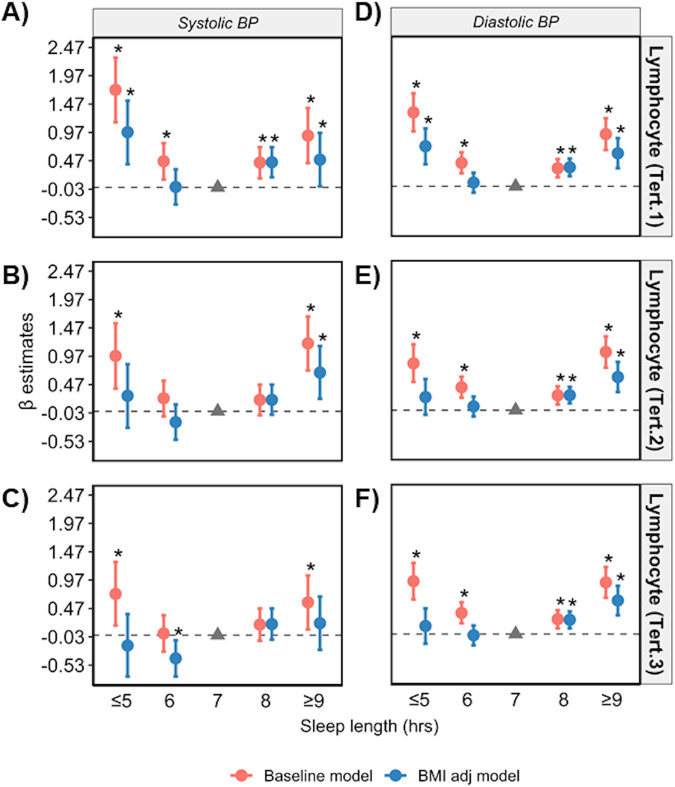
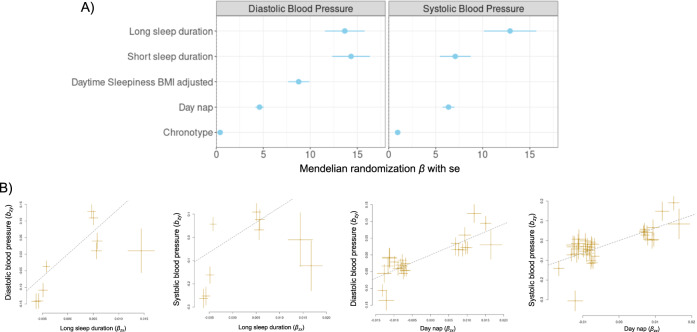
Disrupted circadian rhythms have been linked to an increased risk of hypertension and cardiovascular disease. However, many studies show inconsistent findings and are not sufficiently powered for targeted subgroup analyses. Using the UK Biobank cohort, we evaluate the association between circadian rhythm-disrupting behaviours, blood pressure (SBP, DBP) and inflammatory markers in >350,000 adults with European white British ancestry. The independent U-shaped relationship between sleep length and SBP/DBP is most prominent with a low inflammatory status. Poor sleep quality and permanent night shift work are also positively associated with SBP/DBP. Although fully adjusting for BMI in the linear regression model attenuated effect sizes, these associations remain significant. Two-sample Mendelian Randomisation (MR) analyses support a potential causal effect of long sleep, short sleep, chronotype, daytime napping and sleep duration on SBP/DBP. Thus, in the current study, we present a positive association between circadian rhythm-disrupting behaviours and SBP/DBP regulation in males and females that is largely independent of age.


Conflict of interest statement

The authors declare no competing interests.

Figures

Fig. 1
Fig. 1. A U-shaped association exists between sleep length and SBP/DBP is present even when adjusted for BMI.
Relationship between sleep length (A, B) and sleep quality (C, D) versus SBP and DBP, respectively, with (baseline model, red) and without adjustment for BMI (BMI adj model, blue). Data are expressed as β-estimate ± 95% CI, which are presented as the centre circle and corresponding error bars, respectively. P-values are estimated using multivariate logistic regression. *p < 0.05 versus sleep length of 7 h or a sleep quality score of 4–5, respectively, denoted by the solid grey triangle. Please see also Supplementary Table S1.
Fig. 2
Fig. 2. Mixed shift and permanent night shift work are positively associated with SBP and DBP.
Relationship between shift work schedule versus SBP (A) and DBP (B), respectively, with (baseline model, red) and without adjustment for BMI (BMI adj model, blue). Data are expressed as β-estimate ± 95% CI, which are presented as the centre circle and corresponding error bars, respectively. P-values are estimated using multivariate logistic regression. *p < 0.05 versus no shift work group denoted by the solid grey triangle. Please see also Supplementary Table S1.
Fig. 3
Fig. 3. A U-shaped relationship between sleep length and BP persists in day shift workers and permanent night shift workers.
Relationship between sleep length versus SBP and DBP in day shift (A, B) and permanent night shift workers (C, D) with (baseline model, red) and without adjustment for BMI (BMI adj model, blue). Data are expressed as β-estimate ± 95% CI, which are presented as the centre circle and corresponding error bars, respectively. P-values are estimated using multivariate logistic regression. *p < 0.05 versus are non-shift workers who reported an average of is 7 h sleep per day denoted by the solid grey triangle. Please see also Supplementary Table S10A and S10B.
Fig. 4
Fig. 4. Sleep length versus BP stratified by CRP levels.
Relationship between sleep length and SBP (AC) and DBP (DF) after data is stratified by low (<1 mg/L), medium (1–3 mg/L) and high (>3 mg/L) plasma CRP, respectively. Data are expressed as β-estimate ±95% CI, which are presented as the centre circle and corresponding error bars, respectively. P-values are estimated using multivariate logistic regression. *p < 0.05 versus sleep length of 7 hr denoted by the solid grey triangle. Please see also Supplementary Table S13.
Fig. 5
Fig. 5. Sleep length versus BP stratified by lymphocyte count.
Relationship between sleep length and SBP (AC) and DBP (DF) after data is stratified into lower (<1.62 × 109 cells/L), middle (1.62–2.1 × 109 cells/L) and upper (>2.1 × 109 cells/L) terciles of lymphocyte counts, respectively. Data are expressed as β-estimate ± 95% CI, which are presented as the centre circle and corresponding error bars, respectively. P-values are estimated using multivariate logistic regression. *p < 0.05 versus sleep length of 7 hr denoted by the solid grey triangle. Please see also Supplementary Table S13.
Fig. 6
Fig. 6. Sleep length versus BP stratified by monocyte count.
Relationship between sleep length and SBP (AC) and DBP (DF) after data is stratified into lower (<0.4 × 109 cells/L), middle (0.4–0.51 × 109 cells/L) and upper (>0.51 × 109 cells/L) terciles of monocyte counts, respectively. Data are expressed as β-estimate ± 95% CI, which are presented as the centre circle and corresponding error bars, respectively. P-values are estimated using multivariate logistic regression. *p < 0.05 versus sleep length of 7 hr denoted by the solid grey triangle. Please see also Supplementary Table S14.
Fig. 7
Fig. 7. Sleep length versus BP stratified by neutrophil count.
Relationship between sleep length and SBP (AC) and DBP (DF) after data is stratified into lower (<3.54 × 109 cells/L), middle (3.54–4.6 × 109 cells/L) and upper (>4.6 × 109 cells/L) terciles of neutrophil counts, respectively. Data are expressed as β-estimate ± 95% CI, which are presented as the centre circle and corresponding error bars, respectively. P-values are estimated using multivariate logistic regression. *p < 0.05 versus sleep length of 7 hr denoted by the solid grey triangle. Please see also Supplementary Table S14.
Fig. 8
Fig. 8. Results of Mendelian Randomisation (MR) between sleep traits (exposure) and blood pressure (outcome) using GSMR.
A summary of all MR results. MR results are only shown if they had adjusted p-value < 0.05 and the results from GSMR agreed with MR-Egger and/or weighted median MR. Data are expressed as β-estimate ±95% CI, which are presented as the centre circle and corresponding error bars, respectively. B example of the effects (β-estimate) causal association between sleep traits and blood pressure. P-values of MR are based on the 2-sided test of GSMR after adjustment of multi-testing. Adjusted pMR = 6.4e-10 for long sleep duration and diastolic blood pressure. Adjusted pMR = 9.5e-6 for long sleep duration and systolic blood pressure. Adjusted pMR = 8.7e-25 for day nap and diastolic blood pressure. Adjusted pMR = 4e-23 for day nap and systolic blood pressure. Please see also Table 2.

References

    1. Bortkiewicz, A. (BMJ Publishing Group Ltd and British Cardiovascular Society, 2022).
    1. Fuchs FD, Whelton PK. High Blood Pressure and Cardiovascular Disease. Hypertension. 2020;75:285–292. doi: 10.1161/HYPERTENSIONAHA.119.14240. - DOI - PMC - PubMed
    1. Guo X, et al. Epidemiological evidence for the link between sleep duration and high blood pressure: a systematic review and meta-analysis. Sleep. Med. 2013;14:324–332. doi: 10.1016/j.sleep.2012.12.001. - DOI - PubMed
    1. Makarem N, et al. Sleep duration and blood pressure: recent advances and future directions. Curr. Hypertension Rep. 2019;21:1–12. - PMC - PubMed
    1. Vetter C. Circadian disruption: What do we actually mean? Eur. J. Neurosci. 2020;51:531–550. doi: 10.1111/ejn.14255. - DOI - PMC - PubMed

Publication types