. 2023 Nov 4;14(1):7105.
doi: 10.1038/s41467-023-42897-w.

Ancestry-specific polygenic risk scores are risk enhancers for clinical cardiovascular disease assessments

Affiliations

Ancestry-specific polygenic risk scores are risk enhancers for clinical cardiovascular disease assessments

George B Busby et al. Nat Commun. .

Abstract

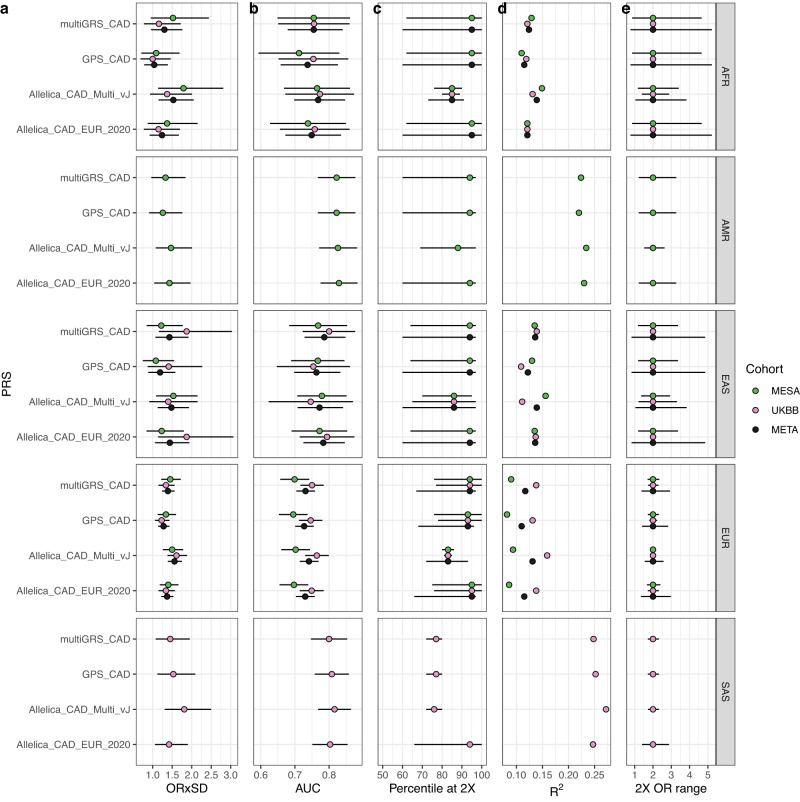
Clinical implementation of new prediction models requires evaluation of their utility in a broad range of intended use populations. Here we develop and validate ancestry-specific Polygenic Risk Scores (PRSs) for Coronary Artery Disease (CAD) using 29,389 individuals from diverse cohorts and genetic ancestry groups. The CAD PRSs outperform published scores with an average Odds Ratio per Standard Deviation of 1.57 (SD = 0.14) and identify between 12% and 24% of individuals with high genetic risk. Using this risk factor to reclassify borderline or intermediate 10 year Atherosclerotic Cardiovascular Disease (ASCVD) risk improves assessments for both CAD (Net Reclassification Improvement (NRI) = 13.14% (95% CI 9.23-17.06%)) and ASCVD (NRI = 10.70 (95% CI 7.35-14.05)) in an independent cohort of 9,691 individuals. Our analyses demonstrate that using PRSs as Risk Enhancers improves ASCVD risk assessments outlining an approach for guiding ASCVD prevention with genetic information.


Conflict of interest statement

All authors are employees of Allelica, Inc.

Figures

Fig. 1
Fig. 1. Multi-ancestry PRSs for CAD predict risk in diverse ancestries and add to clinical risk assessments.
For five different genetic ancestry groups we show a the point estimate and 95% CI of the Odds Ratio per Standard Deviation (ORxSD) of the ancestry-specific polygenic risk scores in the UK Biobank and MESA Testing populations. META describes the results of a meta analysis of the cohort-specific ORxSDs. Squares denote the reported ORxSD for each ancestry and point size is proportional to the standard error of the ORxSD estimate. Values on the right of the panel are the reported ORxSD with 95% CI together with the numbers of cases and controls in the Testing populations. b The calibration curves of the PRS models that compare each model’s response type predictions to the actual prevalence of disease. The points show the mean value of each quantity across deciles of the predictions, vertical error bars show the 95% CI around the mean probability in each decile, the red line follows the trend of these decile values and the black line shows perfect calibration; c the Odds Ratio based on the upper tail compared to the remainder of the distribution and the percentile threshold at which 2× increased risk is met; d the proportion of the PRS distribution at at least twofold increased risk compared with the remainder; e comparison showing no significant difference (calculated via one-sided Fisher’s Exact Test) between the proportions of individuals in each of the PCE risk groups in those with and without PRS as a risk enhancing factor; f the proportion of individuals in each of the PCE strata who had a CHD event during the follow-up time of the prospective cohort that they were sampled from. We show the proportions for individuals classified into each PCE group and the total dataset (All) split into individuals with and without PRS as a Risk Enhancing Factor. Horizontal error bars denote the 95% CI around the proportion of individuals in each risk group; f is the same as g except showing the proportion of individuals in each of the PCE strata who did not have a CHD event during the follow-up time of the prospective cohort that they were sampled from. Horizontal error bars denote the 95% CI around the proportion of individuals in each risk group. Total sample sizes for each group are (cases/controls):  AFR / African (51/1248); AMR /  American (50/642); EAS / East Asian (50/1343); EUR / European: (346/3694); SAS / South Asian (69/471).
Fig. 2
Fig. 2. Evaluation of the performance of the Allelica CAD multi-ancestry PRSs against three published PRSs.
For each PRS/genetic ancestry combination we show benchmarking results for the Allelica_CAD_vJ PRSs and three published PRSs applied to exactly the same testing populations. Total sample sizes of the testing populations are (cases/controls): AFR / African (51/1248); AMR / American (50/642); EAS / East Asian (50/1343); EUR / European (346/3694); SAS / South Asian (69/471) and a breakdown per sub-cohort shown in Supplementary Table 15. We assessed the statistics on the sub-cohorts and, where possible, a meta analysis of the sub-cohort values. The statistics shown, with horizontal error bars detailing the 95% CI of these values, are a the point estimate of the Odds Ratio per Standard Deviation of the PRSs; b the Area Under the Receiver Operator Curve with 95% CI estimated; c the threshold percentile of the PRS distribution where 2× risk is achieved; d Nagelkerke R2; and e the range of the odds at the 2× threshold.

References

    1. Global burden of 369 diseases and injuries in 204 countries and territories, 1990–2019: a systematic analysis for the Global Burden of Disease Study 2019. Lancet396. https://www.thelancet.com/journals/lancet/article/PIIS0140-6736(20)30925.... - PMC - PubMed
    1. Getz GS, Reardon CA. Nutrition and cardiovascular disease. Arterioscler. Thromb. Vasc. Biol. 2007;27:2499–2506. doi: 10.1161/ATVBAHA.107.155853. - DOI - PubMed
    1. Zdravkovic S, et al. Heritability of death from coronary heart disease: a 36-year follow-up of 20 966 Swedish twins. J. Intern. Med. 2002;252:247–254. doi: 10.1046/j.1365-2796.2002.01029.x. - DOI - PubMed
    1. Schunkert H, et al. Large-scale association analyses identifies 13 new susceptibility loci for coronary artery disease. Nat. Genet. 2011;43:333–338. doi: 10.1038/ng.784. - DOI - PMC - PubMed
    1. Abul-Husn NS, et al. Genetic identification of familial hypercholesterolemia within a single U.S. health care system. Science. 2016;354:aaf7000. doi: 10.1126/science.aaf7000. - DOI - PubMed

Publication types