. 2023 Nov 4;8(1):37.
doi: 10.1038/s41525-023-00377-6.

Neurodevelopmental disorders and cancer networks share pathways, but differ in mechanisms, signaling strength, and outcome

Affiliations

Neurodevelopmental disorders and cancer networks share pathways, but differ in mechanisms, signaling strength, and outcome

Bengi Ruken Yavuz et al. NPJ Genom Med. .

Abstract

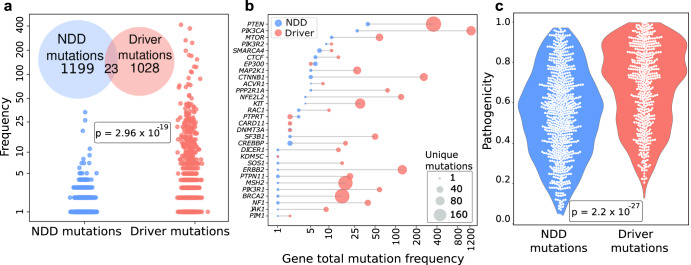
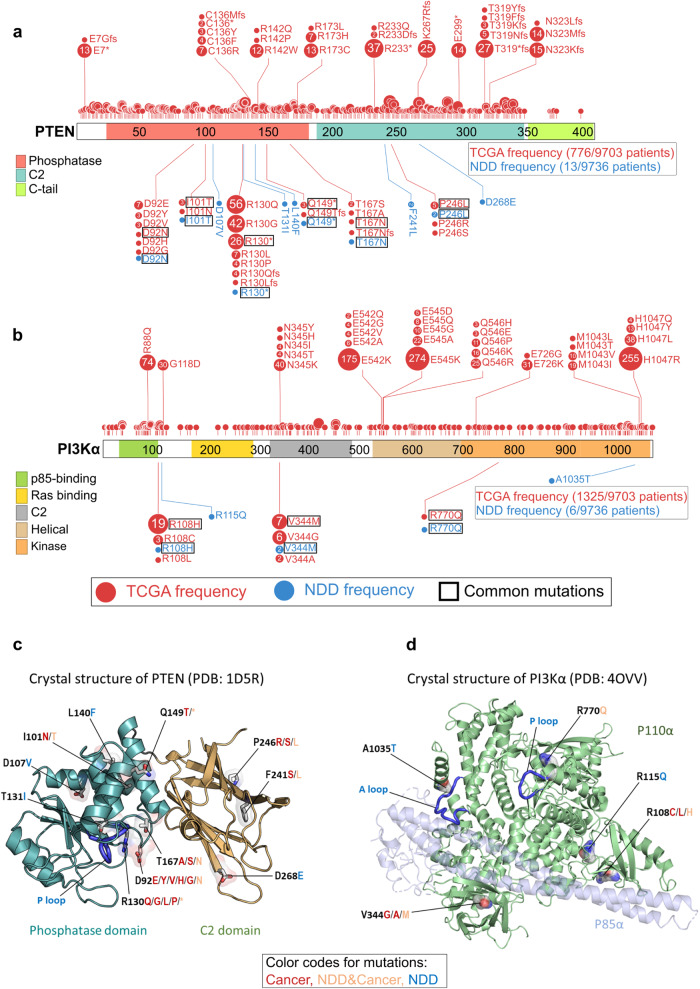
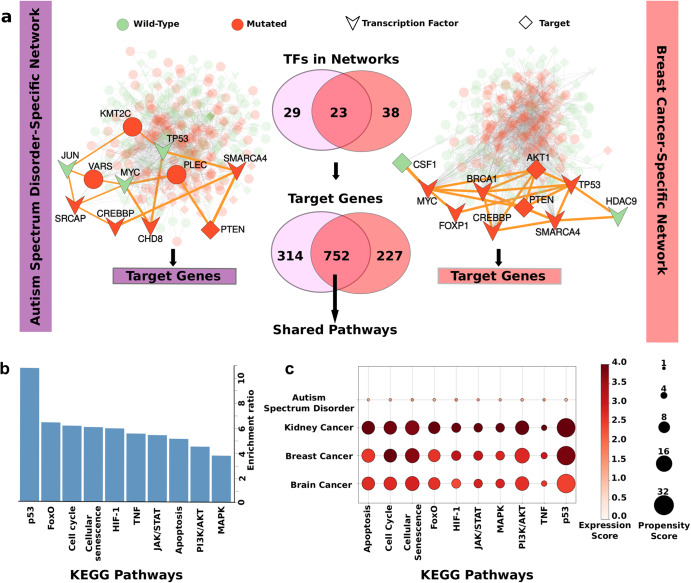
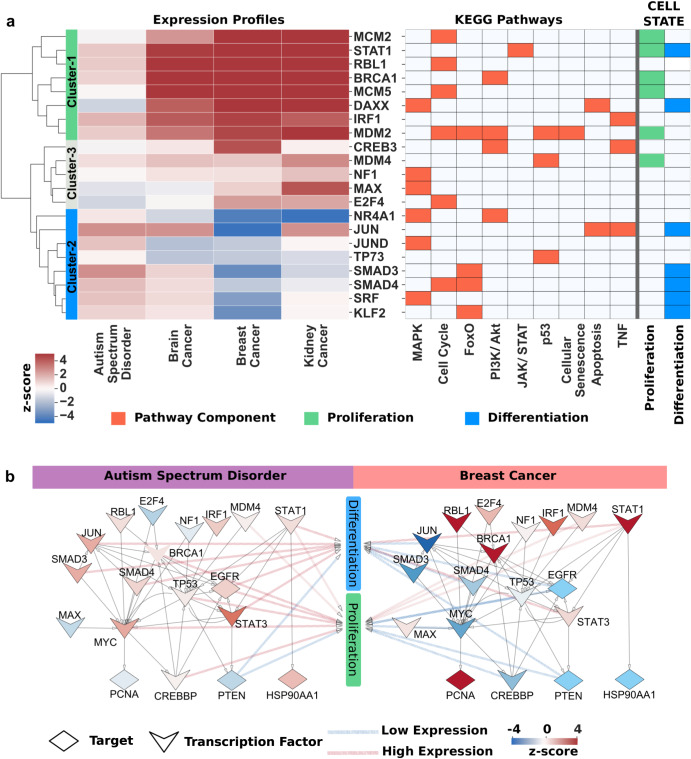
Epidemiological studies suggest that individuals with neurodevelopmental disorders (NDDs) are more prone to develop certain types of cancer. Notably, however, the case statistics can be impacted by late discovery of cancer in individuals afflicted with NDDs, such as intellectual disorders, autism, and schizophrenia, which may bias the numbers. As to NDD-associated mutations, in most cases, they are germline while cancer mutations are sporadic, emerging during life. However, somatic mosaicism can spur NDDs, and cancer-related mutations can be germline. NDDs and cancer share proteins, pathways, and mutations. Here we ask (i) exactly which features they share, and (ii) how, despite their commonalities, they differ in clinical outcomes. To tackle these questions, we employed a statistical framework followed by network analysis. Our thorough exploration of the mutations, reconstructed disease-specific networks, pathways, and transcriptome levels and profiles of autism spectrum disorder (ASD) and cancers, point to signaling strength as the key factor: strong signaling promotes cell proliferation in cancer, and weaker (moderate) signaling impacts differentiation in ASD. Thus, we suggest that signaling strength, not activating mutations, can decide clinical outcome.


Conflict of interest statement

The authors declare no competing interests.

Figures

Fig. 1
Fig. 1. Overview of the data and workflow.
a Statistics from NDDs and cancer datasets. denovo-db deposits mutation profiles of 9736 samples across 20 phenotypes including eight NDDs (left panel). TCGA provides mutation profiles of 9703 tumors across 33 cancer types (middle panel). The length of each bar (y-axis in a logarithmic scale) in the upset plots shows the number of all mutated genes and the number of TFs, TSGs, OGs among the mutated genes for NDDs (left panel) and cancer samples (middle panel). There are 712 TFs, 162 TSGs, and 147 OGs out of 7907 mutated genes among denovo-db samples. Similarly, there are 1579 TFs, 259 TSGs, and 249 OGs out of 19,438 mutated genes among the cancer samples. The Venn diagram (right panel) shows that there are 6848 common mutated genes between NDDs and cancer; the number of NDD- and cancer-specific mutated genes are 61 and 12,583, respectively. TSG tumor suppressor gene, OG oncogene. b Network of phenotypes in denovo-db. Each node represents one phenotype in the network, and each edge represents the connection between two phenotypes if they share at least one commonly mutated gene. NDD phenotypes are shown in green color. Each phenotype is represented with a vector of three numbers; the total number of patients having the phenotype (cyan), total number of genes carrying at least one mutation (orange), and total number of mutations associated with the phenotype (purple). The ticker edges represent the more commonly mutated genes. The most tightly connected pair among the phenotype pairs is autism and developmental disorder. c A conceptual representation of network comparison analysis between NDDs and cancer. Two distinct networks (left panel) reconstructed for breast cancer (large pink circle) and ASD (large purple circle). These two networks have both shared (shaded green) and separated regions. These networks contain oncogenes (red circle), tumor suppressors (yellow circle), and TFs (green V-shapes). The transcriptome analysis (upper-right panel) associates the expression levels of the nodes with the pathway activity. Each enriched pathway in the network can be quantified with the average expression level of its nodes, which is called “pathway scoring.” The score of each shared pathway (1, 2, .., n) for each disease (ASD, purple; cancer, red) is calculated (shown as a wifi icon where the higher score is the stronger signal).
Fig. 2
Fig. 2. Comparison of mutations between NDDs and cancer.
a Frequency-based analysis of mutations for NDDs and cancer. The cancer driver mutations in TCGA in comparison to the frequency of NDD mutations. The cancer driver mutations were selected amongst tumor samples only. Among the cancer mutations in TCGA, 23 mutations are shared between NDD and known cancer driver mutations, while 1199 are NDD-specific and 1028 are cancer-specific mutations (inset Venn diagram). Comparison of the frequency of these mutations in the TCGA cohort (y-axis in a logarithmic scale, where frequency=log10(N + 1) and N is the number of patients). The difference between mutation frequency distribution in TCGA with t-test shows that the mutations present in both NDDs and TCGA are significantly rare in the TCGA cohort when compared to driver mutations (p < 0.001). b Frequency of mutations on common genes in NDDs and known cancer drivers datasets. The dumbbell plot shows the mutation frequencies of common genes–the genes harboring at least one point mutation among NDDs and cancer samples-in cancer (TCGA) and NDDs (denovo-db) simultaneously. Cancer driver mutations (red) are more frequent than or equal to NDD mutations (blue) except EP300 and PTPRT. The size of the circles represents the number of unique mutations each gene carries. The x-axis in a logarithmic scale represents the number of patients having at least one mutation in the corresponding gene in TCGA or NDD sets. c MutPred2 pathogenicity scores of NDDs and cancer driver mutations. Violin plots show the distribution of NDD and driver mutation pathogenicity scores. A comparison of the pathogenicity scores using a t-test shows that the pathogenicity of driver mutations is significantly higher (p < 0.001). Pathogenicity scores are between 0 and 1, where 1 is the most pathogenic.
Fig. 3
Fig. 3. Profiles of TCGA and NDD mutations for PTEN and PI3Kα at the residue level on the sequence and structure.
a Mutations of PTEN are shown as circles, where the phosphatase domain (red), C2 domain (dark green), and C-tail (light green) are represented as colored boxes along the sequence. The number and size of the circle represent the frequency of each mutation in the NDD (blue) or TCGA (red) datasets. Mutations shared by both datasets are highlighted with rectangular borders for emphasis. Total mutation frequencies and the total number of patients in each dataset are shown in the bottom right box. Nonsense mutations are abbreviated with star (*) sign. 6 of 11 PTEN mutations in the NDD set are present in TCGA. Only R130* has a high frequency relative to other shared mutations, yet it is much less frequent when compared to two other TCGA mutations on the same position, R130Q and R130G. b Mutations of PI3Kα (PIK3CA) are shown as circles where ABD (green), RBD (yellow), C2 domain (gray), helical domain (light orange), and kinase domain (orange) are represented as colored boxes along the sequence. The number and size of the circle represent the frequency of each mutation in the NDD (blue) or TCGA (red) datasets. Mutations shared by both datasets are highlighted with rectangular borders for emphasis. Total mutation frequencies and the total number of patients in each dataset are shown in the bottom right box. Three out of five PI3Kα mutations in the NDD set are present in TCGA. None of these TCGA mutations are on the most frequently mutated residues or among the most frequent mutations. ABD adapter-binding domain, RBD Ras-binding domain. The 3D structures of c PTEN (PDB: 1D5R) and d PI3Kα (PDB: 4OVV) with selected NDD and TCGA mutations. For each residue, mutated amino acids are colored in red, blue, or orange if they are present only among cancers, NDDs or both phenotypes, respectively. In PTEN, these mutations are known to affect the functions of protein including loss of phosphatase activity, reduced protein stability at the membrane, and failing to suppress AKT phosphorylation. In PI3Kα, these mutations may interrupt protein activation and reduce protein stability at the membrane.
Fig. 4
Fig. 4. ASD- and breast cancer-specific networks regulating common pathways.
a Disease-specific network reconstruction for ASD and breast cancer is performed by using pyPARAGON tool, where the frequently mutated genes are used as seeds. The nodes in reconstructed networks involve wild type (green circle), mutated genes (red circle), TFs (chevron), and TF-targets (diamond). The complete ASD-specific network (left side) features the mutated proteins (SRCAP, BRG1, PTEN, etc.) in ASD cases and reveals disease-associated proteins (Jun, p53, and Myc). The breast cancer-specific network (right side) illustrates driver genes, although some driver genes, such as TP53 and MYC, are not frequently mutated in ASD. Both ASD- and breast cancer-specific networks involve 23 common TFs targeting 752 common genes. These common targets are employed to identify shared pathways. BRG1 brahma-related gene 1, a.k.a. SMARCA4, SRCAP SNF2-related CREBBP activator protein, CREBBP cAMP response element binding protein, CHD8 chromodomain helicase DNA-binding protein 8, CSF1 macrophage colony-stimulating factor 1, HD9 histone deacetylase 9, FOXP1 forkhead box protein P1. b Overrepresentation analysis determines significant shared pathways (FDR ≤ 0.05) related to cell differentiation and proliferation among KEGG pathways. The pathways include MAPK, PI3K/AKT, and JAK/STAT. These shared TF-target genes play a significant role in cell fate by altering the signal strength and flow, as well as cell cycle and cellular senescence. HIF-1 hypoxia-inducible factor 1, TNF tumor necrosis factor. c Signal changes in shared pathways are illustrated with the expression scores of pathways, the mean of the absolute z-scores of proteins in a given pathway. We define expression scores as a mean of the absolute z-scores of proteins in a given pathway to indicate the magnitude of the deviation from the average expression values of the normal samples, regardless of the direction of the change. The vulnerability of common pathways to mutation is measured with a propensity score, the average unique mutation in the pathway. The darker red represents a higher change in expression scores of genes in the pathway, and the larger circle shows a higher mutation propensity for the corresponding pathway. ASD has the most minor signal differences and mutation propensities compared to all cancer types in shared pathways, where kidney cancer has the highest signal difference. However, there is an insignificant difference in mutation propensities amongst cancer types. The higher expression scores in cancer types point to stronger signal changes in pathways critical for cell fate, such as proliferation and differentiation. The higher propensity scores in cancer reveal that cancer mutations tend to group in shared pathways. Thus, shared pathways are more vulnerable to cancer than ones in ASD. However, mutation loads and signal deviations on the shared pathways might make ASD patients more fragile to cancer onset.
Fig. 5
Fig. 5. Differential expression profiles in shared pathways.
a Differential expression profiles of TFs in shared pathways. There were 71 TFs in shared pathways that determine cell fate via changes in signal levels. However, 57 TFs have expression scores in all diseases and 21 TFs were identified to be at least one time differentially expressed more (less) in ASD than in other cancer types. On the left hand, the heatmap of these differentially expressed genes (high in red, low in blue) clustered expression z-scores into three groups. On the right hand, the pathways TFs belong to, and related cell states (proliferation, green; differentiation, blue) are demonstrated. MCM2, STAT1, BRCA1, MCM5, DAXX, IRF1, and MDM2 in cluster-1 are highly expressed in cancers, while NR4A1, JUN, JUND, TP73, SMAD3, SMAD4, SRF, and KLF2 in cluster-2 are highly expressed in Autism. Genes more expressed in cancer types than in ASD mainly belong to the proliferation state, while genes related to differentiation are predominantly more expressed in ASD than in cancer types. b Differences between proliferation and differentiation on shared pathways. The signal flows from TFs (chevron) to targets (diamond) in common parts of ASD- and breast cancer-specific networks and in shared pathways were demonstrated with z-scores. The low and high expression levels were illustrated with blue to red, respectively. The relationship between cell state and proteins is represented with arrows whose color also demonstrates the level of expressions, low or high. Differentiation-related proteins, such as Jun, SMAD3, and SMAD4, mainly have low expression profiles in breast cancer, while most are highly expressed in ASD. PTEN, EGFR, and STAT1, related to proliferation and differentiation, have similar expression profiles. E2F4 E2F transcription factor 4, RBL1 retinoblastoma-like protein 1, NF1 neurofibromin, IRF1 interferon regulatory factor 1, BRCA1 breast cancer type 1 susceptibility protein, SMAD mothers against decapentaplegic, EGFR epidermal growth factor receptor, PCNA proliferating cell nuclear antigen, CREBBP cAMP response element binding protein, Hsp90α heat shock protein 90α.

Similar articles

Cited by

References

    1. Moreno-De-Luca A, et al. Developmental brain dysfunction: revival and expansion of old concepts based on new genetic evidence. Lancet Neurol. 2013;12:406–414. doi: 10.1016/S1474-4422(13)70011-5. - DOI - PMC - PubMed
    1. Khodosevich K, Sellgren CM. Neurodevelopmental disorders-high-resolution rethinking of disease modeling. Mol. Psychiatry. 2023;28:34–43. doi: 10.1038/s41380-022-01876-1. - DOI - PMC - PubMed
    1. Murtaza N, et al. Neuron-specific protein network mapping of autism risk genes identifies shared biological mechanisms and disease-relevant pathologies. Cell Rep. 2022;41:111678. doi: 10.1016/j.celrep.2022.111678. - DOI - PubMed
    1. Nussinov R, Tsai C-J, Jang H. How can same-gene mutations promote both cancer and developmental disorders? Sci. Adv. 2022;8:eabm2059. doi: 10.1126/sciadv.abm2059. - DOI - PMC - PubMed
    1. Jiang C-C, et al. Signalling pathways in autism spectrum disorder: mechanisms and therapeutic implications. Signal Transduct. Target Ther. 2022;7:229. doi: 10.1038/s41392-022-01081-0. - DOI - PMC - PubMed