. 2023 Nov 4;14(1):7107.
doi: 10.1038/s41467-023-42923-x.

A combined adjuvant approach primes robust germinal center responses and humoral immunity in non-human primates

Affiliations

A combined adjuvant approach primes robust germinal center responses and humoral immunity in non-human primates

Ivy Phung et al. Nat Commun. .

Abstract

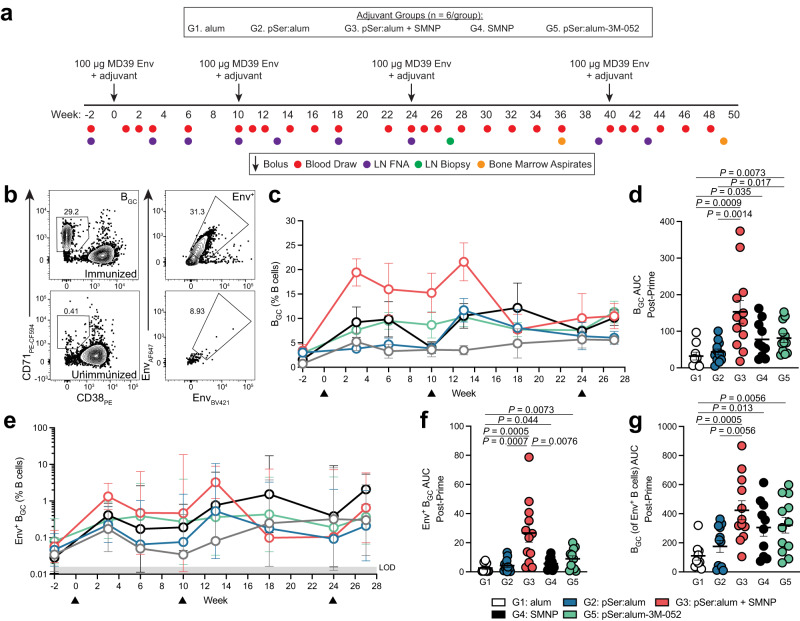
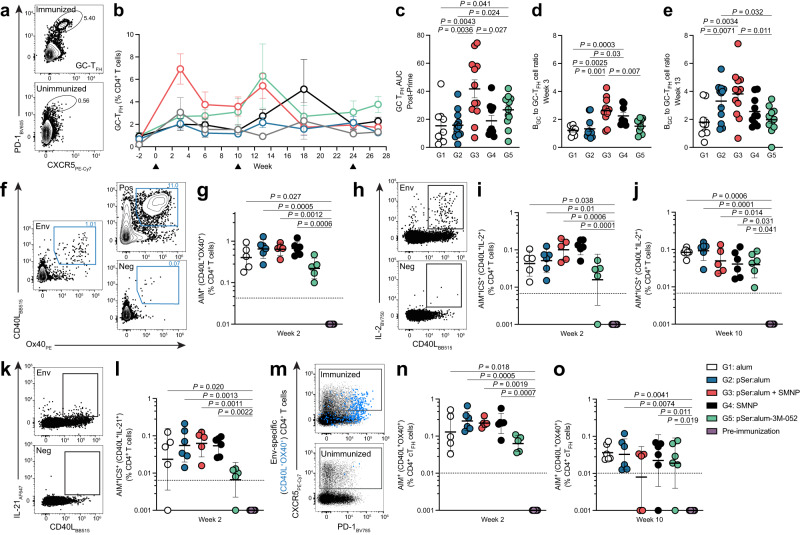
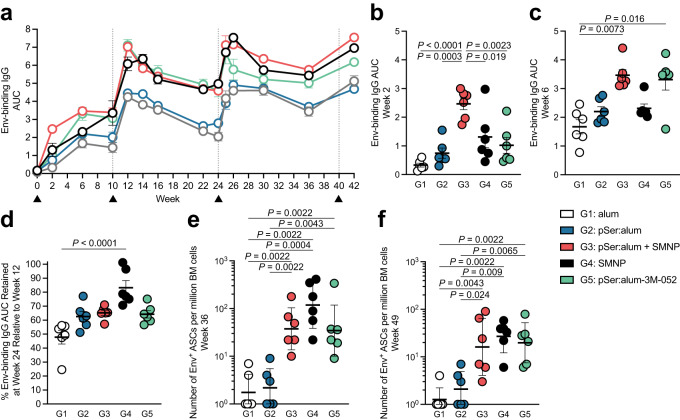
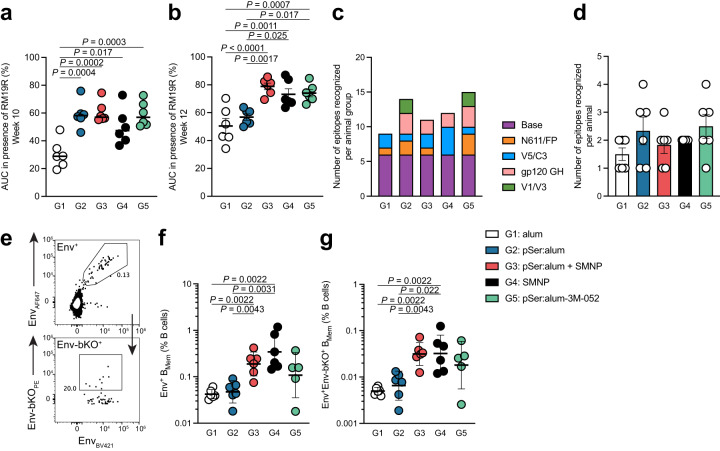
Adjuvants and antigen delivery kinetics can profoundly influence B cell responses and should be critically considered in rational vaccine design, particularly for difficult neutralizing antibody targets such as human immunodeficiency virus (HIV). Antigen kinetics can change depending on the delivery method. To promote extended immunogen bioavailability and to present antigen in a multivalent form, native-HIV Env trimers are modified with short phosphoserine peptide linkers that promote tight binding to aluminum hydroxide (pSer:alum). Here we explore the use of a combined adjuvant approach that incorporates pSer:alum-mediated antigen delivery with potent adjuvants (SMNP, 3M-052) in an extensive head-to-head comparison study with conventional alum to assess germinal center (GC) and humoral immune responses. Priming with pSer:alum plus SMNP induces additive effects that enhance the magnitude and persistence of GCs, which correlate with better GC-TFH cell help. Autologous HIV-neutralizing antibody titers are improved in SMNP-immunized animals after two immunizations. Over 9 months after priming immunization of pSer:alum with either SMNP or 3M-052, robust Env-specific bone marrow plasma cells (BM BPC) are observed. Furthermore, pSer-modification of Env trimer reduce targeting towards immunodominant non-neutralizing epitopes. The study shows that a combined adjuvant approach can augment humoral immunity by modulating immunodominance and shows promise for clinical translation.


Conflict of interest statement

W.R.S is named as an inventor on a patent for the MD39 immunogen (US No. 11,203,617). D.J.I. and W.R.S. are named as inventors on a patent for pSer technology (US No. 11,224,648 B2). D.J.I and S.C. are inventors on a patent for the SMNP adjuvant (US No. 11,547,672 B2). K.A.R. and D.J.I. are inventors on patent applications for the synergistic combination of alum and SMNP adjuvants (PCT/US2022/074302 and US No. 17/816,045). The remaining authors declare no competing interests.

Figures

Fig. 1
Fig. 1. pSer:alum modification and SMNP adjuvant work synergistically to promote germinal center activity.
a Schematic of the study where NHPs (n = 6 per group) were immunized with soluble native-like HIV BG505 Env trimer MD39 (“Env”) with the different adjuvants at the indicated timepoints. b Flow cytometry gating of BGC cells (CD38-CD71+) and of Env-binding BGC (Env-AF647+Env-BV421+). c BGC cell frequency (CD38-CD71+) as a percentage of B cells. d Area under the curve (AUC) of BGC cell frequency as a percentage of B cells post-priming immunization. e Env-binding BGC frequency as a percentage of B cells. f, AUC of Env-binding BGC cell frequency post-priming immunization. g AUC of the proportion of Env-binding B cell frequency that are BGC cells post-priming immunization. Black triangles represent time of immunization. Mean and SEM or geometric mean and geometric SD are plotted depending on the scale in all figures unless otherwise stated. For Fig. 1c-g, n = 12 samples (left and right LN, 6 animals per group). Statistical significance was tested using either unpaired two-tailed Mann-Whitney tests or Kruskal-Wallis test with Dunn’s multiple comparisons test, depending on the objectives of the study. *p < 0.05, **p < 0.01, ***p < 0.001, ****p < 0.0001. Source data are provided as a Source Data File.
Fig. 2
Fig. 2. Robust GC-TFH cell help and Env-specific T cell responses detected after priming immunization.
a Flow cytometry gating of GC-TFH cells (PD-1hiCXCR5+). b Longitudinal analysis of GC-TFH cell frequency as a percentage of CD4+ T cells. c AUC of GC-TFH cells post-priming immunization. d BGC to GC-TFH cell ratio at week 3. e BGC to GC-TFH cell ratio at week 13. f Representative flow plot of an AIM assay performed at week 2 to detect Env-specific CD4+ T cells. Stimulation conditions include: negative, unstimulated DMSO control (“Neg”), 15-mer overlapping MD39-Env peptide megapool (“Env”), and positive control with superantigen staphylococcal enterotoxin (“Pos”). AIM assays were also performed at week 10. g AIM+ (CD40L+OX40+) T cell frequency as a percentage of CD4+ T cells at week 2. h Representative flow plots of an intracellular cytokine assay (ICS) to assess cytokine function in Env-specific CD4+ T cells. CD40L+IL-2+ is shown with corresponding Env-stimulated sample and unstimulated control sample. i, AIM+ICS+ (CD40L+IL-2+) T cells as a percentage of CD4+ T cells at week 2. j AIM+ICS+ (CD40L+IL-2+) T cells as a percentage of CD4+ T cells at week 10. k Representative flow plots of an intracellular cytokine assay (ICS) to assess cytokine function in Env-specific CD4+ T cells. CD40L+IL-21+ is shown with corresponding Env-stimulated sample and unstimulated control sample. l AIM+ICS+ (CD40L+IL-21+) T cells as a percentage of CD4+ T cells at week 2. m Representative flow plot of an AIM assay to detect Env-specific circulating TFH (cTFH) cells. n AIM+ (CD40L+OX40+) cTFH frequency as a percentage of CD4+ T cells at week 2. o, AIM+ (CD40L+OX40+) cTFH frequency as a percentage of CD4+ T cells at week 10. Black dotted lines indicate the limit of quantification. Black triangles represent time of immunization. Mean and SEM or geometric mean and geometric SD are plotted depending on the scale in all figures unless otherwise stated. For Fig. 2b–e, n = 12 samples (left and right LN, 6 animals per group). For Fig. 2f–o, n = 6 per group. Statistical significance for GC-TFH cell frequencies (a-e) was tested using unpaired two-tailed Mann-Whitney test or Kruskal-Wallis test with Dunn’s multiple comparisons test, depending on the objectives of the study. Statistical significance for Env-specific AIM assays (f-o) were tested using Kruskal-Wallis test with uncorrected Dunn’s multiple comparisons test. *p < 0.05, **p < 0.01, ***p < 0.001, ****p < 0.0001. Source data are provided as a Source Data File.
Fig. 3
Fig. 3. Combined pSer:alum approach with either SMNP or 3M-052 induce enhanced antibody responses and promote bone marrow plasma cell responses.
a Full time course of the area under the curve (AUC) of total Env-binding serum IgG, as determined by ELISA. b AUC of Env-binding serum IgG at week 2. c AUC of Env-binding serum IgG at week 6. d Percentage of Env-binding AUC retained at week 24 relative to week 12. Percentage retained is calculated by taking the AUC at week 12 over the AUC at week 24. All other pairwise comparisons were not significant. e BG505 Env-specific bone marrow plasma cell (BM BPC) responses from bone marrow aspirates as determined by ELISpot assays. Env-specific ELISpots were performed at week 36. f Env-specific ELISpots performed at week 49. Black triangles and gray dotted lines represent time of immunization. Mean and SEM or geometric mean and geometric SD are plotted depending on the scale in all figures unless otherwise stated. For Fig. 3a–f, n = 6 per group. Statistical significance for ad were measured using either Ordinary one-way ANOVA with Tukey’s multiple comparisons test or Kruskal-Wallis test with Dunn’s multiple comparisons test, depending on the distribution of the data (determined by normality or lognormality tests). Statistical significance for BM BPC ELISpots (e, f) was tested using either unpaired two-tailed Mann-Whitney tests or Kruskal-Wallis test with Dunn’s multiple comparisons test, depending on the objectives of the study. *p < 0.05, **p < 0.01, ***p < 0.001, ****p < 0.0001. Source data are provided as a Source Data File.
Fig. 4
Fig. 4. pSer:alum+ SMNP elicits high autologous nAb titers.
Serum dilution at 50% inhibition of BG505 pseudovirus in a neutralization assay (ID50). Neutralization assays were performed at: a week 12. b week 26. c week 42. NN = non-neutralizing. Neutralization data (Fig. 4a) for Group 1, alum, has been previously published. Mean and SEM or geometric mean and geometric SD are plotted depending on the scale in all figures unless otherwise stated. For Fig. 4a–c, n = 6 per group, with two independent experiments averaged. Statistical significance was tested using either unpaired two-tailed Mann-Whitney tests or Kruskal-Wallis test with Dunn’s multiple comparisons test, depending on the objectives of the study. *p < 0.05, **p < 0.01, ***p < 0.001, ****p < 0.0001. Source data are provided as a Source Data File.
Fig. 5
Fig. 5. pSer:alum-mediated antigen delivery and SMNP adjuvant promote non-base-binding Env-specificities.
a Antibody responses to the base of the trimer from serum at week 10, determined by cross-competition ELISA to 19R. Percentage of binding retained after addition of 19R is calculated by taking the AUC with 19R over the AUC without 19R. b Antibody responses to the base of the trimer, measured from serum at week 12. c Quantification of epitope sites on the Env trimer recognized using EMPEM, per animal group (out of 5 unique epitopes detected across all study groups), based on 3D maps presented in Supplementary Fig. 7a. d Total number of total epitope sites on the Env trimer recognized in EMPEM per animal, based on 3D maps presented in Supplementary Fig. 7a. e Flow cytometry gating of Env-specific (Env-AF647+Env-BV421+) and non-base-binding Env-specific (Env-AF647+Env-BV421+Env-bKO-PE+) memory B cells (BMem). f Frequency of Env-binding (Env+) cells as a percentage of total B cells. g Frequency of non-base-binding (Env+Env-bKO+) BMem cells as a percentage of total B cells. EMPEM data (Fig. 5c-d) from Group 1, alum, have been previously published. For Fig. 5a, b, f, g, n = 6 per group. Statistical significance for cross-competition ELISAs (a-b) was tested using Ordinary one-way ANOVA with Tukey’s multiple comparisons test. Statistical significance for EMPEM and BMem cell frequency (c-g) was tested using either unpaired two-tailed Mann-Whitney tests or Kruskal-Wallis test with Dunn’s multiple comparisons test, depending on the objectives of the study. *p < 0.05, **p < 0.01, ***p < 0.001, ****p < 0.0001. Source data are provided as a Source Data File.
Fig. 6
Fig. 6. BCR sequencing of Env-binding B cells.
a Flow cytometry gating of Env-binding B cells (Env-AF647+Env-BV421+) sorted for VDJ BCR sequencing. b The number of nucleotide heavy chain (HC) mutations over time of class-switched sequences. The percentage of unmutated sequences is calculated by taking the number of sequences with 0 nucleotide HC mutations over the number of total sequences. c The makeup of class-switched immunoglobulin (Ig) isotypes at week 6. d The makeup of class-switched Ig isotypes at week 13. e The makeup of class-switched Ig isotypes at week 27. f Clonal abundance curves of Env-binding B cells for each immunization group at week 6. For clonal abundance analysis (f), samples were excluded if fewer than 50 sequences were recovered. For Fig. 6a–f, sequences were collected from 12 samples (L and R LN, 6 animals per group). Source data are provided as a Source Data File.

Similar articles

Cited by

References

    1. Plotkin SA. Correlates of protection induced by vaccination▿. Clin. Vaccin. Immunol. 2010;17:1055–1065. doi: 10.1128/CVI.00131-10. - DOI - PMC - PubMed
    1. Burton DR, Hangartner L. Broadly neutralizing antibodies to HIV and their role in vaccine design. Annu Rev. Immunol. 2016;34:635–659. doi: 10.1146/annurev-immunol-041015-055515. - DOI - PMC - PubMed
    1. Victora GD, Nussenzweig MC. Germinal Centers. Annu Rev. Immunol. 2022;40:1–30. doi: 10.1146/annurev-immunol-120419-022408. - DOI - PubMed
    1. Crotty S. T follicular helper cell biology: a decade of discovery and diseases. Immunity. 2019;50:1132–1148. doi: 10.1016/j.immuni.2019.04.011. - DOI - PMC - PubMed
    1. Pulendran B, Arunachalam PS, O’Hagan DT. Emerging concepts in the science of vaccine adjuvants. Nat. Rev. Drug Discov. 2021;20:454–475. doi: 10.1038/s41573-021-00163-y. - DOI - PMC - PubMed

Publication types