

Baseline markers of cortical excitation and inhibition predict response to theta burst stimulation treatment for youth depression
- PMID: 37925557
- PMCID: PMC10625527
- DOI: 10.1038/s41598-023-45107-1
Baseline markers of cortical excitation and inhibition predict response to theta burst stimulation treatment for youth depression
Abstract
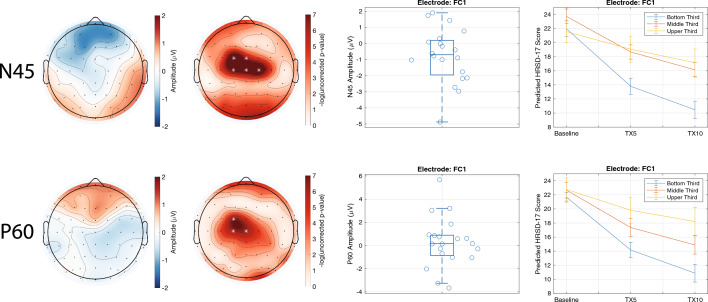
Theta burst stimulation (TBS), a specific form of repetitive transcranial magnetic stimulation (TMS), is a promising treatment for youth with Major Depressive Disorder (MDD) who do not respond to conventional therapies. However, given the variable response to TBS, a greater understanding of how baseline features relate to clinical response is needed to identify which patients are most likely to benefit from this treatment. In the current study, we sought to determine if baseline neurophysiology, specifically cortical excitation and/or inhibition, is associated with antidepressant response to TBS. In two independent open-label clinical trials, youth (aged 16-24 years old) with MDD underwent bilateral dorsolateral prefrontal cortex (DLPFC) TBS treatment. Clinical trial one and two consisted of 10 and 20 daily sessions of bilateral DLPFC TBS, respectively. At baseline, single-pulse TMS combined with electroencephalography was used to assess the neurophysiology of 4 cortical sites: bilateral DLPFC and inferior parietal lobule. Measures of cortical excitation and inhibition were indexed by TMS-evoked potentials (i.e., P30, N45, P60, N100, and P200). Depression severity was measured before, during and after treatment completion using the Hamilton Rating Scale for Depression-17. In both clinical trials, the baseline left DLPFC N45 and P60, which are believed to reflect inhibitory and excitatory mechanisms respectively, were predictors of clinical response. Specifically, greater (i.e., more negative) N45 and smaller P60 baseline values were associated with greater treatment response to TBS. Accordingly, cortical excitation and inhibition circuitry of the left DLPFC may have value as a TBS treatment response biomarker for youth with MDD.Clinical trial 1 registration number: NCT02472470 (June 15, 2015).Clinical trial 2 registration number: NCT03708172 (October 17, 2018).
© 2023. The Author(s).
Conflict of interest statement
P.E.C. has received research grant support from Pfizer, Inc., Neosync, Inc., and Neuronetics, Inc. He has received equipment support from Neuronetics, Inc. and MagVenture, Inc. for investigator-initiated studies. P.E.C. has served as a consultant for Procter & Gamble Company, Myriad Neuroscience, Sunovion, and Engrail Therapeutics. D.M.B. has received in-kind equipment support for investigator-initiated studies from Magventure, he has received research support and in-kind equipment support for an investigator-initiated study from Brainsway and is the site principal investigator for three sponsor-initiated studies for Brainsway; he has received medication supplies for an investigator-initiated trial from Indivior; and he has participated on an advisory board for Janssen. Z.J.D. has received research and equipment in-kind support for an investigator-initiated study through Brainsway Inc. and Magventure Inc. P.D., S.M. and F.F. report no biomedical financial interests or potential conflicts of interest.
Figures

Similar articles
-
Neurophysiological markers of response to theta burst stimulation in youth depression.Depress Anxiety. 2021 Feb;38(2):172-184. doi: 10.1002/da.23100. Epub 2020 Oct 1. Depress Anxiety. 2021. PMID: 33001549 Free PMC article.
-
Altered Transcranial Magnetic Stimulation-Electroencephalographic Markers of Inhibition and Excitation in the Dorsolateral Prefrontal Cortex in Major Depressive Disorder.Biol Psychiatry. 2019 Mar 15;85(6):477-486. doi: 10.1016/j.biopsych.2018.09.032. Epub 2018 Oct 18. Biol Psychiatry. 2019. PMID: 30503506 Clinical Trial.
-
Feasibility and clinical effects of theta burst stimulation in youth with major depressive disorders: An open-label trial.J Affect Disord. 2019 Nov 1;258:66-73. doi: 10.1016/j.jad.2019.07.084. Epub 2019 Jul 30. J Affect Disord. 2019. PMID: 31398593
-
Theta-burst stimulation: a new form of TMS treatment for depression?Depress Anxiety. 2015 Mar;32(3):182-92. doi: 10.1002/da.22335. Epub 2014 Nov 28. Depress Anxiety. 2015. PMID: 25450537 Review.
-
Bilateral theta burst stimulation for patients with acute unipolar or bipolar depressive episodes: A systematic review of randomized controlled studies.J Affect Disord. 2023 Nov 1;340:575-582. doi: 10.1016/j.jad.2023.08.065. Epub 2023 Aug 12. J Affect Disord. 2023. PMID: 37579881
Cited by
-
Neurophysiological markers of disease severity and cognitive dysfunction in major depressive disorder: A TMS-EEG study.Int J Clin Health Psychol. 2024 Jul-Sep;24(3):100495. doi: 10.1016/j.ijchp.2024.100495. Epub 2024 Aug 30. Int J Clin Health Psychol. 2024. PMID: 39282218 Free PMC article.
-
A naturalistic analysis of rTMS treatment outcomes for major depressive disorder in West Australian youth.Front Psychiatry. 2025 Mar 4;16:1513339. doi: 10.3389/fpsyt.2025.1513339. eCollection 2025. Front Psychiatry. 2025. PMID: 40104331 Free PMC article.
-
A Multisite, 6-Month, Open-Label Study of Maintenance Transcranial Magnetic Stimulation for Adolescents with Treatment-Resistant Depression.J Child Adolesc Psychopharmacol. 2025 Mar;35(2):99-108. doi: 10.1089/cap.2024.0067. Epub 2024 Dec 26. J Child Adolesc Psychopharmacol. 2025. PMID: 39718805 Clinical Trial.
References
-
- MacQueen GM, et al. Canadian network for mood and anxiety treatments (CANMAT) 2016 clinical guidelines for the management of adults with major depressive disorder: Section 6. Special populations: Youth, women, and the elderly. Can. J. Psychiatry. 2016;61:588–603. doi: 10.1177/0706743716659276. - DOI - PMC - PubMed
Publication types
MeSH terms
Associated data
Grants and funding
LinkOut - more resources
Full Text Sources
Medical
