. 2023 Nov 4;13(1):19068.
doi: 10.1038/s41598-023-46472-7.

Improved artificial intelligence discrimination of minor histological populations by supplementing with color-adjusted images

Affiliations

Improved artificial intelligence discrimination of minor histological populations by supplementing with color-adjusted images

Satomi Hatta et al. Sci Rep. .

Abstract

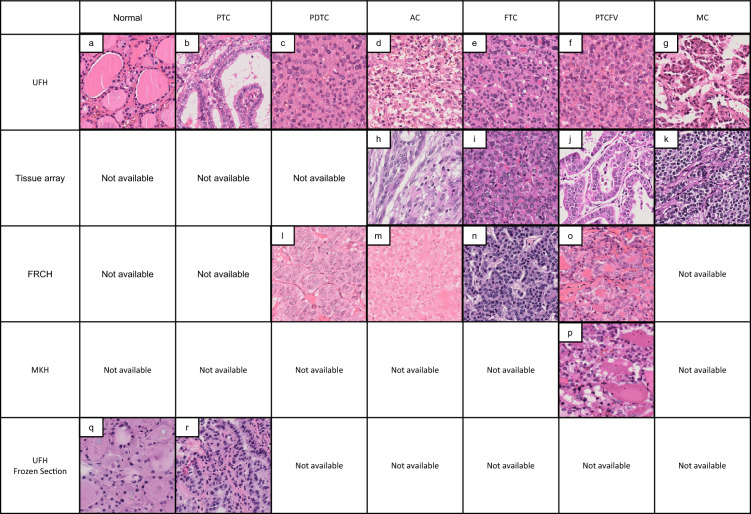
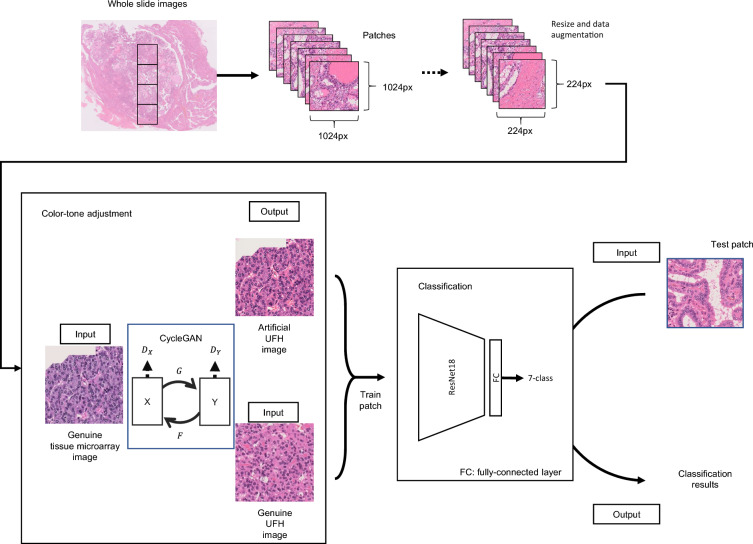
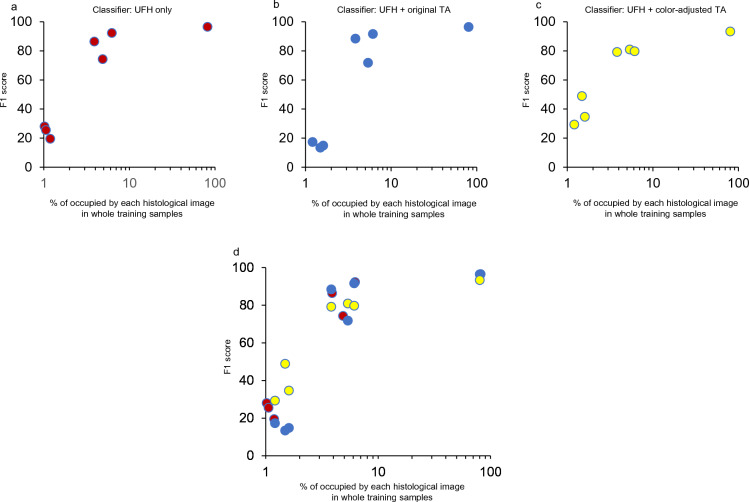
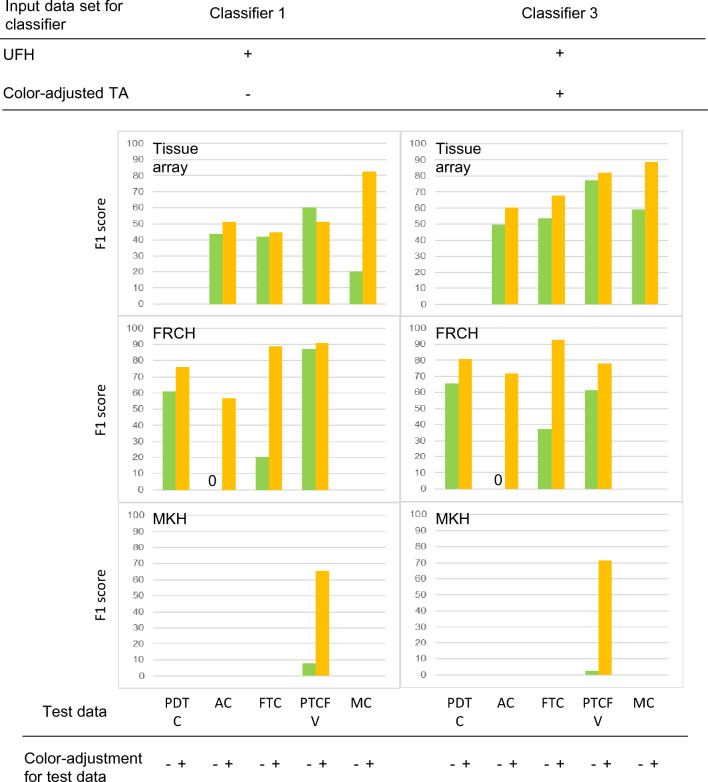
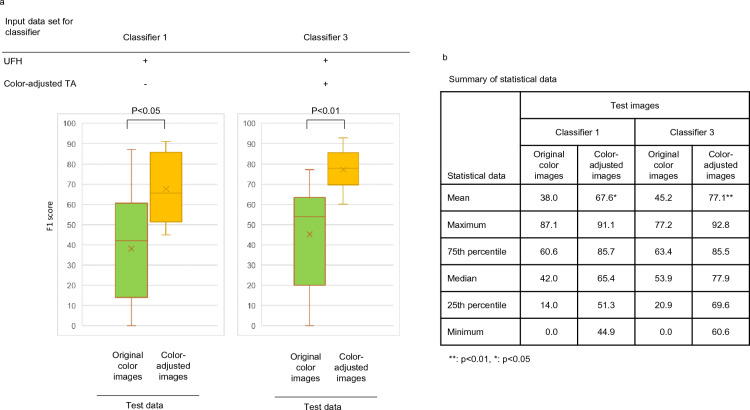
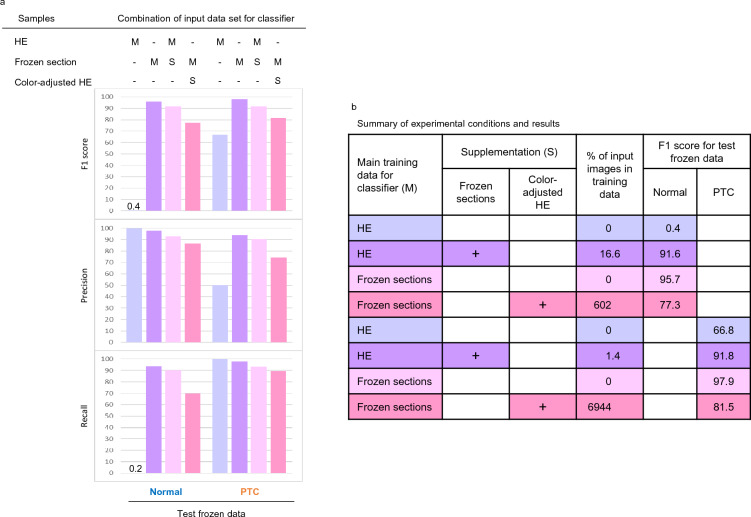
Despite the dedicated research of artificial intelligence (AI) for pathological images, the construction of AI applicable to histopathological tissue subtypes, is limited by insufficient dataset collection owing to disease infrequency. Here, we present a solution involving the addition of supplemental tissue array (TA) images that are adjusted to the tonality of the main data using a cycle-consistent generative adversarial network (CycleGAN) to the training data for rare tissue types. F1 scores of rare tissue types that constitute < 1.2% of the training data were significantly increased by improving recall values after adding color-adjusted TA images constituting < 0.65% of total training patches. The detector also enabled the equivalent discrimination of clinical images from two distinct hospitals and the capability was more increased following color-correction of test data before AI identification (F1 score from 45.2 ± 27.1 to 77.1 ± 10.3, p < 0.01). These methods also classified intraoperative frozen sections, while excessive supplementation paradoxically decreased F1 scores. These results identify strategies for building an AI that preserves the imbalance between training data with large differences in actual disease frequencies, which is important for constructing AI for practical histopathological classification.


Conflict of interest statement

The authors declare no competing interests.

Figures

Figure 1
Figure 1
Representative histological images of thyroid cancer tissues from different sources. This is a representative image of HE specimens from each institution. Even with the same tissue type, the appearance differs depending on the difference in staining. AC, anaplastic carcinoma; FRCH, Japanese Red Cross Fukui Hospital; FS, frozen section; FTC, follicular thyroid carcinoma; MC, medullary carcinoma; MKH, Maizuru Kyosai Hospital; PDTC, poorly differentiated thyroid carcinoma; PTC, papillary thyroid carcinoma; PTCFV, papillary thyroid carcinoma, follicular variant; TA, tissue microarray; UFH, University of Fukui Hospital.
Figure 2
Figure 2
Schematic model for the color-tone adjustment using CycleGAN and the construction of the classifier using ResNet18. Tumor lesions in whole slide images were manually annotated by pathologists and the images were subsequently exported and cropped into patches. Resize and data augmentation were applied to the patches and the patches were used to train CycleGAN. The ResNet18-based classifier was trained on the patch images including color-tone adjusted images. In CycleGAN, four neural networks were used: generators G and F, and discriminators Dx and Dy. In this study, X and Y represent the tissue microarray image domain and the UFH image domain, respectively. Abbreviations: G, a generator that transforms X to Y; F, a generator that transforms Y to X; Dx, a discriminator that discriminates X from F(Y); Dy, a discriminator that discriminates Y from G(X). Abbreviations: TA, tissue array; UFH, University of Fukui Hospital.
Figure 3
Figure 3
Discriminative effects of supplementing with color-adjusted TA images on original UFH images. (a) F1 score, precision, and recall for each tissue subtype. Three different conditions of classifiers are shown below the bar chart. Classifiers 1, 2, and 3 are represented by the blue, orange, and grey bars, respectively. (b) Boxplot summaries among the tissue subtypes. The left column shows the boxplot summaries of F1 score, precision, and recall from all tissue subtypes. The middle and left columns present the detailed results stratified into Normal, PTC to PDTC data, and AC, FTC, PTCFV to MC data, respectively. AC, anaplastic carcinoma; FTC, follicular thyroid carcinoma; MC, medullary carcinoma; PDTC, poorly differentiated thyroid carcinoma; PTC, papillary thyroid carcinoma; PTCFV, papillary thyroid carcinoma, follicular variant; TA, tissue array. *p < 0.05.
Figure 4
Figure 4
The relationship between F1 score and the percentage occupied by each histological subtype. The F1 scores for the three discriminators were plotted in (ac), and the overlaid image is shown in (d). TA, tissue microarray; UFH, University of Fukui Hospital.
Figure 5
Figure 5
Effect of color-tone adjustments of both training and test data on F1 scores in a small number of clinical images. The F1 scores of minor tissue types of TA and two clinical hospitals (FRCH and MKH) were classified in the presence or absence of color-tone adjustment of both training and test data. Abbreviations: AC, anaplastic carcinoma; FRCH, Japanese Red Cross Fukui Hospital; FTC, follicular thyroid carcinoma; MC, medullary carcinoma; MKH, Maizuru Kyosai Hospital; PDTC, poorly differentiated thyroid carcinoma; PTCFV, papillary thyroid carcinoma, follicular variant; TA, tissue microarray; UFH, University of Fukui Hospital.
Figure 6
Figure 6
Changes in F1 score of color-tone adjustments in the presence or absence of both training and test data in a small number of clinical images. Box plots and their raw statistical data are shown in (a) and (b), respectively. TA, tissue microarray; UFH, University of Fukui Hospital.
Figure 7
Figure 7
Adaptation of color-tone adjustment for the images derived from intraoperative frozen tissue sections. (a) F1 score, precision, and recall of Normal and PTC frozen images by each classifier. (b) Summary of experimental conditions and the respective F1 scores. Abbreviations: HE, hematoxylin and eosin; M, main training data; PTC, papillary thyroid carcinoma; S, supplementation.

References

    1. Shen D, Wu G, Suk HI. Deep learning in medical image analysis. Annu. Rev. Biomed. Eng. 2017;19:221–248. doi: 10.1146/annurev-bioeng-071516-044442. - DOI - PMC - PubMed
    1. Tamai N, et al. Effectiveness of computer-aided diagnosis of colorectal lesions using novel software for magnifying narrow-band imaging: A pilot study. Endosc. Int. Open. 2017;5:E690–E694. doi: 10.1055/s-0043-105490. - DOI - PMC - PubMed
    1. Szczykutowicz TP, Toia GV, Dhanantwari A, Nett B. A review of deep learning CT reconstruction: Concepts, limitations, and promise in clinical practice. Curr. Radiol. Rep. 2022;10:101–115. doi: 10.1007/s40134-022-00399-5. - DOI
    1. Zeng G, et al. A review on deep learning MRI reconstruction without fully sampled k-space. BMC Med. Imaging. 2021;21:195. doi: 10.1186/s12880-021-00727-9. - DOI - PMC - PubMed
    1. Kido S, et al. Segmentation of lung nodules on CT Images using a nested three-dimensional fully connected convolutional network. Front. Artif. Intell. 2022;5:782225. doi: 10.3389/frai.2022.782225. - DOI - PMC - PubMed

Publication types