. 2023 Nov 28;42(11):113392.
doi: 10.1016/j.celrep.2023.113392. Epub 2023 Nov 4.

Integrative multi-omic profiling of adult mouse brain endothelial cells and potential implications in Alzheimer's disease

Affiliations

Integrative multi-omic profiling of adult mouse brain endothelial cells and potential implications in Alzheimer's disease

Min Yu et al. Cell Rep. .

Abstract

The blood-brain barrier (BBB) is primarily manifested by a variety of physiological properties of brain endothelial cells (ECs), but the molecular foundation for these properties remains incompletely clear. Here, we generate a comprehensive molecular atlas of adult brain ECs using acutely purified mouse ECs and integrated multi-omics. Using RNA sequencing (RNA-seq) and proteomics, we identify the transcripts and proteins selectively enriched in brain ECs and demonstrate that they are partially correlated. Using single-cell RNA-seq, we dissect the molecular basis of functional heterogeneity of brain ECs. Using integrative epigenomics and transcriptomics, we determine that TCF/LEF, SOX, and ETS families are top-ranked transcription factors regulating the BBB. We then validate the identified brain-EC-enriched proteins and transcription factors in normal mouse and human brain tissue and assess their expression changes in mice with Alzheimer's disease. Overall, we present a valuable resource with broad implications for regulation of the BBB and treatment of neurological disorders.

Keywords: Alzheimer's disease; CP: Neuroscience; blood-brain barrier; endothelial cells; multi-omics; proteomics.


Conflict of interest statement

Declaration of interests C.J.K. is a founder and advisor of Surrozen, Inc., Mozart Therapeutics, and NextVivo, Inc. H.Y.C. is a co-founder of Accent Therapeutics, Boundless Bio, and Cartography Biosciences and is an advisor to 10× Genomics, Arsenal Biosciences, and Spring Discovery.

Figures
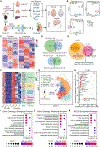
Figure 1.
Figure 1.. Integrative transcriptomics and proteomics analysis identified the transcripts and proteins enriched in adult mouse brain endothelial cells
(A) Work flow of the study. Acutely purified endothelial cells (ECs) were subjected to bulk RNA-seq, to data-independent acquisition-mass spectrometry (DIA-MS), and to ATAC-seq. Brain ECs were additionally subjected to 10× single-cell RNA-seq (scRNA-seq). (B) Principal-component analysis (PCA) of bulk RNA-seq, DIA-MS proteomics, and ATAC-seq. BR, brain; LG, lung; LV, liver. Bulk RNA-seq, n = 3 replicates, one mouse/replicate; DIA-MS, n = 2 replicates, 13–14 pooled mice/replicate; ATAC-seq, n = 3–4 replicates, one mouse/replicate. (C) Differentially expressed genes (DEGs) in brain (BR_EC), lung (LG_EC), and liver (LV_EC) ECs identified by RNA-seq and proteomics, respectively. (D) Venn diagrams showing the number of gene transcripts and proteins selectively enriched in brain ECs relative to lung or liver ECs identified by RNA-seq (FC > 2, p.adj < 0.001) and proteomics (FC > 1.4, p < 0.05), respectively. (E) Venn diagram showing the number of genes that are enriched in brain ECs at both the transcript and protein levels. (F) Heatmaps depicting genes (RP_23) that are enriched in mouse brain ECs at both transcript and protein levels. Genes are classified according to their reported main functions. RNA-seq, n = 3, one mouse/replicate; proteomics, n = 2, 13–14 pooled mice/replicate. (G) UMAP plot visualization of 8,088 single-cell transcriptomes of acutely purified mouse brain ECs. ECs from three different mice were pooled together. C_A, capillary-arterial; C_V, capillary-venous; ChP/CVO, choroid plexus/circumventricular organ. (H) Expressions of adult mouse brain-EC-enriched transcripts (R_221) in the capillary EC subcluster. 162 transcripts (R_162) were expressed in at least 10% (precents [PCTs]) of the capillary ECs and are shown in red. RP_23 genes are highlighted with names. (I–K) GO and KEGG enrichment analysis of the BBB transcript module R_162 and protein module P_78. Terms were ranked based on gene counts.
Figure 2.
Figure 2.. Single-cell transcriptomic profiling of the heterogeneity of adult mouse brain ECs
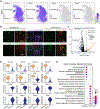
(A) UMAP for the expression of the BBB EC markers (Slc2a1, Cldn5) and the non-BBB ChP/CVO EC markers (Plvap, Plpp3). (B) Representative immunofluorescence staining images for the BBB EC marker GLUT-1, the ChP/CVO EC marker PLVAP, and the EC marker CD31. Scale bar = 100 μm. (C) Volcano plots displaying the DEGs (p.adj < 0.05, |log2(FC)| > 1) between brain capillary ECs and ChP/CVO ECs. (D) Violin plots showing the expression levels of representative marker genes in brain capillary ECs (top) and in ChP/CVO ECs (bottom). (E) Gene Ontology (GO) enrichment analysis showing the representative biological processes and pathways of the DEGs from (C). The most representative term is shown for sets of genes enriched in several similar terms. Terms are ranked based on gene counts.
Figure 3.
Figure 3.. Epigenomics analysis identified transcription factors enriched in adult mouse brain ECs and their putative targets
(A) Differential open chromatin regions (peaks) in brain (BR_EC), lung (LG_EC), and liver (LV_EC) ECs. (B) The ATAC-seq signal enrichment around the transcription start site (TSS) of the genes in the BBB transcript module R_162 in brain, lung, and liver ECs. (C) Transcription factor (TF) motif enrichment in brain-EC-specific ATAC-seq peaks shown in (A). The x axis: rank of enrichment p value (−log10(p value)). The y axis: enrichment score. (D) Heatmaps depicting the transcript levels for the TCF/LEF, SOX, and ETS gene families. Only genes with an average RPKM >1 are shown. (E) The ATAC-seq signal enrichment around the peaks associated with the LEF1, SOX17, or ERG motifs in brain, lung, and liver ECs, respectively. (F) Venn diagram comparing the putative target genes of brain-EC-enriched TFs (LEF1, SOX17) and pan-EC TF ERG and genes in the brain-EC-enriched transcript module R_162. (G) Co-immunofluorescence staining of brain-EC-enriched TFs (LEF1, SOX17) and pan-EC TF ERG with the EC marker CD31 in adult mouse tissues (cerebral cortex). Low-magnification scale bar = 50 μm and high-magnification scale bar = 10 μm.
Figure 4.
Figure 4.. Validation of mouse brain-EC-enriched proteins (P_78) in adult mice
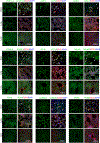
The tissue specificity of representative proteins enriched in mouse brain ECs was validated by co-immunofluorescence staining with the EC marker CD31 in adult mouse brain (cerebral cortex), lung, and liver tissue sections, respectively. Arrows indicate vessels with positive staining signals for the target proteins. Scale bar = 100 μm.
Figure 5.
Figure 5.. Vascular location of brain-EC-enriched proteins in adult mouse brain
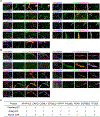
(A and B) The capillary expression levels and specificity of the identified brain-EC-enriched proteins were determined by co-immunofluorescence staining with the EC marker CD31, the arterial/arteriolar smooth muscle marker ACTA2 (A), or the mural cell marker PDGFRβ (B) in adult mouse brain tissue (cerebral cortex). A, arteriole; C, capillary. Low-magnification scale bar = 20 μm, except for TPD52 where the scale bar represents 50 μm. (C) Summary of the staining results.
Figure 6.
Figure 6.. Identification of mouse brain-EC-enriched proteins and TFs in adult human brain
(A) The protein levels of adult mouse brain-EC-enriched proteins (AFAP1L2, CGNL1, IGF1R, PALMD, PDXK, TPD52), brain-EC-enriched TFs (LEF1, SOX17), and the pan-EC TF ERG in adult human brain tissue were determined by immunohistochemistry (IHC) staining. Images and annotations are from the Human Protein Atlas database (https://www.proteinatlas.org/). Representative IHC images and antibody codes are shown for cerebral cortex, liver, and lung tissues. Scale bar = 100 μm. (B) The capillary expression and EC specificity of brain-EC-enriched proteins and TFs were further determined by co-immunofluorescence staining with the EC marker CD31 or the arterial/arteriolar smooth muscle marker ACTA2 in adult normal human brain sections (cerebral cortex). A, arteriole; C, capillary. Scale bar = 50 μm for brain-EC-enrichment proteins; scale bar = 20 μm for brain-EC-enrichment TFs.
Figure 7.
Figure 7.. Changes of mouse brain-EC-enriched proteins and TFs in Alzheimer’s disease
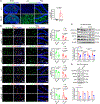
(A) Immunofluorescence staining and quantification of amyloid-β accumulation in the cerebral cortex (Ctx) and hippocampus (Hipp) of wild-type (WT) or 5xFAD mice (9 months old, male), respectively. Low-magnification scale bar = 100 μm and high-magnification scale bar = 50. Unpaired Student’s t test. Each data point represents an individual mouse. n = 5 mice for WT, n = 4 mice for 5xFAD. Error bars represent mean ± SEM. P values are labeled on top of each bar graph. (B) Immunofluorescence staining and quantification of representative brain-EC-enriched proteins (AFAP1L2, EPS8L2, IGF1R) and TF LEF1 in WT or 5xFAD mice. Unpaired Student’s t test. Each data point represents an individual mouse. n = 5 mice for WT, n = 4 mice for 5xFAD. Error bars represent mean ± SEM. P values are labeled on top of each bar graph. (C and D) Western blotting and quantification of brain-EC-enriched proteins (AFAP1L2, EPS8L2, IGF1R) and TF LEF1 in the cortex microvessels (n = 3 replicates, 3–4 mice were pooled per replicate) (C) and hippocampus microvessels (n = 1 replicate, 10 mice were pooled together) (D) of WT or 5xFAD mice (9 months old, male). Error bars represent mean ± SEM. P values are labeled on top of each bar graph.

References

    1. Profaci CP, Munji RN, Pulido RS, and Daneman R (2020). The blood-brain barrier in health and disease: Important unanswered questions. J. Exp. Med. 217, e20190062. 10.1084/jem.20190062. - DOI - PMC - PubMed
    1. Zhao Z, Nelson AR, Betsholtz C, and Zlokovic BV (2015). Establishment and Dysfunction of the Blood-Brain Barrier. Cell 163, 1064–1078. 10.1016/j.cell.2015.10.067. - DOI - PMC - PubMed
    1. Kaplan L, Chow BW, and Gu C (2020). Neuronal regulation of the blood-brain barrier and neurovascular coupling. Nat. Rev. Neurosci. 21, 416–432. 10.1038/s41583-020-0322-2. - DOI - PMC - PubMed
    1. Liebner S, Dijkhuizen RM, Reiss Y, Plate KH, Agalliu D, and Constantin G (2018). Functional morphology of the blood-brain barrier in health and disease. Acta Neuropathol. 135, 311–336. 10.1007/s00401-018-1815-1. - DOI - PMC - PubMed
    1. Pandit R, Chen L, and Götz J (2020). The blood-brain barrier: Physiology and strategies for drug delivery. Adv. Drug Deliv. Rev. 165–166, 1–14. 10.1016/j.addr.2019.11.009. - DOI - PubMed

Publication types

Substances