. 2023 Nov 28;42(11):113389.
doi: 10.1016/j.celrep.2023.113389. Epub 2023 Nov 4.

Hepatic palmitoyl-proteomes and acyl-protein thioesterase protein proximity networks link lipid modification and mitochondria

Affiliations

Hepatic palmitoyl-proteomes and acyl-protein thioesterase protein proximity networks link lipid modification and mitochondria

Sarah L Speck et al. Cell Rep. .

Abstract

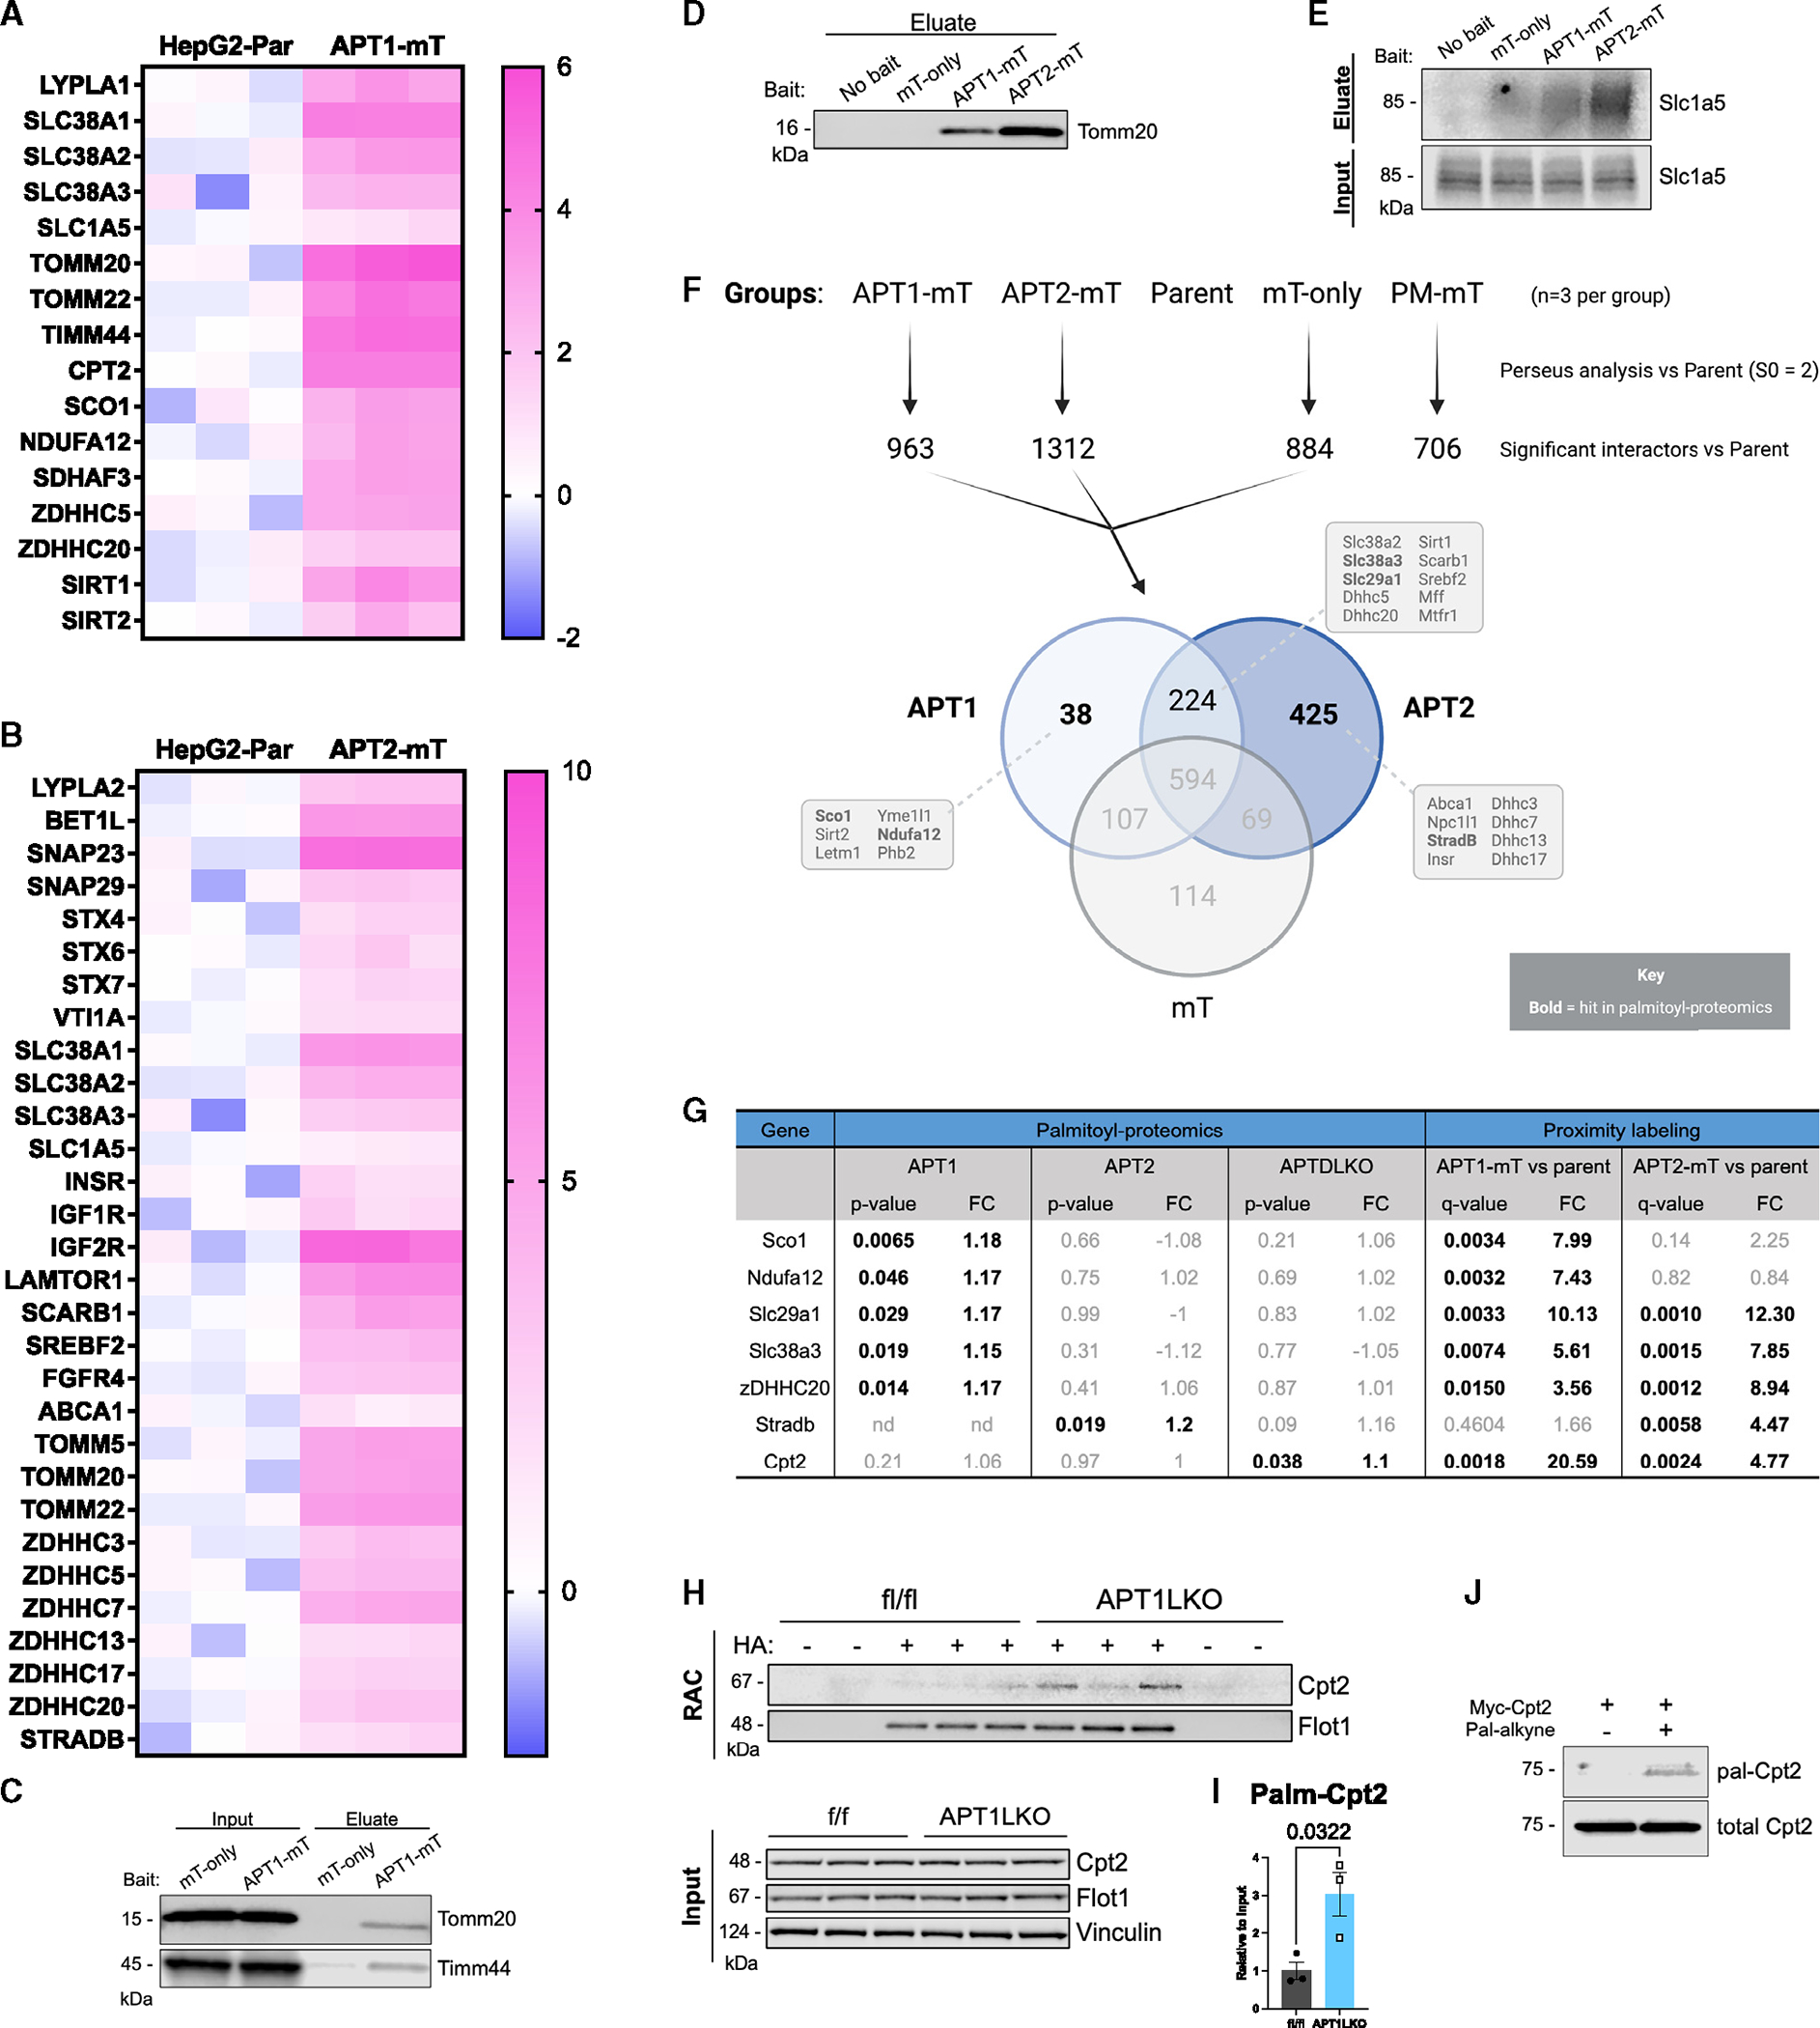
Acyl-protein thioesterases 1 and 2 (APT1 and APT2) reverse S-acylation, a potential regulator of systemic glucose metabolism in mammals. Palmitoylation proteomics in liver-specific knockout mice shows that APT1 predominates over APT2, primarily depalmitoylating mitochondrial proteins, including proteins linked to glutamine metabolism. miniTurbo-facilitated determination of the protein-protein proximity network of APT1 and APT2 in HepG2 cells reveals APT proximity networks encompassing mitochondrial proteins including the major translocases Tomm20 and Timm44. APT1 also interacts with Slc1a5 (ASCT2), the only glutamine transporter known to localize to mitochondria. High-fat-diet-fed male mice with dual (but not single) hepatic deletion of APT1 and APT2 have insulin resistance, fasting hyperglycemia, increased glutamine-driven gluconeogenesis, and decreased liver mass. These data suggest that APT1 and APT2 regulation of hepatic glucose metabolism and insulin signaling is functionally redundant. Identification of substrates and protein-protein proximity networks for APT1 and APT2 establishes a framework for defining mechanisms underlying metabolic disease.

Keywords: CP: Metabolism; acyl-protein thioesterase 1; acyl-protein thioesterase 2; gluconeogenesis; glutamine; insulin; liver; palmitoylation; proximity labeling.


Conflict of interest statement

Declaration of interests The authors declare no competing interests.

Figures

Figure 1.
Figure 1.. Characterization of the APT1 and APT2 palmitoyl-proteomes in the murine liver
(A) Schematic of acyl resin-assisted capture (RAC) assay prior to MS analysis. Proteins were isolated from the livers of male mice fed a HFD for 3 months. Mice with single or dual deletion of APT1 and/or APT2 (APT1LKO, APT2LKO, or APTDLKO) were compared to floxed littermate controls. Results of analysis are depicted in (B)–(D) and Table S1. (B–D) Volcano plots of palmitoyl-proteomics analysis from (B) APT1LKO, (C) APT2LKO, or (D) APTDLKO versus floxed controls. Red dots indicate proteins with increased palmitoylation in KO mice based on our low-stringency analysis (unadjusted p < 0.05, ≥2 unique peptides, fold change ≥ 1.1). Squares indicate proteins of interest for further study. See also Table S1.
Figure 2.
Figure 2.. Combinatorial analysis of APT1 and APT2 palmitoyl-proteomes in the murine liver
(A) Schematic depicting that HA + MS data were combined to compare floxed controls to APT-deficient mice (n = 6 per group). Results of combinatorial analysis are shown in (B)–(D) and Table S2. (B and C) Volcano plots of combinatorial Fix analysis from (B) APT1LKO and APTDLKO or (C) APT2LKO and APTDLKO mouse livers versus floxed controls. Red dots indicate proteins with increased palmitoylation in KO based on medium-stringency analysis (Tables S2B and S2E, unadjusted p < 0.01, ≥2 unique peptides, fold change ≥ 1.1). (D) Top GO annotations for proteins that had increased palmitoylation in APT1LKO/APTDLKO Fix analysis based on high-stringency analysis (adjusted p < 0.05, ≥2 unique peptides, fold change ≥ 1.1). (E) Western blot (WB) validation of palmitoyl-proteomics data in APT1-floxed male mice on chow diet for 6 months. Acyl-RAC was used to pull down palmitoylated proteins prior to elution and WB. (F) Quantification of Hmgcl RAC protein intensities in (E) relative to input. Results are shown as mean ± SEM (n = 3 mice) with p value from unpaired t test. (G) 293T cells were transfected with myc-Hmgcl and then metabolically labeled with palmitate analog pal-alkyne for 2h. Myc-Hmgcl was immunoprecipitated and click labeled by azide-conjugated biotin. Labeled Hmgcl was detected by WB. (H) 293T cells stably expressing control (mScarlet only) or APT1 (mScarlet-APT1) were transfected with myc-Hmgcl and then metabolically labeled with palmitate analog pal-alkyne for 30 min followed by 1, 2, or 4 h chase. Palmitoylated Hmgcl was click labeled by azide-biotin probe and detected by streptavidin. APT1 overexpression was confirmed (bottom). (I) Quantitation of pulse chase. Results are shown as mean ± SEM (n = 3 independent experiments) with p value from two-way ANOVA. (J) WB of total liver lysate from overnight fasted male mice on HFD for 10 weeks. (K) Quantification of (J). Results are shown as mean ± SEM (n = 5 mice) with p value from unpaired t test. See also Table S2.
Figure 3.
Figure 3.. Proximity labeling assay to identify the interactomes of APT1 and APT2 in a liver cell model
(A) Schematic of generating protein proximity network for APT1 and APT2 using the biotin ligase miniTurbo (mT). (B) Schematic of expression vector containing a UBC promoter, APT1, or APT2 (gene names: Lypla1 and Lypla2), a V5 tag, an mT gene, puromycin resistance, and elements for lentiviral expression. APT protein was fused to mT at the C terminus. (C) Validation of bait expression and biotinylation activity in transduced cells. (D) 24 h incubation of cells in biotin-depleted media enhanced contrast in streptavidin signal between cell lines. (E) WB of input from samples used for streptavidin pull-down and proteomics analysis. (F) WB of proteins eluted from streptavidin agarose beads. See also Figure S1.
Figure 4.
Figure 4.. APT-mT interactomes and localization
(A) Volcano plot of APT1-mT prey relative to parental prey based on LFQ intensities. (B) Volcano plot of APT2-mT prey relative to parental prey based on LFQ intensities. Red proteins in (A) and (B) have increased labeling by the APT-mT construct based on a Perseus analysis with S0 = 2. Cyan- or blue-labeled proteins in (A) and (B) are proteins of interest for future study. (C) Principal-component analysis of LFQ intensities from mT MS data. (D) Confocal microscopy of mT-expressing HepG2 cells. V5: tag for mT constructs. Tomm20: mitochondrial marker. Hoechst: nuclear marker. Scale bars: 10 μm (top) and 2 μm (bottom). See also Figure S2 and Table S3.
Figure 5.
Figure 5.. Characterization of the APT1 and APT2 interactome in a liver cell model
(A and B) Heatmaps of selected interactors in APT1-mT (A) or APT2-mT (B) versus parental control (n = 3 per group). Color intensity indicates log2 fold change (log2FC). (C and D) WB validation of mitochondrial protein transporters that interact with APT1-mT and APT2-mT. (E) WB validation of APT interactor Slc1a5, a plasma membrane and mitochondrial glutamine transporter. (F) Venn diagram depicting significant interactors for APT1, APT2, and cytoplasmic control mT-only relative to parental control (n = 3 per group) based on Perseus analysis. Selected interactors are indicated in boxes, and bolded interactors were hits in the palmitoyl-proteomics analysis. (G) Table comparing proteomics results of higher-confidence APT substrates. Bolded genes had unadjusted p <0.05. (H and I) Acyl-RAC on livers from APT1-floxed male mice on chow diet demonstrated that APT1 depalmitoylates Cpt2. (H) WB of acyl-RAC samples. RAC: eluted protein. (I) Quantification of WB in (H). Results are shown as mean ± SEM (n = 3 mice) with p value from unpaired t test. (J) Metabolic labeling of myc-Cpt2 with palmitic alkyne in 293T cells, followed by click chemistry with azide biotin and WB.
Figure 6.
Figure 6.. Glucose and insulin tolerance in liver-specific APT1, APT2, and double-LKO male mice
Mice were fasted for 4–6 h prior to glucose tolerance testing (GTT; 1 g/kg) or insulin tolerance testing (ITT; 0.75 U/kg). (A–F) APT1 (A and D), APT2 (B and E), and dual APT1/APT2 (C and F) deficiency in the liver did not affect glucose tolerance (A–C) or insulin sensitivity (D–F) in chow-fed mice. Single-KO mice on chow diet were tested at 20 weeks of age. Double-KO mice on chow were characterized at 12 weeks of age. (G–I) APT deficiency did not affect glucose tolerance in mice fed HFD. (J–L) Dual, but not single, APT deficiency impaired insulin sensitivity in mice fed HFD. (G–L) Single-KO mice were fed HFD for 12–13 weeks; dual-KO mice were fed HFD for 15–16 weeks (n = 5–12 per group). All results are shown as mean ± SEM with p value from unpaired t tests. See also Figure S3.
Figure 7.
Figure 7.. APTDLKO mice have increased overnight fasting glucose levels and glutamine-driven gluconeogenesis
(A) APTDLKO livers from male mice fed HFD for 10 weeks did not have altered p-Akt after injection with insulin. (B) APTDLKO mice on 18 weeks of HFD had increased overnight fasting glucose levels (n = 5–7). Results are shown as mean ± SEM with p value from unpaired t test. (C) qPCR data suggesting that APT-deficient mice did not have significantly altered mRNA expression of gluconeogenic or lipogenic enzymes. Results are shown as mean ± SEM (n = 5–7 mice) with no significance from unpaired t test. (D) APTDLKO mice on 6 months of HFD had increased glutamine-driven gluconeogenesis during a glutamine tolerance test (QTT; n = 4–7). Inset: area under the curve (AUC) analysis of QTT. Results are shown as mean ± SEM with p value from unpaired t test. (E) APTDLKO mice on HFD for 10 weeks did not have altered total protein expression of Slc1a5, Cpt2, or Taco1 in the liver. (F) APTDLKO mice on HFD for 9 months had decreased liver mass after an overnight fast. Results are shown as mean ± SEM with p value from unpaired t test. See also Figure S4.

References

    1. Kahn SE (2003). The relative contributions of insulin resistance and beta-cell dysfunction to the pathophysiology of Type 2 diabetes. Diabetologia 46, 3–19. 10.1007/s00125-002-1009-0. - DOI - PubMed
    1. Petersen MC, Vatner DF, and Shulman GI (2017). Regulation of hepatic glucose metabolism in health and disease. Nat. Rev. Endocrinol. 13, 572–587. 10.1038/nrendo.2017.80. - DOI - PMC - PubMed
    1. Roden M, Price TB, Perseghin G, Petersen KF, Rothman DL, Cline GW, and Shulman GI (1996). Mechanism of free fatty acid-induced insulin resistance in humans. J. Clin. Invest. 97, 2859–2865. 10.1172/JCI118742. - DOI - PMC - PubMed
    1. Yang Q, Vijayakumar A, and Kahn BB (2018). Metabolites as regulators of insulin sensitivity and metabolism. Nat. Rev. Mol. Cell Biol. 19, 654–672. 10.1038/s41580-018-0044-8. - DOI - PMC - PubMed
    1. Kashyap S, Belfort R, Gastaldelli A, Pratipanawatr T, Berria R, Pratipanawatr W, Bajaj M, Mandarino L, DeFronzo R, and Cusi K (2003). A sustained increase in plasma free fatty acids impairs insulin secretion in nondiabetic subjects genetically predisposed to develop type 2 diabetes. Diabetes 52, 2461–2474. 10.2337/diabetes.52.10.2461. - DOI - PubMed

Publication types