. 2023 Nov 6;11(1):59.
doi: 10.1038/s41413-023-00298-1.

Spatial transcriptomic interrogation of the murine bone marrow signaling landscape

Affiliations

Spatial transcriptomic interrogation of the murine bone marrow signaling landscape

Xue Xiao et al. Bone Res. .

Abstract

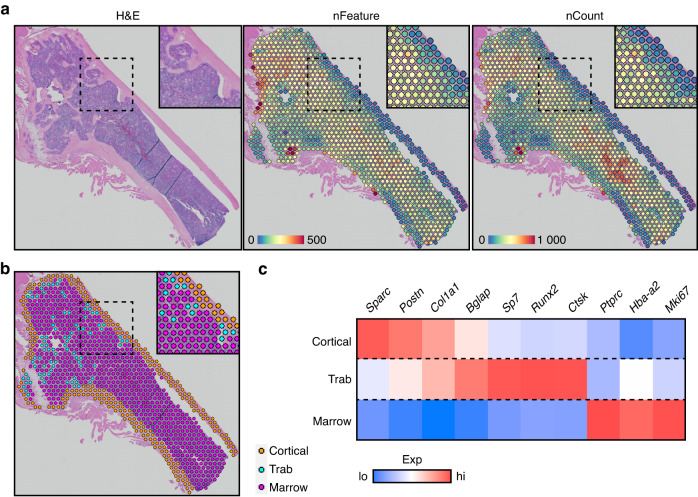
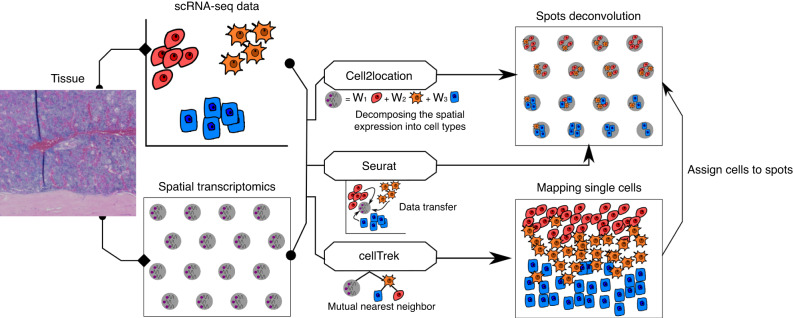
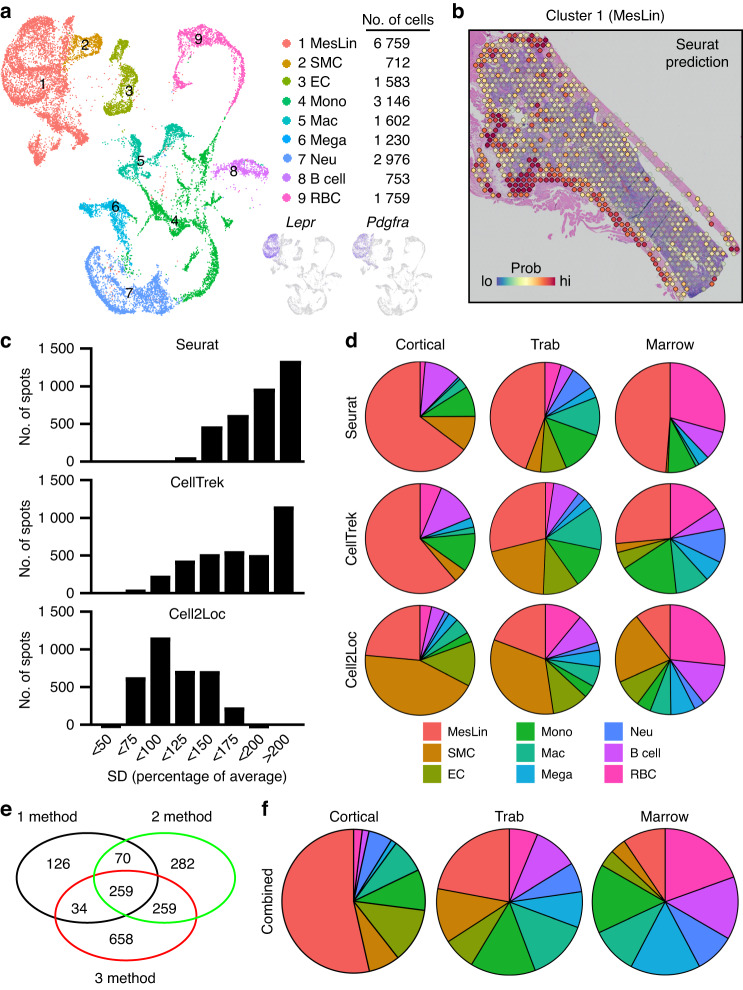
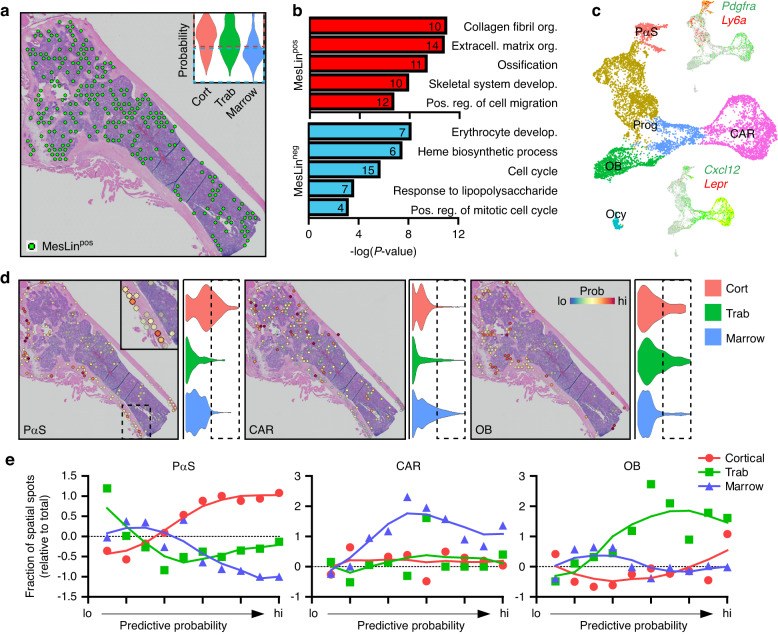
Self-renewal and differentiation of skeletal stem and progenitor cells (SSPCs) are tightly regulated processes, with SSPC dysregulation leading to progressive bone disease. While the application of single-cell RNA sequencing (scRNAseq) to the bone field has led to major advancements in our understanding of SSPC heterogeneity, stem cells are tightly regulated by their neighboring cells which comprise the bone marrow niche. However, unbiased interrogation of these cells at the transcriptional level within their native niche environment has been challenging. Here, we combined spatial transcriptomics and scRNAseq using a predictive modeling pipeline derived from multiple deconvolution packages in adult mouse femurs to provide an endogenous, in vivo context of SSPCs within the niche. This combined approach localized SSPC subtypes to specific regions of the bone and identified cellular components and signaling networks utilized within the niche. Furthermore, the use of spatial transcriptomics allowed us to identify spatially restricted activation of metabolic and major morphogenetic signaling gradients derived from the vasculature and bone surfaces that establish microdomains within the marrow cavity. Overall, we demonstrate, for the first time, the feasibility of applying spatial transcriptomics to fully mineralized tissue and present a combined spatial and single-cell transcriptomic approach to define the cellular components of the stem cell niche, identify cell‒cell communication, and ultimately gain a comprehensive understanding of local and global SSPC regulatory networks within calcified tissue.


Conflict of interest statement

Spatial data were generated in cooperation with 10x Genomics, the manufacturer of the Visium Spatial Gene Expression system.

Figures

Fig. 1
Fig. 1
Spatial transcriptomic analyses of adult femurs. a Spatial feature plots of H&E-stained sections overlaid with the number of unique genes (nFeature) or unique transcripts (nCount) per spatial spot. b Manual segmentation of cortical bone, trabecular bone, and bone marrow spatial spots by histological morphology. c Marker genes showing enriched expression within each segmented compartment
Fig. 2
Fig. 2
Spatial spot deconvolution using scRNAseq. Overview of the deconvolution of spatial spots. First, scRNAseq data and spatial data are collected from the same or similar tissue. Second, scRNAseq data and spatial transcriptomics are then fed to three different deconvolution algorithms: Cell2Location, Seurat, and CellTrek. Cell2Location uses a Bayesian model to decompose the spatial expression count matrix into cell type signatures. Seurat employs bulk gene expression deconvolution based on a single-cell reference. CellTrek maps single cells to spatial locations. Finally, prediction results of the cell type abundance at each spatial spot are generated from the three algorithms
Fig. 3
Fig. 3
Compositional deconvolution of spatial spots using scRNAseq. a UMAP of bone marrow scRNAseq datasets. b Probability that spatial spots contain MesLin cells. c Standard deviation (SD) of predictive values for each cell cluster within each spatial spot. Higher values denote greater variation in predictive values and a greater discernment of cell types within each spatial spot. d Pie chart showing the probability of each indicated cell type being assigned to each spatial region using the three indicated predictive packages. e Overlap between prediction methods (Seurat, CellTrek, and Cell2Location) of spatial spots proposed to contain MesLin cells. f Pie chart showing the probability of each indicated cell type being assigned to each spatial region using the combined predictive pipeline
Fig. 4
Fig. 4
Proposed SSPC subtypes localize to spatially distinct skeletal regions. a Spatial spots identified as containing MesLin cells within the marrow. The insert shows the probability of MesLin cells localizing to each of the spatial regions. Dotted boxes denote the upper (red) and lower (blue) 2 quartiles. b Pathway analysis of marrow DEGs enriched in MesLin+ and MesLin spatial spots. c UMAP of subclustered MesLin cells. d Predictive modeling of the indicated single-cell cluster onto spatial spots. e Predictive modeling quantification of the indicated MesLin subcluster onto segmented spatial data
Fig. 5
Fig. 5
Identification of niche-resident cells. a Probability correlations indicating the likelihood that cell types are present within marrow Cxcl12+Lepr+ SSPC spatial spots. b Statistical analyses showing the likelihood that the indicated cell is present within the stem cell niche. Green values indicate significant positive enrichment; red values indicate significant negative enrichment. c Bubble plot showing cell types predicted to be within the niche. Cell types within the dotted boundary were significantly enriched. d UMAP of subclustered ECs. e Dot plot showing predictive values of where each EC subcluster maps to each spatial transcriptomic region. f Dot plot showing modular scoring of pathway activation within each EC subcluster. g Bubble plot showing EC subclusters predicted to be within the SSPC niche. h UMAP of subclustered Macs. i Dot plot showing predictive values of where each Mac subcluster maps to each spatial transcriptomic region. j Dot plot showing modular scoring of pathway activation within each Mac subcluster. k Bubble plot showing Mac subclusters predicted to be within the SSPC niche
Fig. 6
Fig. 6
Signaling within the stem cell niche using spatial transcriptomics. a Pathway analysis of DEGs enriched with niche spatial spots relative to other spatial spots within the bone marrow. b Schematic of cell‒cell interactions. While scRNAseq can be used to predict ligand/receptor pairs between cell types, the addition of spatial information can distinguish biologically relevant interactions occurring between cells with close proximity (within circle, solid arrows) from those occurring between distant cells unlikely to occur in vivo (outside of circle, dotted arrows). c Predicted cell‒cell interactions using single-cell spatial transcriptomics. Genes were defined as showing enriched expression within select cell types (brown), encoding known receptors or ligands (yellow), predicted to communicate using CellChat (green), and being expressed by those cell types present within the stem cell niche (magenta). Genes were overlaid with spatial DEGs (blue). d Sample genes identified from cell‒cell interaction found to be spatially restricted to the niche but expressed by numerous different cell types (Cd44), genes expressed by only select cell type but present throughout the marrow (Cd74), and genes restricted both spatially and by cell type (Ryr1). e RNAscope of bone marrow showing Lepr-expressing SSPCs (red) and Cd44 (left), Cd74 (middle) and Ryr1 (right) (green). Bar, 10 µm. f Distribution of distances between the indicated niche cell markers and Lepr+ SSPCs. Numbers above the graph represent the average±SD of the distance between cells. n = 50 cells per marker. aP < 0.001 vs. Cd74, bP < 0.001 vs. Ryr1
Fig. 7
Fig. 7
Spatial-time analysis reveals gradients of signals originating from the blood vessels. a Spatial distance calculations showing the minimal distance of each marrow spatial spot to the nearest vessel (left), trabecular bone surface (middle), and cortical bone surface (right). b Identification of genes that are differentially regulated across the marrow as a function of their distance to the nearest blood vessel. c Module scoring showing activation of the indicated metabolic pathways within marrow spatial spots relative to their distance to the nearest blood vessel (left), trabecular (middle), or cortical (right) surface. d Module scoring showing activation of the indicated morphogenetic pathways within marrow spatial spots relative to their distance to the nearest blood vessel (left), trabecular (middle), or cortical (right) surface. e Immunofluorescence staining of TGFβ activation (p-SMAD3) and PDGFRα in mouse long bone. Blood vessels are denoted by endomucin (green). Dotted lines denote the bone boundary. Bar, 100 µm

References

    1. Matsushita Y, Ono W, Ono N. Skeletal stem cells for bone development and repair: diversity matters. Curr. Osteoporos. Rep. 2020;18:189–198. - PMC - PubMed
    1. Serowoky MA, Arata CE, Crump JG, Mariani FV. Skeletal stem cells: insights into maintaining and regenerating the skeleton. Development. 2020;147:dev179325. - PMC - PubMed
    1. Mancinelli L, Intini G. Age-associated declining of the regeneration potential of skeletal stem/progenitor cells. Front. Physiol. 2023;14:1087254. - PMC - PubMed
    1. Baccin C, et al. Combined single-cell and spatial transcriptomics reveal the molecular, cellular and spatial bone marrow niche organization. Nat. Cell Biol. 2020;22:38–48. - PMC - PubMed
    1. Baryawno N, et al. A cellular taxonomy of the bone marrow stroma in homeostasis and leukemia. Cell. 2019;177:1915–1932.e1916. - PMC - PubMed

Publication types