. 2023 Nov 5;13(1):19125.
doi: 10.1038/s41598-023-46125-9.

Boyle's Law ignores dynamic processes in governing barotrauma in fish

Affiliations

Boyle's Law ignores dynamic processes in governing barotrauma in fish

J R Kerr et al. Sci Rep. .

Abstract

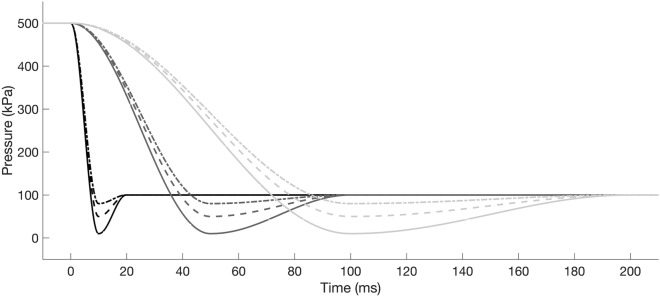
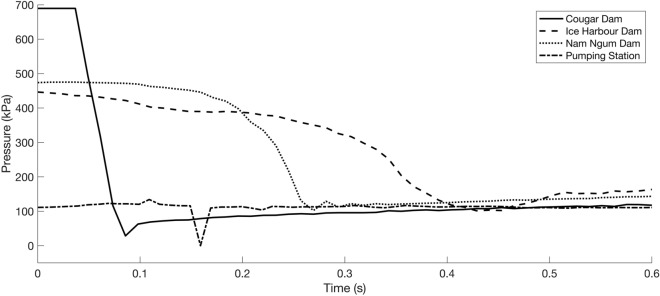
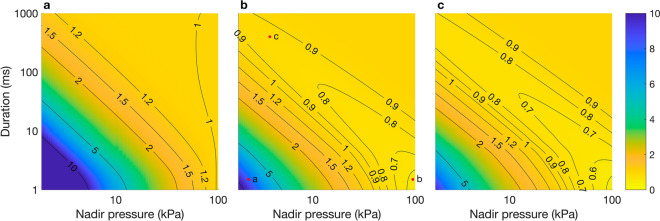
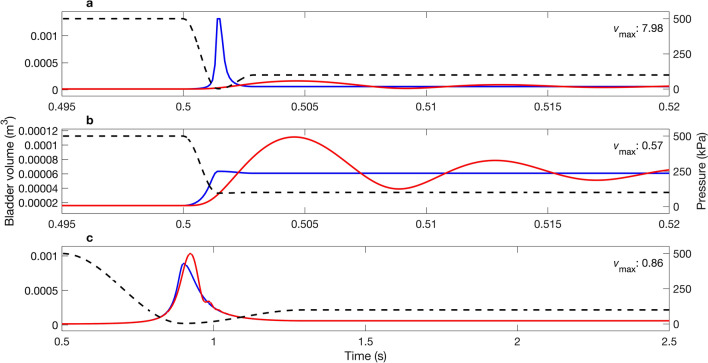
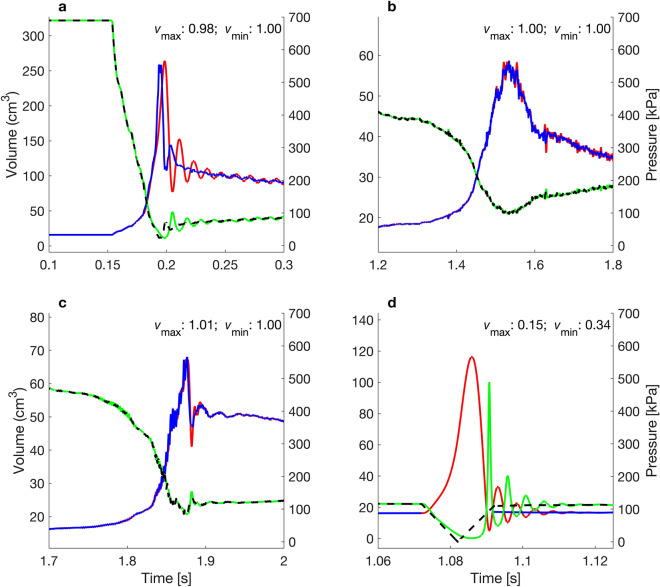
The expansion and potential rupture of the swim bladder due to rapid decompression, a major cause of barotrauma injury in fish that pass through turbines and pumps, is generally assumed to be governed by Boyle's Law. In this study, two swim bladder expansion models are presented and tested in silico. One based on the quasi-static Boyle's Law, and a Modified Rayleigh Plesset Model (MRPM), which includes both inertial and pressure functions and was parametrised to be representative of a fish swim bladder. The two models were tested using a range of: (1) simulated and (2) empirically derived pressure profiles. Our results highlight a range of conditions where the Boyle's Law model (BLM) is inappropriate for predicting swim bladder size in response to pressure change and that these conditions occur in situ, indicating that this is an applied and not just theoretical issue. Specifically, these conditions include any one, or any combination, of the following factors: (1) when rate of pressure change is anything but very slow compared to the resonant frequency of the swim bladder; (2) when the nadir pressure is near or at absolute zero; and (3) when a fish experiences liquid tensions (i.e. negative absolute pressures). Under each of these conditions, the MRPM is more appropriate tool for predicting swim bladder size in response to pressure change and hence it is a better model for quantifying barotrauma in fish.


Conflict of interest statement

The authors declare no competing interests.

Figures

Figure 1
Figure 1
Examples of the simulated pressure profiles used to compare swim bladder volume predicted by the numerical models. Black, dark grey and light grey are decompression durations (D) of 10, 50 and 100 ms, respectively. Solid, dashed and dot-dashed lines are nadir pressures (Pn) of 10, 50 and 80 kPa, respectively.
Figure 2
Figure 2
Decompression profiles from three hydropower dams (Cougar, Ice Harbour and Nan Ngum) and a pumping station (Duivelsput) used for the swim bladder expansion modelling.
Figure 3
Figure 3
Surface plots of vmax, the quotient of the maximum swim bladder volume predicted by the BLM and MRPM in response to decompression for a range of nadir pressures (Pn: kPa) and durations (D: ms) with a Quality Factor (Q) of 1 (a), 5 (b) and 10 (c). Within subplot (b), red dots labelled ‘a’ to ‘c’ are points for which the swim bladder volume predicted by each model are shown in Fig. 4a–c, respectively.
Figure 4
Figure 4
Examples of simulated pressure profiles (right axis: dashed black line) for which the maximum swim bladder volume (m3; left axis) predicted by the BLM (blue line) and MRPM (red line) differed: (a) D= 1.5 ms, Pn = 2.5 kPa, (b) D = 1.5 ms, Pn = 95 kPa, (c) D= 400 ms, Pn = 4 kPa. MRPM data for Q = 5. Quotient of maximum swim bladder volume (vmax) predicted by each model inset in top right of each panel. See Fig. 3b for corresponding location of each example within the parameter space.
Figure 5
Figure 5
Surface plots of vmin, the quotient of the minimum swim bladder volume predicted by the MRPM and BLM over a range of nadir pressures (Pn: kPa) and durations (D: ms) for the Simulated Pressure Profiles (SPP) for Q =1 (a), 5 (b) and 10 (c). Within subplot (b), red dots labelled ‘a’ and ‘b’ are points for which the swim bladder volume predicted by each model are shown in Fig. 6a and b, respectively.
Figure 6
Figure 6
Examples of simulated pressure profiles (kPa; right axis: dashed black line) for which the minimum swim bladder volume (m3; left axis) predicted by the BLM (blue line) and the MRPM (red line) differed: (a) D = 12 ms, Pn = 3 kPa and (b) D = 12 ms, Pn = 8 kPa. MRPM data for Q = 5. Quotient of minimum swim bladder volume (vmin) predicted by each model inset in top right of each panel. See Fig. 5b for corresponding location of each example within the parameter space.
Figure 7
Figure 7
Maximum swim bladder volume (y axis) predicted by the MRPM (red lines) and the BLM (blue line) for the simulated pressure profiles over a range of nadir pressures (x axis) and durations (D = 5, 20 and 100 ms). Note that the BLM is not influenced by rate of pressure change so only one output (blue line) is shown.
Figure 8
Figure 8
Quotient of the (a) maximum (vmax) and (b) minimum (vmin) swim bladder volume predicted by the modified Rayleigh Plesset model (MRPM) and Boyle’s Law Model (BLM) using different quality factors (Q) for the MRPM. Dashed lines represent the threshold for a 5% difference in predicted volume between swim bladder expansion models.
Figure 9
Figure 9
Swim bladder volume (m3; left axis) predicted by the BLM (blue line) and the MRPM (red line) for pressure profiles (kPa; right axis; dashed black line) measured with an autonomous sensor at the Cougar (a), Ice Harbour (b) and Nam Ngum (c) Dam and the Duivelsput Pumping Station (d). Green line is the internal swim bladder pressure (kPa; right axis) predicted by the MRPM. MRPM data for Q = 5. Quotient of maximum (vmax) and minimum (vmin) swim bladder volume predicted by each model inset in top right of each panel.

References

    1. Grill G, et al. Mapping the world’s free-flowing rivers. Nature. 2019;569:215–221. doi: 10.1038/s41586-019-1111-9. - DOI - PubMed
    1. Reid AJ, et al. Emerging threats and persistent conservation challenges for freshwater biodiversity. Biol. Rev. 2019;94:849–873. doi: 10.1111/brv.12480. - DOI - PubMed
    1. Radinger J, van Treeck R, Wolter C. Evident but context-dependent mortality of fish passing hydroelectric turbines. Conserv. Biol. 2022;36:e13870. doi: 10.1111/cobi.13870. - DOI - PubMed
    1. Van Esch BPM. Fish injury and mortality during passage through pumping stations. J. Fluids Eng. 2012;134:71302. doi: 10.1115/1.4006808. - DOI
    1. Bierschenk BM, Pander J, Mueller M, Geist J. Fish injury and mortality at pumping stations: A comparison of conventional and fish-friendly pumps. Mar. Freshw. Res. 2019;70:449–458. doi: 10.1071/MF18116. - DOI

Publication types