. 2023 Oct 19:17:1258590.
doi: 10.3389/fncom.2023.1258590. eCollection 2023.

Atypical development of causal inference in autism inferred through a neurocomputational model

Affiliations

Atypical development of causal inference in autism inferred through a neurocomputational model

Melissa Monti et al. Front Comput Neurosci. .

Abstract

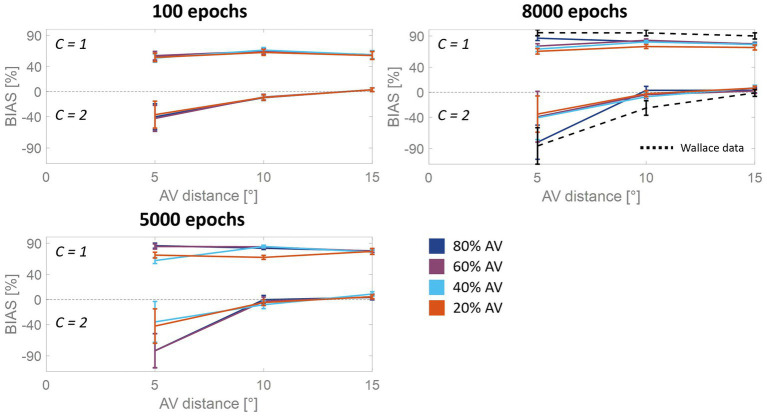
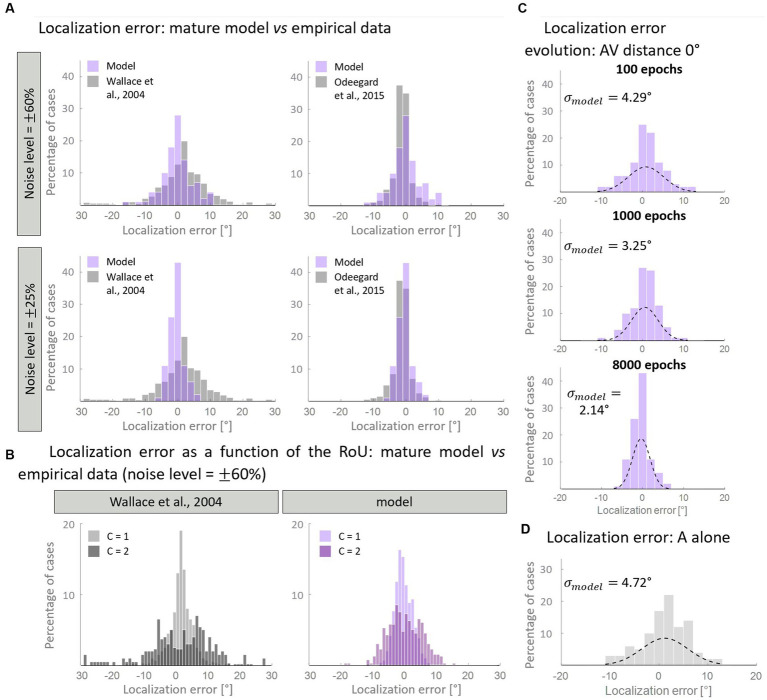
In everyday life, the brain processes a multitude of stimuli from the surrounding environment, requiring the integration of information from different sensory modalities to form a coherent perception. This process, known as multisensory integration, enhances the brain's response to redundant congruent sensory cues. However, it is equally important for the brain to segregate sensory inputs from distinct events, to interact with and correctly perceive the multisensory environment. This problem the brain must face, known as the causal inference problem, is strictly related to multisensory integration. It is widely recognized that the ability to integrate information from different senses emerges during the developmental period, as a function of our experience with multisensory stimuli. Consequently, multisensory integrative abilities are altered in individuals who have atypical experiences with cross-modal cues, such as those on the autistic spectrum. However, no research has been conducted on the developmental trajectories of causal inference and its relationship with experience thus far. Here, we used a neuro-computational model to simulate and investigate the development of causal inference in both typically developing children and those in the autistic spectrum. Our results indicate that higher exposure to cross-modal cues accelerates the acquisition of causal inference abilities, and a minimum level of experience with multisensory stimuli is required to develop fully mature behavior. We then simulated the altered developmental trajectory of causal inference in individuals with autism by assuming reduced multisensory experience during training. The results suggest that causal inference reaches complete maturity much later in these individuals compared to neurotypical individuals. Furthermore, we discuss the underlying neural mechanisms and network architecture involved in these processes, highlighting that the development of causal inference follows the evolution of the mechanisms subserving multisensory integration. Overall, this study provides a computational framework, unifying causal inference and multisensory integration, which allows us to suggest neural mechanisms and provide testable predictions about the development of such abilities in typically developed and autistic children.

Keywords: autism spectrum disorder; causal inference; multisensory integration; multisensory training; neural network; spatial sensory processing; ventriloquism effect.


Conflict of interest statement

The authors declare that the research was conducted in the absence of any commercial or financial relationships that could be construed as a potential conflict of interest.

Figures

Figure 1
Figure 1
Structure of the network. The visual and auditory regions process external sensory stimuli. These regions are reciprocally connected through direct excitatory synapses ( Wav and Wva ), and send long-range feedforward projections ( Wmv and Wma ), targeting the causal inference area. All these inter-area synapses are realized via Gaussian functions. The three regions in the network also include intra-area synapses (L), linking elements belonging to the same area. These connections are implemented using a Mexican hat function.
Figure 2
Figure 2
Temporal pattern of neural activity in the regions of the model. Panel (A) displays a simulation where two multisensory stimuli, separated by a spatial distance of 10°, are interpreted as originating from a single source. In contrast, Panel (B) presents an example where the same stimuli, with identical spatial configurations, are perceived as originating from separate sources due to the weaker cross-modal synapses. Within each figure, the gray area represents the activity in the auditory region, the pink is the activation of the visual region, and the black dashed line represents the activity of the multisensory area. Each panel consists of three columns, each representing a snapshot of network activity at different time points during the simulation. The left column reflects the initial stage of the simulation (10 ms), characterized by minimal activity below the threshold (gray horizontal dotted line in panels) in the multisensory area. The middle column corresponds to an intermediate moment (20 ms) when the threshold in the multisensory area has already been surpassed. Finally, the right column portrays the final configuration (60 ms) of the network activity.
Figure 3
Figure 3
Percentual RoU and auditory bias as a function of AV spatial distance (in degrees) at different training stages. The input noise was set to 25% of the input strength and the detection threshold in the causal inference layer was 0.15. In each figure, different colors represent trainings involving different levels of multisensory experience. In particular, the blue curve has been obtained by training the model with 80% of AV stimuli, 60% of AV stimuli were presented to the network to obtain the purple curve, 40% for obtaining the light blue curve, and 20% for obtaining the red one. Both the RoU and the bias decrease with increasing spatial distance. Moreover, their values progressively increase during the training. It is worth noting that the RoU and the bias increase as a function of the amount of AV stimuli presented to the network. Particularly, the performance reached by the trainings conducted with over 50% of AV stimuli (blue and purple curves) is comparable. In contrast, the performance achieved by trainings involving a lower multisensory experience never catches up. Simulations’ results obtained at the end of the training (8,000 epochs) are compared with behavioral data from Wallace et al. (2004b) (black dashed line), obtained with an experimental paradigm similar to the one simulated by the model. The model’s results obtained by training the network with 80% or 60% of AV stimuli accurately fit these empirical data.
Figure 4
Figure 4
Simulated developmental trajectories of ASD children. Panel (A) illustrates the training process implemented for simulating ASDs development. Over the course of the training epochs, the proportion of AV stimuli increases to simulate the growing attention and exposure to multisensory stimuli experienced by ASD individuals during the developmental period. Panel (B) displays the percentual RoU and bias as a function of AV spatial distance (in degrees) at different training epochs. The input noise was set to 25% of the input strength and the detection threshold in the causal inference layer was set to 0.15. In each figure, different colors represent trainings involving different levels of multisensory experience. In particular, the blue and the purple curves represent trainings involving a fixed percentage of AV stimuli, equal to 80% and 60%, respectively. The yellow curve, instead, has been obtained by progressively increasing the proportion of AV stimuli presented to the network and is representative of ASD development. Both the RoU and the bias decrease with increasing spatial distance. Moreover, their values progressively increase during the training. It is worth noting that the RoU and the bias increase as a function of the amount of AV stimuli presented to the network: the blue curve is the first reaching full maturity, followed by the purple one, and, finally, by the yellow one. Notably, the final performance reached by the three trainings is comparable. This means that also the training performed by progressively increasing the multisensory experience is capable of achieving normotypical performance but with a delay of 2,000–3,000 training epochs.
Figure 5
Figure 5
Auditory bias as a function of the AV spatial distance (in degrees) and number of sources, at different training epochs. The bias is examined separately when the network identifies a common cause (C = 1) or different causes (C = 2). The bias increases in absolute value during the training, as a function of multisensory experience: the higher the amount of AV stimuli presented to the network, the faster the development. At the end of the training process (8,000 epochs), the model trained with more than 50% of AV stimuli accurately reproduces the behavioral data from Wallace et al. (2004b) (black dashed line). In the case of C = 1, the bias is nearly complete and remains relatively consistent across various AV spatial disparities. However, when C = 2, the auditory bias is negative for distances smaller than 10°, while it is absent at larger disparities (i.e., 15°).
Figure 6
Figure 6
Localization variability as a function of spatial disparity. According to the model’s predictions (purple lines), when a single cause is identified (solid squares), the level of variation in stimulus localization, as measured by the standard deviation, is relatively low and increases only slightly with the spatial disparity between the stimuli. Conversely, when distinct causes are reported (open diamonds), the variance in stimulus localization is consistently and significantly higher compared to the single-cause case. This pattern of results resembles the behavioral data from Wallace et al. (2004b).
Figure 7
Figure 7
Distribution of the auditory localization error. Panel (A) compares the empirical distribution of localization error with that obtained with the mature model, trained with over 50% of AV stimuli. In particular, when the input noise is high, the model’s results are comparable with the data from Wallace et al. (2004b) (left column). A lower noise level is enough for reproducing the localization error distribution obtained by Odegaard et al. (2015) (right column). Panel (B) displays the same distribution, plotting separately the results for C = 1 and C = 2. Both our computational simulations and data by Wallace et al. (2004b) revealed a much broader distribution of localization error when two distinct causes are identified (C = 2), compared to when unity is reported (C = 1). Panel (C) shows the development of the distribution of localization error predicted by the model in the multisensory condition. Throughout the training epochs, the distribution of the localization error shrinks around 0°. Panel (D) reports the distribution of the localization error when only the auditory stimulus is presented to the network.

References

    1. Alais D., Burr D. (2004). The ventriloquist effect results from near-optimal bimodal integration. Curr. Biol. 14, 257–262. doi: 10.1016/j.cub.2004.01.029, PMID: - DOI - PubMed
    1. Bao V. A., Doobay V., Mottron L., Collignon O., Bertone A. (2017). Multisensory integration of low-level information in autism spectrum disorder: measuring susceptibility to the flash-beep illusion. J. Autism Dev. Disord. 47, 2535–2543. doi: 10.1007/s10803-017-3172-7, PMID: - DOI - PubMed
    1. Baum S. H., Stevenson R. A., Wallace M. T. (2015). Behavioral, perceptual, and neural alterations in sensory and multisensory function in autism spectrum disorder. Prog. Neurobiol. 134, 140–160. doi: 10.1016/j.pneurobio.2015.09.007, PMID: - DOI - PMC - PubMed
    1. Bebko J. M., Schroeder J. H., Weiss J. A. (2014). The McGurk effect in children with autism and Asperger syndrome. Autism Res. 7, 50–59. doi: 10.1002/aur.1343, PMID: - DOI - PubMed
    1. Beker S., Foxe J. J., Molholm S. (2018). Ripe for solution: delayed development of multisensory processing in autism and its remediation. Neurosci. Biobehav. Rev. 84, 182–192. doi: 10.1016/j.neubiorev.2017.11.008, PMID: - DOI - PMC - PubMed

LinkOut - more resources