. 2023 Dec 8:8:366.
doi: 10.12688/wellcomeopenres.19666.2. eCollection 2023.

A high-throughput 3D X-ray histology facility for biomedical research and preclinical applications

Affiliations

A high-throughput 3D X-ray histology facility for biomedical research and preclinical applications

Orestis L Katsamenis et al. Wellcome Open Res. .

Abstract

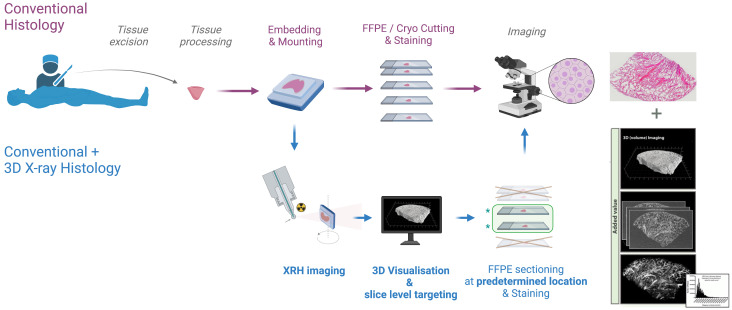
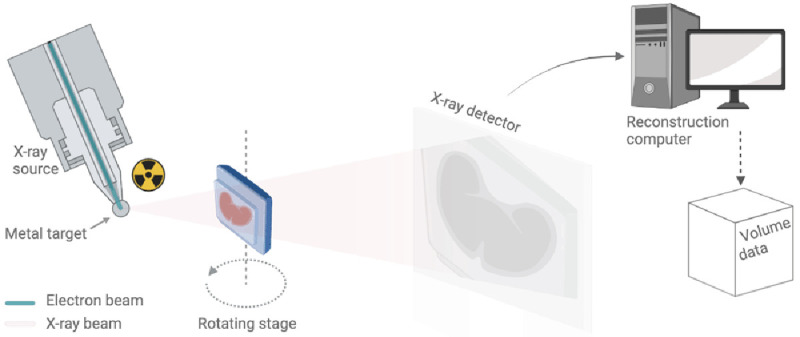
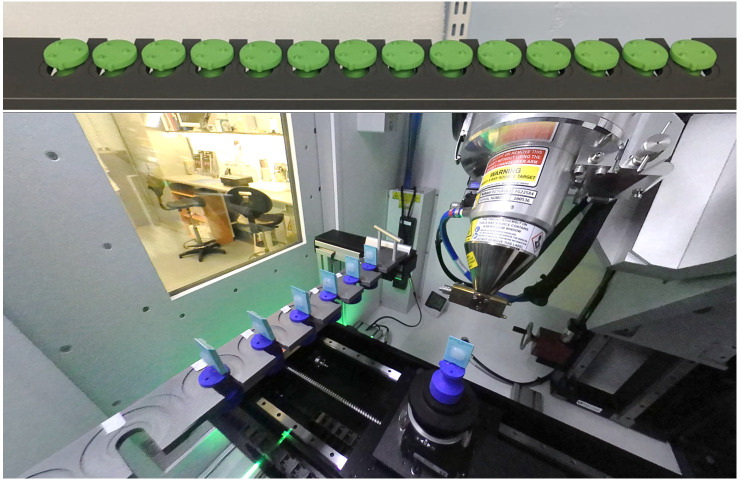
Background: The University of Southampton, in collaboration with the University Hospital Southampton (UHS) NHS Foundation Trust and industrial partners, has been at the forefront of developing three-dimensional (3D) imaging workflows using X-ray microfocus computed tomography (μCT) -based technology. This article presents the outcomes of these endeavours and highlights the distinctive characteristics of a μCT facility tailored explicitly for 3D X-ray Histology, with a primary focus on applications in biomedical research and preclinical and clinical studies.

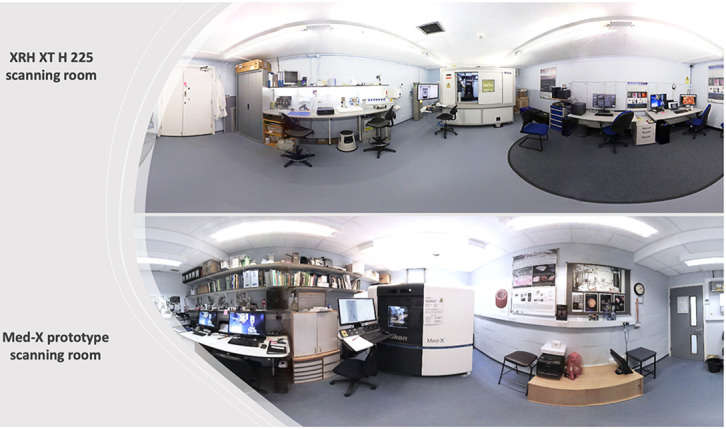
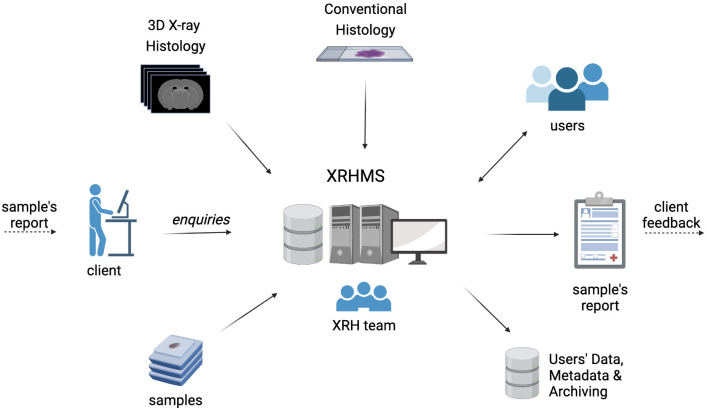
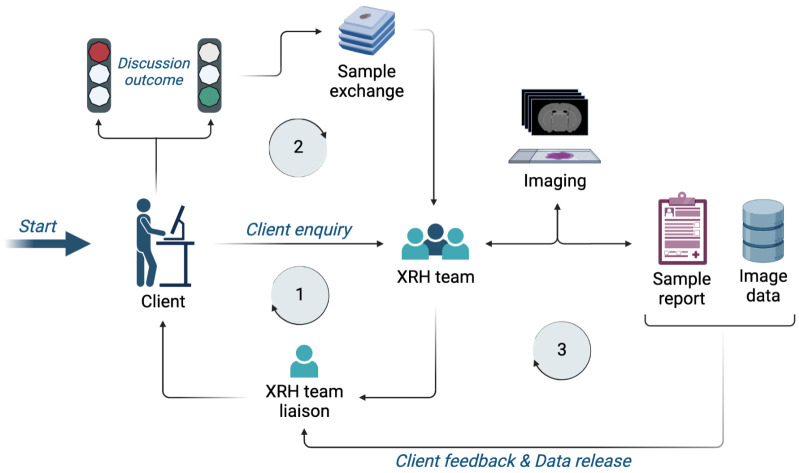
Methods: The UHS houses a unique 3D X-ray Histology (XRH) facility, offering a range of services to national and international clients. The facility employs specialised μCT equipment explicitly designed for histology applications, allowing whole-block XRH imaging of formalin-fixed and paraffin-embedded tissue specimens. It also enables correlative imaging by combining μCT imaging with other microscopy techniques, such as immunohistochemistry (IHC) and serial block-face scanning electron microscopy, as well as data visualisation, image quantification, and bespoke analysis.

Results: Over the past seven years, the XRH facility has successfully completed over 120 projects in collaboration with researchers from 60 affiliations, resulting in numerous published manuscripts and conference proceedings. The facility has streamlined the μCT imaging process, improving productivity and enabling efficient acquisition of 3D datasets.

Discussion & conclusions: The 3D X-ray Histology (XRH) facility at UHS is a pioneering platform in the field of histology and biomedical imaging. To the best of our knowledge, it stands out as the world's first dedicated XRH facility, encompassing every aspect of the imaging process, from user support to data generation, analysis, training, archiving, and metadata generation. This article serves as a comprehensive guide for establishing similar XRH facilities, covering key aspects of facility setup and operation. Researchers and institutions interested in developing state-of-the-art histology and imaging facilities can utilise this resource to explore new frontiers in their research and discoveries.

Keywords: 3D X-ray Histology; 3D histology; Histology; XRH; microCT; virtual histology; μ-CT; μCT.


Conflict of interest statement

No competing interests were disclosed.

Figures

Figure 1.
Figure 1.. XRH integration into existing histology workflows.
Non-destructive 3D XRH imaging can be seamlessly integrated into the protocols used for conventional 2D histology and enhance them by providing high-resolution 3D data. The XRH data can also be used to optimise physical sectioning of the tissue block for downstream conventional histology by identifying the areas of interest within the block and slicing accordingly.
Figure 2.
Figure 2.. Summary of users’ survey.
The survey collected information from both domestic (UK) and global collaborators and prospective users of the XRH facility, with the objective of comprehending the distinct requirements of the user community. The XRH facility was designed and tailored to cater to these demands; ( a): Research areas of Participants, ( b): Importance of various aspects of 3D XRH to participants’ work, ( c) Importance of various opportunities emerging with 3D XRH to participants’ work.
Figure 3.
Figure 3.. Schematic of a benchtop μCT scanner.
The X-ray source on the left uses a beam of electrons fired at a metal target to produce a cone of X-rays. This conical X-ray beam then passes through the sample to the detector. The sample rotates on a rotation stage and for each angular step, a different X-ray radiography or projection image is taken and sent to the reconstruction computer for further processing (also see Supplementary Video 4).
Figure 4.
Figure 4.. 3D XRH facility at the University of Southampton.
The facility is located at the University Hospital Southampton, and it is jointly run by the μ-VIS X-ray Imaging Centre and the Biomedical Imaging Unit. (Top) XRH XT H 225 scanning room. (Bottom) The Med-X prototype scanning room. Both μCT systems were custom-specified, designed, and built in a collaboration between the University of Southampton and Nikon X-Tek Systems Ltd (Tring, UK).
Figure 5.
Figure 5.. The sample exchange autoloader system utilized for uninterrupted micro-computed tomography (μCT) scanning at the University of Southampton's 3D X-ray Histology (XRH) facility.
The top panel shows a 14-slot rack capable of holding samples with a 30 mm diameter per slot, while the bottom panel displays a 10-slot rack with dual slots accommodating samples with 30 mm and 60 mm diameters. Seven conventional histology cassettes are loaded in the bottom rack for scanning.
Figure 6.
Figure 6.. Multiplanar 2D viewing of 3D XRH data.
(Left) The xy-plane is defined by convention as the plane parallel to the histology cassette, where one xy-slice (blue plane on the localiser shown on the right) is shown here. (Middle) One yz-slice at the top (red on the localiser shown on the right) and one xz-slice at the bottom (green on the localiser sown on the right) that have been selected. They are orthogonal to each other and to the xy-plane. (Right) Localiser that combines one xy-slice and the position of the other ortho-planes (yz-slice: red; xz-plane: green). Using ortho-plane viewing, the user can scroll through the depth, width, and height of the specimen, zoom, pan, and perform dimensional measurements.
Figure 7.
Figure 7.. Thick-slice 2.5D viewing of 3D XRH data.
Top row shows a whole-block XRH image of a head and neck solid tumour specimen, while the bottom row displays a 10 x 10 mm 2 detail view of the lower-right area of the tissue. (Left) Single slice view, (Middle) 20-slice average intensity projection “AVG”, (Right) 20-slice maximum intensity projection “MIP”.
Figure 8.
Figure 8.. Whole-block XRH imaging of a conventionally prepared FFPE sample.
Histology cassette not rendered for clarity. (Left) Volumetric rendering showing the tissue sample inside the wax (embedding medium of the sample). (Middle) volumetric rendering of the tissue. (Right) volumetric rendering of local 3D tissue thickness, where the colour bar ranges from 0.01 mm (blue) up to 0.31 mm (red). Images generated using Dragonfly (Object Research Systems).
Figure 9.
Figure 9.. Quantitative imaging for cancer research.
(Top section) Average intensity projection (AvgIP) and 3D volume rendering of the tumours studied in ; (Bottom section): 3D (volume) rendering of the segmented ‘necrotic core’ of two tumours treated with two different formulation, showing the extent and the morphology of the necrotic core in space, rendered along with a representative central 2D μCT slice. Quantitative analysis allowed to accurately access the volume of the necrotic core (29.83 mm 3 vs. 13.16 mm 3) as well as the core to total tumour ratio: 2.58% of the tumour volume in the DOX+CUR solution-treated tumour was necrotic compared to 5.29% on the DOX+CUR peptide hydrogel-treated one.
Figure 10.
Figure 10.. Correlative XRH and conventional histology imaging of a human head and neck tumour specimen.
Specimen was scanned on a cassette at 15 μm voxel (3D pixel) size without staining. Serial sections were taken after μCT and stained with H&E. Top row: Side-by-side visualisation of matching XRH and conventional histology images on the left ( a, b); Augmented tomography in the middle ( c) is made possible by fusing conventional histology images with XRH data to enhance the specific information presented by the mainly structural μCT data; Volumetric visualisation of the whole tissue block on the right ( d) offers 3D context and overview of the microanatomy. Bottom row: Close-up images on the central part of the volume shown in ( a) & ( b). Single XRH slice on the left ( e), H&E slice in the middle ( f), and an MIP image ( g) uncovering the volumetric development of micro-vasculature on the right.
Figure 11.
Figure 11.. 3D XRH-based mathematical modelling.
3D model simulation result for flow in an intralobular and subpleural lung geometry. Graphical representations of human lung tissue volumes of interest at an intralobular location and a subpleural location ( a and b, respectively). Blood vessels = blue, lymphatic vessel = green. Resultant mathematical model solution for the static pressure (Pa) within vasculature at an intralobular location and a subpleural location ( c and d, respectively). Streamlines of Darcy’s velocity field into the interstitium are shown in red. The interstitial pressure results have been removed from view so the streamlines could be visualised. The volume of interests has a dimension of 830 × 830 × 830 μm 3. A visual outline of the segmentation process of the relevant features used for generating the model shown here are illustrated in figure 2 in , where the segmented features (lymphatic- and blood- vessels) are rendered against a histological slice and 2D and 3D μCT images.
Figure 12.
Figure 12.. The X-ray Histology Management System (XRHMS).
The XRHMS is designed to be the control centre of all operations at the 3D XRH facility. Typical inputs include new project entries, client/user enquiries as well as sample logging and tracking. Importantly, XRHMS automatically handles incoming imaging data, generates metadata, organises, and assigns these data to samples and projects.
Figure 13.
Figure 13.. XRH facility access request workflow.
Stage 1: An initial enquiry is submitted to the XRH team, which is getting in contact with the client to discuss project details and assess feasibility. Stage 2: If feasibility criteria are met, samples are sent to the facility and project commences. Stage 3: Imaging, reporting, and data release to the client. Depending on the project design, this stage may also include complementary sample processing, conventional histology, correlative imaging and/or bespoke data analysis.

References

    1. Scott AE, Vasilescu DM, Seal KA, et al. : Three dimensional imaging of paraffin embedded human lung tissue samples by micro-computed tomography. PLoS One. 2015;10(6): e0126230. 10.1371/journal.pone.0126230 - DOI - PMC - PubMed
    1. Katsamenis OL, Olding M, Warner JA, et al. : X-ray Micro-Computed Tomography for Nondestructive Three-Dimensional (3D) X-ray Histology. Am J Pathol. 2019;189(8):1608–1620. 10.1016/j.ajpath.2019.05.004 - DOI - PMC - PubMed
    1. Lawson MJ, Katsamenis OL, Chatelet D, et al. : Immunofluorescence-guided segmentation of three-dimensional features in micro-computed tomography datasets of human lung tissue. R Soc Open Sci. 2021;8(11): 211067. 10.1098/rsos.211067 - DOI - PMC - PubMed
    1. Laundon D, Katsamenis OL, Thompson J, et al. : Correlative multiscale microCT-SBF-SEM imaging of resin-embedded tissue. Methods Cell Biol. 2023;177:241–267. 10.1016/bs.mcb.2023.01.014 - DOI - PubMed
    1. Schneider P, Katsamenis OL, Basford PJ, et al. : Foundations for routine 3D X-ray histology (XRH) in Southampton.In: 8 th annual Tomography for Scientific Advancement (ToScA) Global.Online Edition, Tomography for Scientific Advancement (ToScA), 2020.