. 2023 Nov 1;7(11):e976.
doi: 10.1097/HS9.0000000000000976. eCollection 2023 Nov.

Clonal Relationship and Mutation Analysis in Lymphoplasmacytic Lymphoma/Waldenström Macroglobulinemia Associated With Diffuse Large B-cell Lymphoma

Affiliations

Clonal Relationship and Mutation Analysis in Lymphoplasmacytic Lymphoma/Waldenström Macroglobulinemia Associated With Diffuse Large B-cell Lymphoma

Madeleine R Berendsen et al. Hemasphere. .

Abstract

Patients with lymphoplasmacytic lymphoma/Waldenström macroglobulinemia (LPL/WM) occasionally develop diffuse large B-cell lymphoma (DLBCL). This mostly results from LPL/WM transformation, although clonally unrelated DLBCL can also arise. LPL/WM is characterized by activating MYD88L265P (>95%) and CXCR4 mutations (~30%), but the genetic drivers of transformation remain to be identified. Here, in thirteen LPL/WM patients who developed DLBCL, the clonal relationship of LPL and DLBCL together with mutations contributing to transformation were investigated. In 2 LPL/WM patients (15%), high-throughput sequencing of immunoglobulin gene rearrangements showed evidence of >1 clonal B-cell population in LPL tissue biopsies. In the majority of LPL/WM patients, DLBCL presentations were clonally related to the dominant clone in LPL, providing evidence of transformation. However, in 3 patients (23%), DLBCL was clonally unrelated to the major malignant B-cell clone in LPL, of which 2 patients developed de novo DLBCL. In this study cohort, LPL displayed MYD88L265P mutation in 8 out of eleven patients analyzed (73%), while CXCR4 mutations were observed in 6 cases (55%). MYD88WT LPL biopsies present in 3 patients (27%) were characterized by CD79B and TNFAIP3 mutations. Upon transformation, DLBCL acquired novel mutations targeting BTG1, BTG2, CD79B, CARD11, TP53, and PIM1. Together, we demonstrate variable clonal B-cell dynamics in LPL/WM patients developing DLBCL, and the occurrence of clonally unrelated DLBCL in about one-quarter of LPL/WM patients. Moreover, we identified commonly mutated genes upon DLBCL transformation, which together with preserved mutations already present in LPL characterize the mutational landscape of DLBCL occurrences in LPL/WM patients.


Conflict of interest statement

The authors have no conflicts of interest to disclose.

Figures

None
Graphical abstract
Figure 1.
Figure 1.
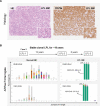
Histology and NGS-based clonality analysis of LPL bone marrow biopsies with stable clonal disease. (A) Representative section of an LPL bone marrow (BM) biopsy (case 2) stained with hematoxylin and eosin (H&E) (left panel), or CD79a antibody (right panel). Images were taken at 200x magnification, and the insert shows a zoom-in. (B) Next-generation sequencing (NGS)-based clonality assessment combined with ARResT/Interrogate bioinformatics reveals the distribution of clonotypes as detected by the analysis of IGHD-IGHJ and IGKV-IGKJ gene rearrangements in normal BM (left panels), and consecutive LPL biopsies (LPL-1, LPL-2, LPL-3) of case 2 (right panels) with stable clonal expansion over a period of ~19 years. The relative abundance of each clonotype per indicated target is depicted on the y-axis and the junction amino acid (AA) length on the x-axis. The most dominant clonotype is indicated in green, and the identity of the dominant clonotype is shown. A clonotype is defined by the 5′ and 3′ gene annotation and the junctional nucleotide sequence of the rearrangement. AA = amino acid; BM = bone marrow; HE = hematoxylin and eosin; LPL = lymphoplasmacytic lymphoma; NGS = next-generation sequencing.
Figure 2.
Figure 2.
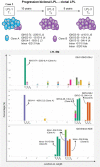
Temporal clonal B-cell dynamics in LPL bone marrow biopsies as revealed by NGS-based detection of IG gene rearrangements. Schematic representation of the relative distribution of 2 clonal B-cell populations (clone A, clone B) present in LPL (upper panel) as identified by next-generation sequencing (NGS)-based clonality analysis and ARResT/Interrogate bioinformatics of consecutive LPL biopsies (case 5) (lower panels), demonstrating biclonal LPL that progressed to a clonal disease over time. The clonal gene rearrangements of IGHV-IGHD-IGHJ, IGHD-IGHJ, and IGKV/Intron-KDE are shown for the LPL biopsies taken at consecutive time points (T1, T2, T3). The relative abundance of each clonotype per indicated target is depicted on the y-axis and the junction amino acid (AA) length on the x-axis. A clonotype is defined by the 5′ and 3′ gene annotation and the junctional nucleotide sequence of the rearrangement. AA = amino acid; BM = bone marrow; HE = hematoxylin and eosin; IG = immunoglobulin; LPL = lymphoplasmacytic lymphoma; NGS = next-generation sequencing.
Figure 3.
Figure 3.
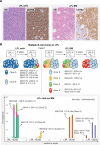
Temporal and spatial clonal B-cell dynamics in LPL biopsies at distinct anatomical locations. (A) Histology of 2 LPL biopsies at distinct anatomical locations (case 4), representing orbit (left panels) and bone marrow (BM) (right panels) stained with hematoxylin and eosin (H&E), or CD79a antibody. Images were taken at 200× magnification. (B) Schematic representation of the different clonal B-cell populations (clone A to clone E) and their relative frequencies present in LPL biopsies of the orbit (upper panel, left side; LPL-1 and LPL-3) or bone marrow (BM) (upper panel, right side; LPL-2, LPL-4, LPL-5) as identified by next-generation sequencing (NGS)-based clonality analysis and ARResT/Interrogate bioinformatics (case 4). Orbital and BM biopsies at T1 and T2 were taken at identical time points. The dominant clonotypes of IGK gene rearrangements (IGKV-IGKJ and IGKV/Intron-KDE) corresponding to the different B-cell clones are indicated in the lower panel. The relative abundance of each clonotype is depicted on the y-axis and the junction amino acid (AA) length on the x-axis. A clonotype is defined by the 5′ and 3′ gene annotation and the junctional nucleotide sequence of the rearrangement. AA = amino acid; BM = bone marrow; HE = hematoxylin and eosin; LPL = lymphoplasmacytic lymphoma; NGS = next-generation sequencing.
Figure 4.
Figure 4.
Establish clonal relationship of DLBCL and LPL tissue biopsies by NGS-based detection of IG gene rearrangements. (A) Next-generation sequencing (NGS)-based clonality analysis demonstrates that diffuse large B-cell lymphoma presentations are clonally related to antecedent LPL (2 representative cases: case 3 and case 6). Left panels show schematic representation of the malignant B-cell clones in the different tissue biopsies with the specific interval times indicated. Right panels depict the data from ARResT/Interrogate with the clonotype information of the predominant IGHV-IGHD-IGHJ or IGHD-IGHJ gene rearrangements, respectively. (B) NGS-based clonality assessment identifies clonally unrelated DLBCL occurrences in 2 LPL/WM patients (DLBCL-2 in case 7; DLBCL-1 and DLBCL-2 in case 13) where the dominant B-cell clones were not present in the reciprocal samples, thereby demonstrating de novo DLBCL occurrences in 2 out of 13 LPL/WM patients. Left panels show schematic representation of the B-cell clones in the different tissue biopsies with the specific interval times indicated. Right panels depict the data from ARResT/Interrogate with the clonotype information of the predominant IGHV-IGHD-IGHJ gene rearrangements. The relative abundance of each clonotype per indicated target is depicted on the y-axis and the junction amino acid (AA) length on the x-axis. A clonotype is defined by the 5′ and 3′ gene annotation and the junctional nucleotide sequence of the rearrangement. AA = amino acid; DLBCL = diffuse large B-cell lymphoma; IG = immunoglobulin; LPL = lymphoplasmacytic lymphoma; LPL/WM = lymphoplasmacytic lymphoma/ Waldenström macroglobulinemia; NGS = next-generation sequencing.
Figure 5.
Figure 5.
Summary of the clonal relationship between LPL and DLBCL presentations in LPL/WM study cohort. Clonal relationship of paired LPL and DLBCL tissue biopsies was established in 13 LPL/WM patients, in which next-generation sequencing (NGS)–based clonality assessment identified LPL- and DLBCL-specific dominant clonotype(s) in follow-up samples for each patient. Analyses revealed clonally related paired LPL-DLBCL tissue samples (n = 10; indicated in blue), and clonally unrelated LPL-DLBCL tissue samples (n = 3; indicated in red) based on the comparison of the most dominant clonotype(s) in each tissue. Some LPL samples showed inconclusive data due to inferior genomic DNA quality (indicated in gray). Circles indicate LPL biopsies and triangles DLBCL tissue biopsies. Location of biopsies are indicated: B, bone marrow; E, extranodal; I, immune privileged (central nervous system and testis); N, nodal. Per case (indicated on the y-axis), the time interval between biopsies is indicated in years on the x-axis. B = bone marrow; DLBCL = diffuse large B-cell lymphoma; E = extranodal; I = immune privileged; LPL = lymphoplasmacytic lymphoma; LPL/WM = lymphoplasmacytic lymphoma/ Waldenström macroglobulinemia; N = nodal; NGS = next-generation sequencing.
Figure 6.
Figure 6.
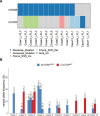
Overview MYD88 and CXCR4 status in LPL/WM study cohort. Targeted sequencing of MYD88 and CXCR4 in (consecutive) LPL biopsies of 11 LPL/WM patients. (A) The frequency of MYD88L265P and CXCR4mut in LPL biopsies, with inclusion of the type of mutation in case of CXCR4mut represented by different colors. (B) Variant allele frequencies (VAF) as detected by targeted sequencing (without correction tumor percentage) of MYD88L265P and CXCR4mut in LPL biopsies per case. LPL = lymphoplasmacytic lymphoma; LPL/WM = lymphoplasmacytic lymphoma/ Waldenström macroglobulinemia; VAF = variant allele frequencies.
Figure 7.
Figure 7.
Distribution of gene mutations in LPL and DLBCL tissue biopsies of LPL/WM study cohort. Targeted mutation analysis in paired LPL-DLBCL tissue biopsies of 10 LPL/WM patients, which involved 1 or 2 LPL samples of each patient and available DLBCL samples for which sufficient genomic DNA was available. Case numbers are depicted in chronological order and according to MYD88 status on the x-axis from left to right, with corresponding location of biopsy as indicated below. All identified mutations were checked for their presence in the corresponding paired LPL and DLBCL samples (Suppl. Table S6) but only depicted with a variant allele frequency (VAF) ≥5%. The type of mutation is indicated by different colors according to the legend below. Mult_hit involved 2 or more mutations per sample. DLBCL = diffuse large B-cell lymphoma; LPL = lymphoplasmacytic lymphoma; LPL/WM = lymphoplasmacytic lymphoma/ Waldenström macroglobulinemia; VAF = variant allele frequencies.
Figure 8.
Figure 8.
Integration genetic analysis indicates different clonal evolution models during histological transformation of LPL to DLBCL. Integrated analysis combining the outcome of IG-NGS clonality assessment and targeted gene mutations analysis shows that DLBCL transformation in antecedent LPL follows distinct patterns of clonal evolution. (A) Divergent clonal evolution: Two independent DLBCL neoplasms located at distinct anatomical locations (testis and skin) in 1 LPL/WM patient (case 3) developed after LPL transformation from an identical B-cell-of-origin based on identical IG gene rearrangements, but each DLBCL acquired distinct new mutations contributing to histological transformation. DLBCL-1 (testis) showed besides founder mutation MYD88L265P also CD79B and CARD11 gene mutations that were absent in DLBCL-2. On the contrary, DLBCL-2 acquired CD37 and BTG1 mutations, which were non-detectable in DLBCL-1. The tumor clone of DLBCL-2 was present in the antecedent LPL as a minor subclone by detecting the same CD37 mutation at a very low variant allele frequency in LPL (1.3%; see Suppl. Table S6). (B) Linear clonal evolution: transformation of either MYD88WTCXCR4MUT (case 10) or MYD88WTCXCR4WT (case 11) LPL into DLBCL is characterized by the acquisition of at least 2 TNFAIP3 and 2 CD79B gene mutations, respectively. Superscript * indicates a loss-of-function alteration (aberrant splicing, missense mutation leading to stop codon). DLBCL = diffuse large B-cell lymphoma; LPL = lymphoplasmacytic lymphoma; LPL/WM = lymphoplasmacytic lymphoma/ Waldenström macroglobulinemia.

References

    1. Vitolo U, Ferreri AJ, Montoto S. Lymphoplasmacytic lymphoma-Waldenstrom’s macroglobulinemia. Crit Rev Oncol Hematol. 2008;67:172–185. - PubMed
    1. Askari E, Rodriguez S, Garcia-Sanz R. Waldenstrom’s macroglobulinemia: an exploration into the pathology and diagnosis of a complex B-cell malignancy. J Blood Med. 2021;12:795–807. - PMC - PubMed
    1. Lin P, Mansoor A, Bueso-Ramos C, et al. . Diffuse large B-cell lymphoma occurring in patients with lymphoplasmacytic lymphoma/Waldenstrom macroglobulinemia clinicopathologic features of 12 cases. Am J Clin Pathol. 2003;120:246–253. - PubMed
    1. Leleu X, Soumerai J, Roccaro A, et al. . Increased incidence of transformation and myelodysplasia/acute leukemia in patients with Waldenstrom macroglobulinemia treated with nucleoside analogs. J Clin Oncol. 2009;27:250–255. - PubMed
    1. Castillo JJ, Gustine J, Meid K, et al. . Histological transformation to diffuse large B-cell lymphoma in patients with Waldenstrom macroglobulinemia. Am J Hematol. 2016;91:1032–1035. - PubMed