. 2023 Oct 19:11:1273641.
doi: 10.3389/fcell.2023.1273641. eCollection 2023.

Differential responses to maternal diabetes in embryo and visceral yolk sac

Affiliations

Differential responses to maternal diabetes in embryo and visceral yolk sac

J Michael Salbaum et al. Front Cell Dev Biol. .

Abstract

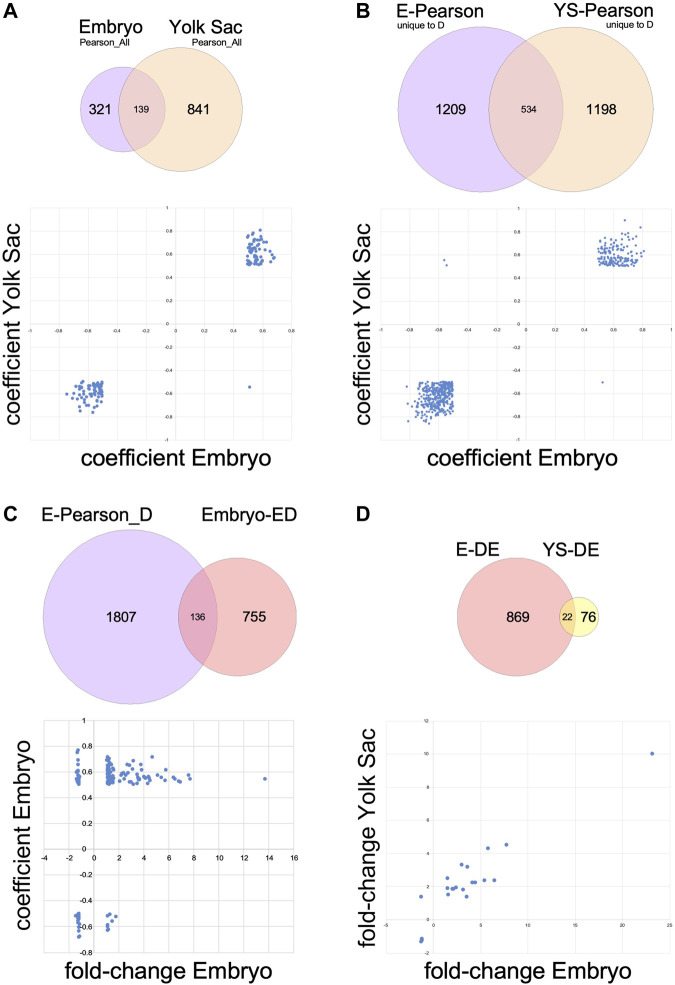
Introduction: Maternal diabetes during pregnancy is well known to be associated with a higher risk for structural birth defects in the offspring. Recent searches for underlying mechanisms have largely focused on aberrant processes in the embryo itself, although prior research in rodent models implicated dysfunction also of the visceral yolk sac. The objective of our research was to investigate both tissues within the conceptus simultaneously. Methods: We conducted unbiased transcriptome profiling by RNA sequencing on pairs of individual yolk sacs and their cognate embryos, using the non-obese diabetic (NOD) mouse model. The analysis was performed at gestational day 8.5 on morphologically normal specimen to circumvent confounding by defective development. Results: Even with large sample numbers (n = 33 in each group), we observed considerable variability of gene expression, primarily driven by exposure to maternal diabetes, and secondarily by developmental stage of the embryo. Only a moderate number of genes changed expression in the yolk sac, while in the embryo, the exposure distinctly influenced the relationship of gene expression levels to developmental progression, revealing a possible role for altered cell cycle regulation in the response. Also affected in embryos under diabetic conditions were genes involved in cholesterol biosynthesis and NAD metabolism pathways. Discussion: Exposure to maternal diabetes during gastrulation changes transcriptomic profiles in embryos to a substantially greater effect than in the corresponding yolk sacs, indicating that despite yolk sac being of embryonic origin, different mechanisms control transcriptional activity in these tissues. The effects of maternal diabetes on expression of many genes that are correlated with developmental progression (i.e. somite stage) highlight the importance of considering developmental maturity in the interpretation of transcriptomic data. Our analyses identified cholesterol biosynthesis and NAD metabolism as novel pathways not previously implicated in diabetic pregnancies. Both NAD and cholesterol availability affect a wide variety of cellular signaling processes, and can be modulated by diet, implying that prevention of adverse outcomes from diabetic pregnancies may require broad interventions, particularly in the early stages of pregnancy.

Keywords: RNA-seq; diabetic pregnancy; neural tube defect; non-obese diabetic mouse strain; somite number; somite stage; visceral yolk sac.


Conflict of interest statement

The authors declare that the research was conducted in the absence of any commercial or financial relationships that could be construed as a potential conflict of interest.

Figures

FIGURE 1
FIGURE 1
Characteristics of Pregnancies: Litter size and somite counts. This study comprised samples from 10 normoglycemic pregnancies and 12 diabetic pregnancies. (A) Litter sizes were not significantly different between metabolic conditions. (B) Somite counts of individual embryos recovered from each pregnancy. While the overall spread of somite counts was larger across all diabetic pregnancies, there was no significant difference in the spread of somite stages/individual pregnancy when normal and diabetic conditions were compared. Only embryos with between 5 and 9 somite pairs (green outlines) were included in the transcriptome analyses, with selection for inclusion in the study depending on RNA amounts recovered and RNA quality, as well as quality of the sequencing library. (C) Somite counts and litter size are plotted relative to the blood glucose level of pregnant diabetic dams at the time of euthanasia. There was no correlation of either somite number/embryo (coefficient R2 = 0.0006), spread of somite counts within a pregnancy (R2 = 0.0078, not shown) or litter size (R2 = 0.06, not shown) to maternal blood glucose level in diabetic pregnancies.
FIGURE 2
FIGURE 2
Genes with significantly different expression in yolk sacs and embryos from normal and diabetic pregnancies. Raw sequence data were processed as described in the Methods section, and normalized read counts based upon Unique Molecular Identifiers (UMI) were subjected to comparisons with DESeq2 software; comparisons with adjusted p-value smaller than 0.1 were considered indicative of differential gene expression. Hierarchical clustering was performed in Cluster 3 separately for yolk sac and embryo samples, and visualized as heat maps in TreeView, respectively. Red color intensity represents the extent of fold-change increase in diabetes-exposed relative to normal samples, and green color intensity depicts the fold-change decrease; grey indicates non-significant fold-change in a given sample. Orange shading identifies data from diabetes-exposed specimen. (A) 98 IDs passed the significance criteria in comparisons including 33 yolk sac samples for each metabolic condition. (B) 891 IDs passed the significance criteria in comparisons of embryo samples.
FIGURE 3
FIGURE 3
Principal Component Analyses identify metabolic condition and developmental stage as major drivers of gene expression in E8.5 embryos. PCA was performed using the R computing platform and the FactoMiner software module. (A) Based upon 891 differentially expressed genes, the contribution of the strongest component, Dimension 1, accounts for 26.4% of the overall variation; coloring of samples by known metabolic state of the originating pregnancy identifies the exposure to maternal diabetes as explanatory factor for Dimension 1. (B) The same PCA plot colored for the number of somite pairs in each embryo from 5 to 9, with smaller numbers represented in lighter, and larger numbers in darker color. This graph identifies developmental stage as Dimension 2, contributing 11.4% of the variation. (C) Coloring for embryonic sex did not reveal any influence of the two components shown, nor of 8 additional dimensions tested (up to Dimension 10, data not shown). (D) PCA analysis based upon 460 genes with strong Pearson correlation to somite stage, colored for metabolic condition. This diagram identifies the exposure to maternal diabetes as discriminating factor along Dimension 2, explaining 7.6% of the variation among clustering based upon somite stage. (E) The same PCA plot colored for somite state displays strong separation of samples long Dimension 1, which explains 40.4% of the results driven by the factor developmental age. (F) Coloring for embryonic sex again did not reveal any influence in up to 10 Dimensions (data not shown).
FIGURE 4
FIGURE 4
Principal Component Analyses of results for visceral yolk sac samples from E8.5 embryos. (A–C): PCA for yolk sac samples based upon 98 differentially expressed genes, with coloring scheme analogous to Figure 2. (A) The exposure to maternal diabetes is revealed as the major component that accounts for 25.3% of overall variation (B) The distribution of samples along Dimension 2, which contributes 12.3% of the variation, only moderately discriminates samples based upon somite stage, likely because of the very small number of underlying genes. (C) Sex of the samples was not a discriminating factor in the two dimensions shown, nor any other tested (up to Dimension 10, data not shown). Panels (D,E): PCR based upon 980 genes with strong Pearson coefficients for correlation with the number of somite pairs in the cognate embryo for each yolk sac sample. (D) Although more diabetes-exposed samples appear in the negative space of Dimension 2, the difference to the number of normal samples in the same area was not significant. (E) Coloring of the same diagram for somite stage reveals discrimination of samples along Dimension 1, highlighting developmental stage as the major explanatory factor in this dataset. (F) As before, sex of the cognate embryo was not a discriminating factor along all 10 dimensions tested (data not shown).
FIGURE 5
FIGURE 5
Interaction of exposure to maternal diabetes with developmental stage-related gene expression. Pearson correlation coefficients for each gene relative to the number of somite pairs were calculated based on all 66 samples (Pearson_All), and for the 33 samples from normal pregnancies (Pearson_N) and from the 33 samples from diabetic pregnancies (Pearson_D) separately. (A–D): Results for Embryo samples. (A) The histogram for gene expressed in embryos shows the distribution of Pearson coefficients from −1 to +1, with anti-correlations on the left side, and positive correlations on the right side of the graph. Green stippled lines show the cutoff for selection as strongly anti-correlated (from −1 to −0.5) and strongly correlated (from +0.5 to +1) genes. Note the flatter and wider distribution of coefficient values in diabetes-exposed samples, which results in a larger number of genes fulfilling the cut-off criteria. Panel (B) Example of a gene (Nr2f1: encoding transcription factor COUP-TF1) strongly correlated to somite stage (dotted lines; black: normal condition, red: diabetes condition). (C) Example of a gene strongly anti-correlated to somite stage (Hif1a: encoding hypoxia-inducible factor 1 alpha), again with stronger correlation in diabetes-exposed samples. (D) The table for embryo samples also displays a larger number of genes with coefficients fulfilling the selection criteria in diabetes-exposed samples, highlighting that well over 1,000 genes are uniquely correlated/anti-correlated to developmental stage in embryos exposed to conditions of maternal diabetes during pregnancy. Panels (E–H): Analogous results for Yolk Sac samples. (E) The distribution of Pearson coefficients for yolk sac samples also displays flatter and wider distribution of coefficient values in diabetes-exposed samples, which results in a larger number of genes fulfilling the cut-off criteria. (F) Example of a gene (Aldh7a1: aldehyde dehydrogenase family 7, member A1) strongly correlated to somite stage. (G) Example of a gene strongly anti-correlated to somite stage (DDx19a: DEAD-box helicase 19a). (H) The table for yolk sac samples also displays a larger number of genes with coefficients fulfilling the selection criteria in diabetes-exposed samples, again highlighting a unique effect of maternal diabetes on developmental progression in yolk sac samples.
FIGURE 6
FIGURE 6
Relationships of transcriptome changes in corresponding embryo and yolk sac tissues. Underlying datasets used in the comparisons are shown in Venn diagrams; the plots in the lower half of each panel feature data represented in the overlap of the circles. (A) Genes expressed in both embryo and yolk sac that are correlated or anti-correlated with somite stage according to Pearson correlations calculated over all 66 samples in each tissue (Pearson_All). In 138 out of 139 cases, the relationship of expression level to somite stage is congruent between embryo and yolk sac. (B) Genes expressed in both embryo and yolk sac that are somite stage-correlated only in diabetes exposure conditions (genes also correlated in samples from normal conditions were removed from these datasets). For all but three genes out of 534, the relationship of expression level to somite stage is congruent between embryo and yolk sac. (C) Genes with differential expression in the comparison of embryos exposed to maternal diabetes to normal embryos that are also uniquely affected by maternal diabetes in their correlation to somite stage. As expected, this dataset contains genes that are positively correlated or anti-correlated (separated along the Y-axis), with increased or decreased expression levels in diabetes-exposed embryos (X-axis). (D) Genes with differential expression upon diabetes exposure that are expressed in both embryos and yolk sacs. Generally, the direction of change after exposure to maternal diabetes is congruent between yolk sac and cognate embryo, except for one gene (in the lower portion of the upper left quadrant).
FIGURE 7
FIGURE 7
Coordination of the response to diabetes-exposure between yolk sacs and their cognate embryos. Composite scores for yolk sac and embryo genes that are differentially expressed after exposure to maternal diabetes were taken from Dimension 1 (value along the X-axis) of the PCA analyses depicted in Panels A of Figures 3 (for embryo data) and 4 (for yolk sac data), respectively. Individuals from normal pregnancies (black) cluster largely in the upper right quadrant of the graph, while individuals from diabetic pregnancies (red) cluster predominantly in the lower left quadrant. Note the larger scatter for diabetes-exposed individuals. Proximity to the regression line conveys the overall correspondence of changes in yolk sac and embryo from the same individual, as far as captured by the PCA composite score.
FIGURE 8
FIGURE 8
Exposure to maternal diabetes alters the relationship of gene expression level to somite stage Pearson coefficients were plotted for selected genes in a comparison between mormal and diabetes exposed embryo samples. (A) Hox genes with correlation to somite number between |1 to 0.5|; exposure to maternal diabetes decreases correlation coefficients for all Hox genes depicted. (B) Genes with positive coefficients in the normal condition are plotted on the left half of the graph, genes with anti-correlation to the right side. Coefficient values in the normal condition are given in blue, coefficient values in diabetes exposure conditions are plotted vertically, with deviation from normal indicated in orange. Weakening of correlations (towards coefficients close to 0) is evident for normally correlated and anti-correlated genes; strengthening of correlations is less prevalent. (C) Example of a gene, encoding the mouse Timeless homolog, where a normally (black) positive correlation to somite number is turned into negative correlation upon diabetes exposure (red). (D) Example of a gene, encoding BTG3-associated nuclear protein Banp, where a normally anti-correlated gene is switched into positive correlation by diabetes exposure.

References

    1. Birot A., Duret L., Bartholin L., Santalucia B., Tigaud I., Magaud J., et al. (2000). Identification and molecular analysis of BANP. Gene 253, 189–196. 10.1016/s0378-1119(00)00244-4 - DOI - PubMed
    1. Cuny H., Bozon K., Kirk R. B., Sheng D. Z., Broer S., Dunwoodie S. L. (2023). Maternal heterozygosity of Slc6a19 causes metabolic perturbation and congenital NAD deficiency disorder in mice. Dis. Model Mech. 16 (5), dmm049647. 10.1242/dmm.049647 - DOI - PMC - PubMed
    1. Cuny H., Rapadas M., Gereis J., Martin E., Kirk R. B., Shi H., et al. (2020). NAD deficiency due to environmental factors or gene-environment interactions causes congenital malformations and miscarriage in mice. Proc. Natl. Acad. Sci. U. S. A. 117, 3738–3747. 10.1073/pnas.1916588117 - DOI - PMC - PubMed
    1. de Hoon M. J., Imoto S., Nolan J., Miyano S. (2004). Open source clustering software. Bioinformatics 20, 1453–1454. 10.1093/bioinformatics/bth078 - DOI - PubMed
    1. Dobin A., Davis C. A., Schlesinger F., Drenkow J., Zaleski C., Jha S., et al. (2013). STAR: ultrafast universal RNA-seq aligner. Bioinformatics 29, 15–21. 10.1093/bioinformatics/bts635 - DOI - PMC - PubMed