Review
. 2023 Oct 18;8(43):39984-40004.
doi: 10.1021/acsomega.3c05728. eCollection 2023 Oct 31.

Surface Treat Method to Improve the Adhesion between Stainless Steel and Resin: A Review

Affiliations
Review

Surface Treat Method to Improve the Adhesion between Stainless Steel and Resin: A Review

Bing Du et al. ACS Omega. .

Abstract

Combining metal and polymer into hybrid composite materials is finding increasing interest in many industries. Special attention is being paid to increase the adhesion between the metal and polymer interface. In this paper, the current research progress of surface treatment methods for improving the interfacial adhesion of stainless steel and resin is reviewed. It involves the stainless steel surface treatment method, resin surface treatment method, and adhesion test methods of stainless steel and resin. The methods of improving the interfacial adhesion of stainless steel and resin are summarized and prospected according to the research status.


Conflict of interest statement

The authors declare no competing financial interest.

Figures

Figure 1
Figure 1
Surface treatment method.
Figure 2
Figure 2
(a) Silane hydrolysis mechanism, (b) IR spectra of cleaned, acid-pickled, oxidized at 500 °C for 30 min, and silane-coated SS plates with parameters P and F, and (c) TEM image of the SS/PPS interface of a joint welded with a mesh coated with parameter F, reproduced with permission from Rohart et al. Copyright 2020, Elsevier Ltd.
Figure 3
Figure 3
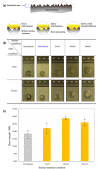
Surface height of specimens treated with different microarc oxidation times: (a) 0, (b) 10, (c) 20, and (d) 30 min, image courtesy of Zhao.
Figure 4
Figure 4
(a) Surface morphologies of SS mesh etched for different te, , (b) SS wire diameter and tensile strength retention rate for different t, and (c) contact angle of the SS wire against water, image courtesy of Zhao.
Figure 5
Figure 5
Schematic diagram of the experimental setup for plasma jets: (a) schematic diagram of the experimental setup for plasma jets, (b) image of the discharge (jet) during polymer treatment, and (c) image of the discharge (jet) during an electrical characterization, reproduced with permission from Baniya et al. Copyright 2021, Scrivener Publishing LLC.
Figure 6
Figure 6
(a) Schematic of CNT-grafted SSM; (b) SEM and TEM micrographs of CNTs; image courtesy of Xiong et al. (c) SEM images of CNTs on the SS wire, (d) EDX spectrum of nickel element intensity on the CNT array, and (e) Raman spectra of CNTs at tg = 10, 15, and 20 min, reproduced with permission from Xiong et al. Copyright 2021, Taylor. & Francis.
Figure 7
Figure 7
(a) Cross-sectional view of sandblasted steel substrate, (b) top view of small epoxy droplets on five different substrate surfaces, and (c) shear strength measured by SLS tests on the grit-blasted surfaces with 0, 5, 10, and 20 wt % of resin–acetone solutions. Reproduced with permission from Wang et al. Copyright 2016, Elsevier Ltd.
Figure 8
Figure 8
(a) Schematic diagram of laser joining, (b) TEM image of the interface between COP and SU304, and (c) C 1s spectra of COP, reproduced with permission from Arai et al. Copyright 2014, Elsevier Ltd.
Figure 9
Figure 9
(a) Schematic diagram of the welding, (b) SEM images of film, (c) tensile strength of film, and (d) fiber-reinforced resin composite film for enhancing the strength of the welded interface. Image courtesy of Cui et al.
Figure 10
Figure 10
(a) Synthesis strategy of P(GMA-co-DOPAm), (b) C/O ratio of SUS (red line) and Al (black line) plates with various immersion durations, (c) surface morphology of SUS sample, and (d) microscope observation of the adhesion area in SUS joints; image courtesy of Zhang et al.
Figure 11
Figure 11
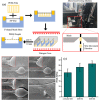
(a) Schematic illustration of the preparation of microbond test samples, (b) fracture morphology of PEEK droplets on the SS wires, and (c) IFSS results. Image courtesy of Li et al.
Figure 12
Figure 12
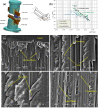
Fracture surfaces of welded joints after lap shear tests for (a1), (a2) untreated SSM; (b1), (b2) SSM-SA; (c1), (c2) SSM-NG, and (d1), (d2) SSM-SiG; (e) LSS testing; (f) LSS of untreated SSM, SSM-SA, SSM-NG, and SSM-SiG welded joints, image courtesy of Li.
Figure 13
Figure 13
(a) Schematic representation of resistance welding operations for double-lap shear joints, (b) schematic representation of a DLS specimen and picture of the test setup, (c) load–displacement curves of double-lap shear specimens, and (d) typical fracture surface of CF/PEKK DLS specimens tested under fatigue loading. Image courtesy of Dubé.
Figure 14
Figure 14
(a) Diagram of the adhesive tensile specimen, (b) tensile adhesive strength with respect to GFs concentrations, reproduced with permission from Liu et al. Copyright 2021, Elsevier Ltd.
Figure 15
Figure 15
Three modes of fracture: (a) mode I crack extension; (b) mode II crack extension; (c) mode III crack extension. Image courtesy of Wang.
Figure 16
Figure 16
(a) Mode I interlaminar fracture toughness test setup (DCB specimen with loading blocks and with piano hinges), reproduced with permission form Sharma et al. Copyright 2020 Iran Polymer and Petrochemical Institute; (b) DCB experimental process diagram; (c) mean fracture toughness. Image courtesy of Wang.
Figure 17
Figure 17
(a) Mode II interlaminar fracture toughness test setup (ENF specimen), reproduced with permission form Sharma et al. Copyright 2020, Iran Polymer and Petrochemical Institute. (b) ENF test fixture and (c) mode II fracture toughnesses obtained for considered GFRP laminate by using different data reduction schemes for PC and NPC specimens; image courtesy of Gliszczynski and Wiącek.
Figure 18
Figure 18
(a) Mode III fracture test device, (b) results of all tests performed for all three materials at different percentages of the maximum torque, and (c) micrographs of different materials. Image courtesy of Bertorello et al.

References

    1. Jin Z.; Han Z.; Chang C.; et al. Review of methods for enhancing interlaminar mechanical properties of fiber-reinforced thermoplastic composites: Interfacial modification, nano-filling and forming technology. Compos. Sci. Technol. 2022, 228, 109660.10.1016/j.compscitech.2022.109660. - DOI
    1. Rajak D. K.; Pagar D. D.; Menezes P. L.; et al. Fiber-reinforced polymer composites: Manufacturing, properties, and applications. Polymers 2019, 11 (10), 1667.10.3390/polym11101667. - DOI - PMC - PubMed
    1. Yao S. S.; Jin F. L.; Rhee K. Y.; et al. Recent advances in carbon-fiber-reinforced thermoplastic composites: A review. Composites Part B: Engineering 2018, 142, 241–250. 10.1016/j.compositesb.2017.12.007. - DOI
    1. Khan R. Fiber bridging in composite laminates: A literature review. Composite Structures 2019, 229, 11141810.1016/j.compstruct.2019.111418. - DOI
    1. Zhang J.; Chevali V. S.; Wang H.; et al. Current status of carbon fibre and carbon fibre composites recycling. Composites Part B: Engineering 2020, 193, 10805310.1016/j.compositesb.2020.108053. - DOI