. 2024 Jan 20;33(3):254-269.
doi: 10.1093/hmg/ddad178.

Two zebrafish cacna1s loss-of-function variants provide models of mild and severe CACNA1S-related myopathy

Affiliations

Two zebrafish cacna1s loss-of-function variants provide models of mild and severe CACNA1S-related myopathy

Yukari Endo et al. Hum Mol Genet. .

Abstract

CACNA1S-related myopathy, due to pathogenic variants in the CACNA1S gene, is a recently described congenital muscle disease. Disease associated variants result in loss of gene expression and/or reduction of Cav1.1 protein stability. There is an incomplete understanding of the underlying disease pathomechanisms and no effective therapies are currently available. A barrier to the study of this myopathy is the lack of a suitable animal model that phenocopies key aspects of the disease. To address this barrier, we generated knockouts of the two zebrafish CACNA1S paralogs, cacna1sa and cacna1sb. Double knockout fish exhibit severe weakness and early death, and are characterized by the absence of Cav1.1 α1 subunit expression, abnormal triad structure, and impaired excitation-contraction coupling, thus mirroring the severe form of human CACNA1S-related myopathy. A double mutant (cacna1sa homozygous, cacna1sb heterozygote) exhibits normal development, but displays reduced body size, abnormal facial structure, and cores on muscle pathologic examination, thus phenocopying the mild form of human CACNA1S-related myopathy. In summary, we generated and characterized the first cacna1s zebrafish loss-of-function mutants, and show them to be faithful models of severe and mild forms of human CACNA1S-related myopathy suitable for future mechanistic studies and therapy development.

Keywords: Cav1.1; congenital myopathy; excitation contraction coupling; zebrafish.


Figures

Figure 1
Figure 1
Generation of cacna1s mutant fish. (A) Schematic workflow of establishing cacna1s trans heterozygous mutants. sgRNA-1 was used for cacna1sa gene editing and sgRNA-2 for cacna1sb. The sequences of the gRNAs are described in the methods and Supplementary Fig. S1. (B) Schematics showing domains of Cacna1sa and Cacna1sb proteins and the obtained mutations. Yellow: transmembrane domain, Green: EF-hand domain, Blue (Ca chan IQ): voltage gated calcium channel IQ domain. (C) Progeny achieved by crossing cacna1s-dHet mutants. (D) mRNA levels of cacna1sa and cacna1sb in 6 dpf fish pools (WT; n = 5, aKO; n = 4, bKO; n = 4, dKO; n = 5). Values are Mean ± SEM (fold); cacna1sa: WT (1.00 ± 0.09), aKO (0.20 ± 0.01), bKO (0.59 ± 0.07), dKO (0.20 ± 0.04); cacna1sb: WT (1.00 ± 0.14), aKO (1.08 ± 0.10), bKO (0.13 ± 0.01), dKO (0.15 ± 0.03). Statistical analysis was performed using one-way ANOVA followed by Dunnett’s multiple comparisons test with P < 0.01 (**), P < 0.0001(****) or non-significance (ns).
Figure 2
Figure 2
Characterization of cacna1s mutant larvae. (A) Representative bright field images of 4 dpf embryos. A total of 10 embryos per group were imaged. cacna1s-dKO larvae exhibited curved body axis. Scale bars = 1 mm. (B) Representative snapshots of touch-evoked response of 4 dpf larvae. A total of five fish per group were captured for video. WT zebrafish swim away rapidly after touch stimulation, while cacna1s-dKO showed no response or movement (see also Supplement Movies). (C) Quantification of motor ability of mutant fish (6 dpf). Total distance traveled during photochemical activation was normalized to the average of WT siblings and plotted (WT; n = 48, dHet; n = 136, aKO; n = 42, aKO-bHet; n = 69, bKO; n = 43, dKO; n = 28). Values are Mean ± SEM (mm); WT (1.00 ± 0.04), dHet (0.92 ± 0.02), aKO (1.02 ± 0.04), aKO-bHet (0.89 ± 0.03), bKO (0.74 ± 0.04), dKO (0.00 ± 0.00). Statistical analysis by one-way ANOVA followed by Dunnett’s multiple comparisons tests where P < 0.05 (*) and P < 0.0001 (****). (D) Kaplan-Meier curve showing reduced survival in cacna1s-dKO (n = 21, median survival = 9 days) and cacna1s-bKO (n = 19, median survival = 9 days, gray), but not in cacna1s-dHet (n = 23), cacna1s-aKO-bHet (n = 19), cacna1s-aKO (n = 14) or WT siblings (n = 26). Log-rank test: WT vs dKO; P < 0.0001, WT vs bKO; P < 0.0001, WT vs aKO; P = 0.2830, WT vs dHet; P = 0.1171, WT vs aKO-bHet; P = 0.1213.
Figure 3
Figure 3
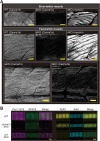
Expression and localization of Cav1.1 and other ECC components in cacna1s mutant Fish. (A) Whole-mount immunofluorescence of 4 dpf larvae. In cacna1s-dKO, Cav1.1 was not detected in either slow or fast muscle, while myosin striations were normally observed. The cacna1s-bKO did not express Cav1.1α1S in fast-twitch muscle, whereas cacna1s-aKO expressed Cav1,1 in both fast and slow twitch muscle. Fiber types were distinguishable by their orientations; superficial slow-twitch fibers aligned parallel to the anterior-posterior axis, while deep fast-twitch fibers angled slightly toward the midline. Scale bars = 20 μm. A total of 8 zebrafish per group were analyzed. (B) Representative images of IF staining on isolated myofibers from 5 dpf larvae. In cacna1s-dKO, not only Cav1.1 but also STAC3 expression was diminished, while RyR1 was detected at the SR cisternae with slightly reduced expression. In ryr1-dKO, co-expression of Cav1.1 and STAC3 was observed with fainter signals than that of WT, and no RyR1 expression was detected. Scale bars = 5 μm. A total of 10 myofibers per group were imaged.
Figure 4
Figure 4
Ultrastructural analysis of cacna1s-dKO muscle. (A) Representative images of electron micrographs of WT, cacna1s-dKO, and ryr1-dKO at 5 dpf. Myofibrils were well-organized and triads were aligned regularly at the sarcomere Z-lines in WT and both mutants. Arrows show enlarged longitudinal SR in ryr1-dKO. Scale bars = 500 nm. A total of 4 larvae per group were analyzed. (B) Representative images of triad structure at higher magnification. In cacna1s-dKO, T-tubules were enlarged and the gaps between T-tubule and SR were extremely narrow compared to WT. Scale bars = 100 nm. (C) A diagram showing the elements measured. d; minor axis of T-tubule luminal dimension, e; major axis of T-tubule luminal dimension, f; area of T-tubule luminal dimension, g; distance between SR terminal cisternae and T-tubule, h; Distance between SR terminal cisternae, i; width of SR terminal cisternae. (D–K) lengths and areas indicated in (C) were measured and plotted, revealing T-tubules in both cacna1s-dKO and ryr1-dKO expanded toward SR in triads. Numbers of triad evaluated in (D–K) were as following: WT; n = 91, cacna1s-dKO; n = 56, and ryr1-KO; n = 56. All values are Mean ± SEM (see Supplementary Table S1). Differences were analyzed by Tukey’s multiple comparisons test and considered to be statistically significant at P < 0.05 (*), P < 0.01 (**), P < 0.001 (***) or P < 0.0001(****).
Figure 5
Figure 5
Electrically-evoked and caffeine-induced Ca2+ release in fibers from cacna1s-dKO zebrafish. (A) Representative diagram of Ca2+ transient traces with a 10 Hz stimulation on wild type (WT) and cacna1s-dKO myofibers dissociated from 5 dpf larvae. (B) Histogram showing that average (±SE) peak change in relative fluo-4 fluorescence (ΔF/F) during 10-Hz stimulation is reduced in cacna1s-dKO fibers compared to that of WT fibers (t-test, P = 0.016). WT: fiber average across n = 4 zebrafish; cacna1s-dKO: fiber average across n = 5 zebrafish. (C) Representative diagram of Ca2+ transient traces with an application of 10 mM caffeine on myofibers dissociated from 5 dpf larvae. (D) Histogram showing that average (±SE) peak change in relative fluo-4 fluorescence (ΔF/F) is increased in cacna1s-dKO fibers in response to exposure to 10 mM caffeine compared with that of WT fibers (t-test, P = 0.018). WT: fiber average across n = 4 zebrafish; cacna1s-dKO: fiber average across n = 5 zebrafish. Intracellular Ca2+ dynamics were quantified from relative peak change of fluo-4 fluorescence from baseline (ΔF/F). Data are represented as mean ± SEM. The differences were analyzed by unpaired t-test and considered to be statistically significant at P < 0.05 (*), or P < 0.001 (***).
Figure 6
Figure 6
Characterization of adult cacna1s mutants. (A) Representative appearance of 7 months-old fish. cacna1s-aKO and cacna1s-aKO-bHet fish were smaller than WT, with cacna1s-aKO-bHet showing protruding jaw (arrow). Scale bar = 5 mm. (B) Schematic showing standard length, total length, and body depth measurements. (C) Standard length, total length, and body depth were measured and plotted; WT siblings (n = 15), dHet (n = 10, green), aKO (n = 11) and aKO-bHet (n = 13). All values are mean ± SEM (see Supplementary Table S1). Differences were analyzed by Tukey’s multiple comparisons test and considered to be statistically significant at P < 0.05 (*), P < 0.01 (**) P < 0.001 (***) or P < 0.0001(****).
Figure 7
Figure 7
Molecular analyses of cacna1s-aKO-bHet zebrafish mutants. (A) mRNA levels of cacna1sa were markedly reduced but cacna1sb were not significantly different in adult cacna1s-aKO-bHet at 4 months of age. A total of 6 biological independent samples per group were analyzed. Values are Mean ± SEM (fold); cacna1sa: WT (1.00 ± 0.22), aKO-bHet (0.15 ± 0.02); cacna1sb: WT (1.00 ± 0.17), aKO-bHet (0.66 ± 0.09). Statistical analysis was performed using by unpaired t test where P < 0.01 (**) or non-significance (ns). (B) Representative Western blot for Cav1.1, STAC3, RyR1, Jph1 with myosin heavy chain as a myofibril marker and GAPDH as an internal control. A total of 8 samples (4 months old) per group were used for analyses. One blot was used for probing Cav1.1α1S, Jph1 and GAPDH, and the other blot was used for STAC3 and myosin with stripping between each process. RyR1 was processed in parallel with the same samples as used on the other two blots. A total of 8 samples per group were used for analyses and full images of the probed blots are provided in Supplementary Fig. S5. (C) Quantifications of protein expression levels, normalized to total protein (loading control) and myosin (muscle mass control), and plotted by fold changes relative to the average of WT on the same blots. WT (n = 7) vs cacna1s-aKO-bHet (n = 8). All values are Mean ± SEM (fold); Cav1.1: WT (1.00 ± 0.08), aKO-bHet (0.98 ± 0.06); STAC3: WT (1.00 ± 0.11), aKO-bHet (0.91 ± 0.05); RyR1: WT (1.00 ± 0.12), aKO-bHet (1.00 ± 0.10); Jph1: WT (1.00 ± 0.12), aKO-bHet (0.69 ± 0.09). Statistical analysis was performed using unpaired t-test and P values were noted on graphs.
Figure 8
Figure 8
Histopathological analyses on cacna1s-aKO-bHet. (A) In cacna1s-aKO-bHet at 16 months of age, there were occasional hypotrophic fibers in the fast twitch muscle compartment, while all slow twitch muscle was relatively uniformly sized. Toluidine blue (TB) staining revealed striking core structures (arrows) in fast twitch fibers in male mutants with dusty stained sarcoplasm. Scale bars = 20 μm. A total of 4 samples (2 female, 2 male) per group were used for analyses. (B) cacna1s-aKO-bHet showed a marked reduction in deep myofiber size as measured by minimum Feret’s diameter. WT (n = 4, 1 section per individual) and cacna1s-aKO-bHet (n = 4, 1 section per individual) at 16 months of age were analyzed and total fibers measured across four different sections per group were as follows; WT: n = 837 (217 + 214 + 222 + 184), aKO-bHet: n = 1408 (310 + 323 + 360 + 415). Mean minimum Feret’s diameter in each section was calculated and plotted. Values are mean ± SEM (μm); WT (30.96 ± 0.67), aKO-bHet (21.36 ± 0.50). Statistical analysis was performed using unpaired t-test and considered to be statistically significant at P < 0.0001 (****). (C) Percentage distribution of minimum Feret’s diameter in deep muscle. The pattern of percentage distribution in aKO-bHet is left-shifted (i.e. shifted toward smaller fiber size) compared to that in WT. Sample size is the same as (B). Values are Mean ± SEM. % myofiber size distribution ± SEM for <10 μm/10–20 μm/20–30 μm/30–40 μm/40–50 μm/50–60 μm/>60 μm bins are: WT; 0.25 ± 0.14/8.45 ± 2.42/35.55 ± 2.17/42.49 ± 4.50/12.85 ± 2.53/0.27 ± 0.27/0.14 ± 0.14, aKO-bHet; 7.46 ± 1.38/39.25 ± 2.60/36.68 ± 2.55/15.09 ± 3.07/1.52 ± 0.54/0.00 ± 0.27/0.00 ± 0.00.
Figure 9
Figure 9
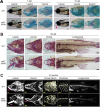
Morphological analysis on cacna1s-aKO-bHet. (A) At 7dpf, bright field (left) and alcian blue staining images (middle and right) showed no obvious difference between WT and aKO-bHet mutants in mandible development. At 10 dpf, aKO-bHet mutants could be recognized by protruding jaw (arrow). Meckel’s cartilage of mutants were dislocated as dropping in the lateral view of alcian blue staining, and ceratohyal angle (asterisk) of mutants was narrower than that of WT. The angle between the two ceratohyal elements is highlighted (right most panels, chevron shaped line). Abbreviations: m, Meckel’s cartilage; Ch, ceratohyal bone. Scale bars: 200 μm. A total of 8 larvae per group were imaged. (B) Representative imaging of WT and aKO-bHet stained with alizarin red at 28 dpf. Lateral view of mutant revealed the jaw joint (arrow) positioned upward therefore the dentary bones downturned. The ossification of the craniofacial bones in upper jaw and skull (dashed lines in lateral and dorsal views) were severely decreased in aKO-bHet mutants compared to WTs. The ceratohyal angle (asterisk) of mutants was narrower than that of WT, and non-progressive compared to that of 10 dpf. There was no difference in spinal formation and mineralization between WT and mutants, while vertebrae and fin rays of mutants were thinner than that of WT in the longitudinal view. Abbreviations: den, dentary bone. Scale bars: 500 μm. A total of 8 samples per group were imaged. (C) The micro-CT reconstruction images of WT and aKO-bHet mutant at the age of 14 months. Lateral view of mutant exhibited that the dentary bone was dislocated with increased calcification and irregular margins, and that upper jaw elements were smaller than that of WT. Ventral view of mutant showing significantly narrowed snout, mouth, and jaw due to the deformity of mandibular bones. Dorsal view of mutant’s skulls displays a lower density compared to WT. The vertebrae and spine of mutant were thin and shortened, corresponding to the body size. Abbreviations: den, dentary bone. Scale bars: 1 mm. A total of 2 samples per group were analyzed.

References

    1. Campiglio M, Dyrda A, Tuinte WE. et al. Ca(V)1.1 calcium channel signaling complexes in excitation-contraction coupling: insights from channelopathies. Handb Exp Pharmacol 2023;279:3–39. - PubMed
    1. Ríos E, Pizarro G. Voltage sensor of excitation-contraction coupling in skeletal muscle. Physiol Rev 1991;71:849–908. - PubMed
    1. Linsley JW, Hsu IU, Groom L. et al. Congenital myopathy results from misregulation of a muscle Ca2+ channel by mutant Stac3. Proc Natl Acad Sci U S A 2017;114:E228–e236. - PMC - PubMed
    1. Polster A, Nelson BR, Olson EN. et al. Stac3 has a direct role in skeletal muscle-type excitation-contraction coupling that is disrupted by a myopathy-causing mutation. Proc Natl Acad Sci U S A 2016;113:10986–91. - PMC - PubMed
    1. Miller TM, Dias da Silva MR, Miller HA. et al. Correlating phenotype and genotype in the periodic paralyses. Neurology 2004;63:1647–55. - PubMed

Publication types