. 2024 Jan 1;221(1):e20230279.
doi: 10.1084/jem.20230279. Epub 2023 Nov 6.

Stem cell-like reprogramming is required for leukemia-initiating activity in B-ALL

Affiliations

Stem cell-like reprogramming is required for leukemia-initiating activity in B-ALL

Vincent Fregona et al. J Exp Med. .

Abstract

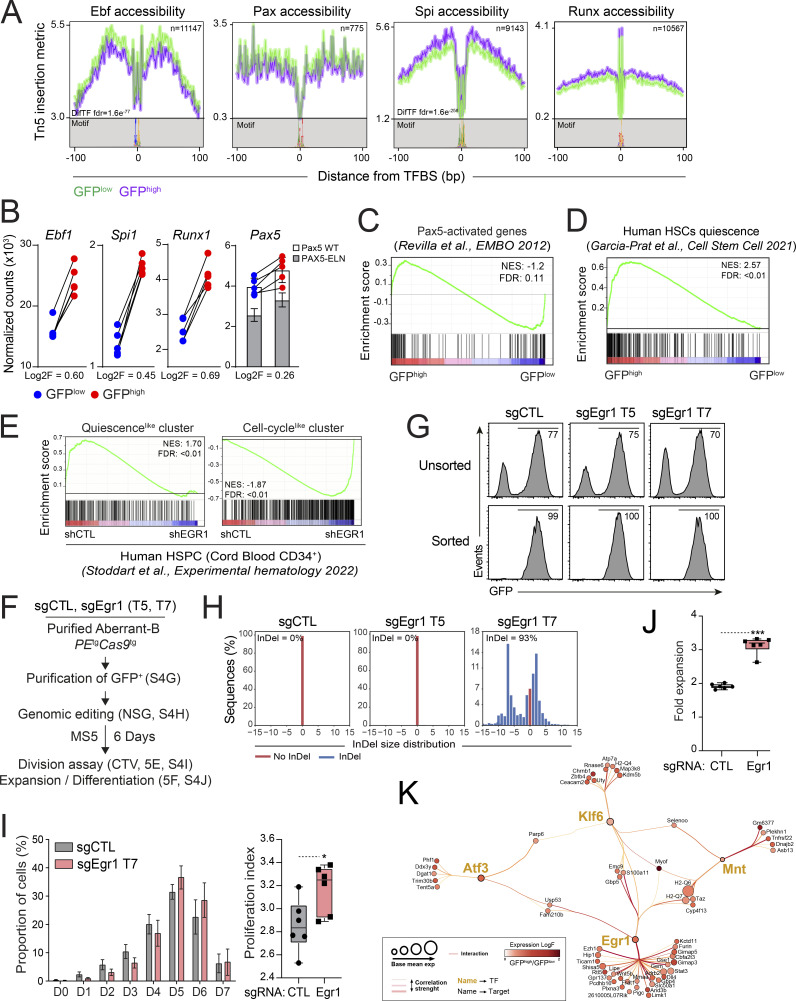
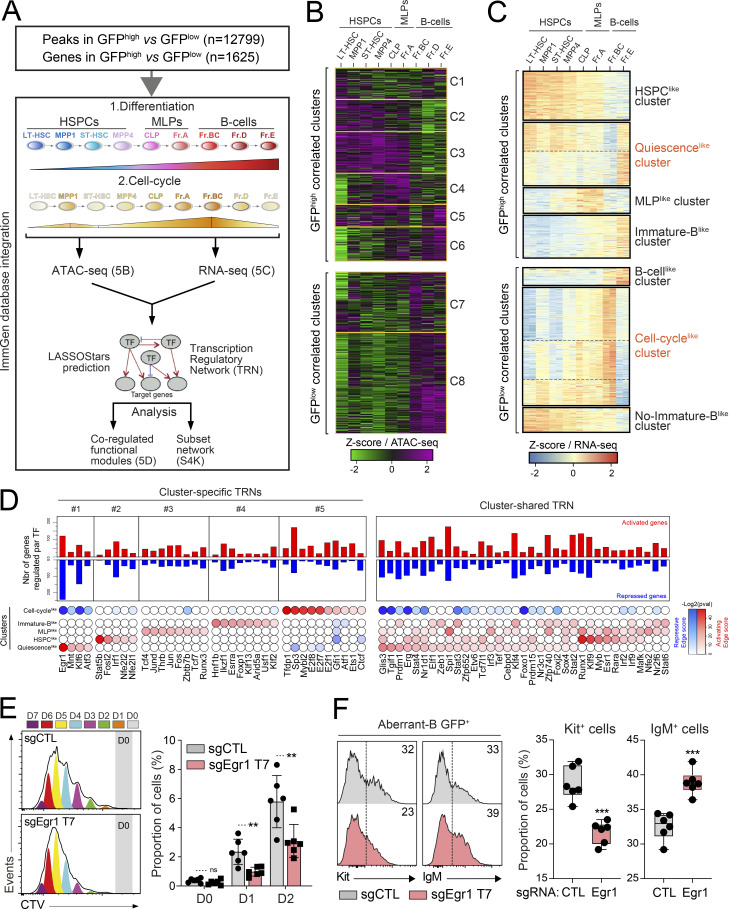
B cell acute lymphoblastic leukemia (B-ALL) is a multistep disease characterized by the hierarchical acquisition of genetic alterations. However, the question of how a primary oncogene reprograms stem cell-like properties in committed B cells and leads to a preneoplastic population remains unclear. Here, we used the PAX5::ELN oncogenic model to demonstrate a causal link between the differentiation blockade, the self-renewal, and the emergence of preleukemic stem cells (pre-LSCs). We show that PAX5::ELN disrupts the differentiation of preleukemic cells by enforcing the IL7r/JAK-STAT pathway. This disruption is associated with the induction of rare and quiescent pre-LSCs that sustain the leukemia-initiating activity, as assessed using the H2B-GFP model. Integration of transcriptomic and chromatin accessibility data reveals that those quiescent pre-LSCs lose B cell identity and reactivate an immature molecular program, reminiscent of human B-ALL chemo-resistant cells. Finally, our transcriptional regulatory network reveals the transcription factor EGR1 as a strong candidate to control quiescence/resistance of PAX5::ELN pre-LSCs as well as of blasts from human B-ALL.


Conflict of interest statement

Disclosures: The authors declare no competing interests exist.

Figures

None
Graphical abstract
Figure S1.
Figure S1.
Phenotypic characterization of preleukemic mice. (A) Schematic representation of the murine BM B cell differentiation. Representation of the different B cell differentiation stages (pre-pro-B, pro-B, pre-BI, early pre-BII, late pre-BII, immature-B, and mature-B) and pattern of expression of the main markers used to characterize each subset. Both Philadelphia (Hardy and Hayakawa, 2001) and Basel (Rolink and Melchers, 1996) nomenclatures are indicated in blue and green, respectively. Blue and green stars indicate the markers used in the respective nomenclatures. The thickness of the line is representative of the expression level. The dotted lines indicate subsets where expression is progressively acquired or lost. The markers used to perform the multiparametric staining by FACS, and the UMAP representation are indicated in red. VHDHJH and VLJL rearrangements are indicated. (B and C) Gating strategy of the B cell compartment (B) and of the different B cell subpopulations (C) from the BM of wt and PEtg preleukemic mice to perform the clustering analysis by UMAP shown in Fig. 1 A. Each red gate represents the parent population of the following below set of FACS plots. Kit expression level in pro-B, pre-BI, and pre-BII subsets and IL7r expression level in early and late pre-BII subsets are shown. (D) Expression of intracytoplasmic ELN in aberrant B cells (CD19+B220low), in all the steps of B cell differentiation (CD19+B220+), in HSPC-enriched (CD19B220Kit+IL7r) and CLP-enriched (CD19B220KitlowIL7rlow) populations from preleukemic PEtg mice (n = 4). Wt mice (n = 4) were used as controls. (E) Representative immunophenotype of the aberrant B population from PEtg preleukemic BM identified in Fig. S1 C. The aberrant B PEtg population was subdivided into the different phenotypic-like subsets pro-Blike, pre-BIlike, early pre-BIIlike, late pre-BIIlike, immature-Blike. Kit expression levels in pro-Blike, pre-BIlike, and pre-BIIlike subsets and Il7r expression levels in early and late pre-BIIlike subsets are shown. (F) Expression of Sca-1 in aberrant B cells (CD19+B220low), in all the steps of B cell differentiation (CD19+B220+), in HSPC-enriched (CD19B220Kit+IL7r) and CLP-enriched (CD19B220KitlowIL7rlow) populations from PEtg mice (n = 9). Wt mice (n = 6) were used as controls.
Figure 1.
Figure 1.
PAX5::ELN induces aberrant B cells at the preleukemic stage. (A–C) Phenotypic characterization of the B cell lineage from the BM of wt and PAX5::ELN (PEtg) preleukemic mice (30 days old, n = 4). UMAP of the cell density (A, left panels), of the clustering analysis of the B cell subpopulations (A, central panels) based on the gating strategy shown in Fig. S1, B and C. Each subset is represented by one color. Black arrow indicates the physiological phenotypic progression of B cells in the differentiation. Red dotted line delimits the aberrant preleukemic B cell population induced by PAX5-ELN (A, central panels). UMAP of the expression level of CD135, CD19, BP1, CD2, CD25, Igκ/λ, and CD23 (A, right panels). Absolute numbers of B cell subpopulations were calculated. The horizontal lines of the box plots indicate the median, while the boxes represent the first and the third quartiles of the data and the whiskers denote the minimum and the maximum values (B, *P < 0.05, **P < 0.01). UMAP of the expression level of B220, Kit, IL7r, IgM and λ5 (C). Data were compiled from four mice per condition and are representative at least of two independent experiments (*P < 0.05, **P < 0.01). (D) Experimental procedure to study the functional impact of PAX5::ELN on B cells. (E) Engraftment efficiency (CD45.2+) in the recipient BM of primary (I) and secondary (II) mice was analyzed each 2 wk after transplantation. The number of positive mice and the median of engraftment are indicated (n = 3–9, ***P < 0.001). (F) UMAP of the CD45.2+ PEtg B cell subpopulations (left panel) before (steady state) and after transplantation in primary, secondary, and tertiary recipients, associated with the expression level of Kit (right panels). (G) Kaplan–Meier survival curve of tertiary recipients transplanted with donor-derived PEtg B cells (n = 9). (H) Engraftment efficiency in the recipient BM of primary mice was analyzed 3 wk after transplantation. The number of positive mice, the median of engraftment and the in vivo fold expansion of PEtg Kit+ cells are indicated. Data were compiled from three independent experiments (n = 4–30, ***P < 0.001). (I) Kaplan–Meier survival curve of secondary recipient mice respectively transplanted with donor-derived Kit+ cells (n = 4, red) or Kit cells (n = 4, blue).
Figure S2.
Figure S2.
Cell-cycle status of preleukemic B cells. (A) UMAP of the cell density (left panel) before (steady state) and after transplantation in primary, secondary, and tertiary recipients, associated with the expression level of B220, IL7r, CD2, CD19, and IgM (right panels). (B) Kaplan–Meier survival curve of quaternary recipient mice transplanted with 5 × 10² (n = 7), 5 × 10³ (n = 7), and 5 × 10⁴ (n = 7) donor-derived blasts from tertiary B-ALL PEtg mice. (C) Experimental procedure to study the engraftment potential of kit+ aberrant B cells. (D) Ki67 staining was performed on B cells from the BM of wt and preleukemic PEtg mice according to Fig. 2 A (n = 4). Representative FACS analysis of the proportion of cells in G0 phase (Ki67 cells) within each wt and PEtg B cell subpopulation. (E) Preleukemic PEtg cells were plated on MS5 stromal cells and treated with increasing doses (n = 3 for each dose, one experiment) of DOXO, MTX, or VCR for 48 h. Ki67 staining was then performed, and the proportion of Ki67+ and Ki67 within the aberrant B cell population was shown (upper panels) and quantified (lower panels) for each dose. (F) FACS analysis (Winlist software) of the cell divisions (CTV) in function of Kit expression level after the coculture of CTV-labeled wt and preleukemic PEtg cells. Red arrow indicates the undivided (D0) population. (G) Expression level of the PAX5::ELN fusion transcript in PEtg D0–2 (n = 2), PEtg D8–9 (n = 2), and wt D8–9 (n = 2) cells (mean ± SD). RNA-seq data were aligned independently on the sequence of PAX5::ELN human transgene. Expression levels are represented in “reads” per million (RPM). (H) Purified wt and preleukemic PEtg Kit+ cells were plated on MS5 stromal cells and treated with increasing doses (n = 3 for each dose, one experiment) of DOXO, MTX, or VCR for 48 h. Cell numbers of treated cells were then analyzed by FACS and normalized to the number of untreated cells. IC50 of each compound on wt and preleukemic PEtg cells were determined according to the respective dose-response curves. (I) Representative immunophenotype of donor-derived (CD45.2+CD45.1) cells in engrafted recipient BM 3 wk after the transplantation of slow- (D0–2) and high- (D8–9) cycling preleukemic PEtg cells.
Figure 2.
Figure 2.
Cell quiescence is a feature of PAX5::ELN pre-LSCs. (A and B) UMAP representation of the wt and PEtg B cell subpopulations (A, left panel), associated with the Ki67 expression level (A, right panel). The arrow indicates the population in G0 phase (Ki67 cells in blue) within the aberrant B cell population. Quantification of the proportion of cells in G0 phase (Ki67 cells) within each wt and PEtg B cell subpopulation (B). Data were compiled from four mice per condition and are representative at least of two independent experiments .The horizontal lines of the box plots indicate the median, while the boxes represent the first and the third quartiles of the data and the whiskers denote the minimum and the maximum values. (C) Preleukemic PEtg cells were treated in vitro on MS5 stromal cells with a dose-response of DOXO, MTX, or VCR for 48 h. Absolute numbers of Ki67+ and Ki67 cells within the aberrant B cell population were then analyzed by FACS and normalized to the number of untreated cells (n = 3, one experiment, **P < 0.01, ***P < 0.001). (D) Experimental procedure to study cell division of Kit+ B-progenitors from wt and preleukemic PEtg mice. (E and F) The number of cell divisions (D0 to D9) after the coculture was then analyzed (E), the proportion of cells in each division was quantified and the PI (PI ± SD) was calculated for each condition (F, n = 2, mean ± SD, representative of two independent experiments, *P < 0.05, **P < 0.01, ***P < 0.001). Red dotted gates were used to purify the D0–2 and D8–9 populations (E). (G) Cell clonality analysis of PEtg D0–2, PEtg D8–9 and wt D8–9 populations after RNA-seq. The proportions of VH(DH)JH and VLJL rearranged transcripts were represented by Circos diagrams. (H) Drug sensitivity of PEtg D0–2 and D8–9 cells and of wt D8–9 cells upon the treatment with an IC50 of DOXO, MTX, and VCR during 48 h. Cell numbers of treated cells were analyzed by FACS and normalized to the number of untreated cells (n = 3, one experiment, mean ± SD, *P < 0.05, **P < 0.01, ***P < 0.001). (I and J) Engraftment efficiency 3 and 16 wk after transplantation (I) and Kaplan–Meier survival curve of recipient mice transplanted with D0–2 and D8–9 PEtg cells (J). The number of positive mice and the median of engraftment are indicated (I, n = 8). The median of time required to develop the B-ALL is indicated (J).
Figure 3.
Figure 3.
Imbalance of IL7r/JAK-STAT and pre-BCR/BLNK pathways in PAX5::ELN preleukemic cells. (A) Simplified schematic representation of the IL7r and pre-BCR signaling pathways adapted from Clark et al. (2014). (B) FACS analysis of pStat5 and pFoxo1 on the aberrant B cell population and on each normal B cell subsets from preleukemic PEtg mice after ex vivo IL-7 stimulation (+IL-7) (left panels). FACS analysis of pBlnk and pPlcγ2 after ex vivo H2O2 stimulation (+H2O2) is shown in right panels. (C and D) Preleukemic PEtg cells were treated in vitro on MS5 stromal cells with IL-7 (+IL-7) or not (−IL-7) for 48 h. The proportion of Annexin V+ cells within the aberrant B PEtg population was measured (left panel) and quantified (right panel) by FACS and the absolute numbers of viable aberrant B PEtg cells were calculated (D). Cells treated with 1 μM tofacitinib (Tofa) were used as controls (n = 6, representative of two independent experiments, *P < 0.05, **P < 0.01, ***P < 0.001). The horizontal lines of the box plots indicate the median, while the boxes represent the first and the third quartiles of the data and the whiskers denote the minimum and the maximum values. (E) Representative FACS analysis of pStat5 after IL-7 stimulation (+IL-7) in presence or not (vehicle) of 1 μM tofacitinib associated with Ki67 expression in normal B cells and in aberrant B PEtg cells. Unstimulated (−IL-7) cells were used as controls. (F) Venn diagram of PAX5::ELN-modified genes overlapped with a list of Stat5-binding genes arising from the ChIP sequencing of murine Stat5b-induced B-ALL cells (Katerndahl et al., 2017). Numbers in the plot indicate quantification of genes in each group. Indicated P value was calculated by hypergeometric test. (G) Expression level of selected genes involved in IL7r/JAK-STAT (left panel, Cdkn2a, Il2rα, Tnfrsf13b, and Socs3) and in pre-BCR/BLNK (right panel, CD79b, CD79a, Lyn, Syk, Blnk, Ikzf3, and Irf8) signaling pathways extracted from the RNA-seq of PEtg D0–2, PEtg D8–9 and wt D8–9 cells (n = 2, mean ± SD, *P < 0.05).
Figure S3.
Figure S3.
Molecular characterization of quiescent preleukemic B cells. (A) Representative FACS analysis of pStat5 and pFoxo1 on total BM from preleukemic PEtg mice after ex vivo IL-7 stimulation (+IL-7). Unstimulated (−IL-7) cells were used as control (left panels). FACS analysis of pBlnk and pPlcγ2 on total BM from preleukemic PEtg mice after ex vivo H2O2 stimulation (+H2O2). Unstimulated (−H2O2) cells were used as control (right panels). (B) Gene set variation analysis of PEtg D0–2 (n = 2), PEtg D8–9 (n = 2), and wt D8–9 (n = 2) cells was performed using TransFACT and KEGG libraries and top gene sets were represented in heatmap. (C) Representative FACS analysis of GFP expression in the different B cell subsets from wt H2B-GFPtg (left panels) and preleukemic PEtgH2B-GFPtg (right panels) mice after 0, 1, 2, and 3 wk of DOX chase. The proportion of GFPhigh cells is indicated for each time point. (D) Kaplan–Meier survival curve of recipient mice transplanted with purified GFPhigh (n = 3) and GFPlow (n = 6) cells from PEtgH2B-GFPtg mice. (E) Heatmap of Metascape results of the top selected pathways between all the differentially expressed genes between GFPhigh (n = 5) and GFPlow (n = 5) cells. (F) Heatmap of enrichment analysis of differentially accessible regions obtained with Cistrome-GO.
Figure 4.
Figure 4.
Loss of B cell molecular identity in quiescent pre-LSCs. (A) Experimental procedure to study the cell division kinetics in vivo of wt and preleukemic B cells. TFBS, TF binding site. (B) Representative FACS analysis of GFP expression in B cells (CD19+CD23) from the BM of wt H2B-GFPtg (n = 14, upper panels) and preleukemic PEtgH2B-GFPtg (n = 12, central panels) mice after 0, 1, 2, and 3 wk of DOX chase. AUC quantification of the GFP was compared between the two conditions (lower panels, **P < 0.01, ***P < 0.001). (C) Quantification of the proportion of GFPhigh within preleukemic PEtgH2B-GFPtg (n = 12) B cell subpopulations after 1 wk of DOX chase. The horizontal lines of the box plots indicate the median, while the boxes represent the first and the third quartiles of the data and the whiskers denote the minimum and the maximum values. (D) Representative FACS analysis (upper panel) and quantification (lower panel, n = 8, mean ± SD, ***P < 0.001) of the proportion of G0 (Ki67) and cycling (Ki67+) cells in GFPlow, GFPmed and GFPhigh populations. Data from B–D were representative at least of two independent experiments. (E) Engraftment efficiency of purified GFPhigh (n = 3) and GFPlow (n = 6) cells from PEtgH2B-GFPtg mice was analyzed by FACS 3 and 8 wk after transplantation. The number of positive mice and the median of engraftment are indicated. (F) Experimental procedure for the molecular characterization of quiescent pre-LSCs in vivo (left panel). Scatter plots showing differentially expressed genes (RNA-seq, n = 5) and differentially chromatin accessibility (ATAC-seq signal, n = 3) between purified GFPhigh and GFPlow cells from PEtgH2B-GFPtg mice (right panels). (G) TF motifs with differential chromatin accessibility between GFPhigh and GFPlow cells identified and sorted using the DiffTF computational tool (Berest et al., 2019). Down- (left panel) and up- (right panel) regulated TF accessible regions in quiescent GFPhigh cells were represented. (H) GSEA of the well-established list of in vivo PAX5-repressed genes (Revilla-I-Domingo et al., 2012) between GFPhigh and GFPlow cells. (I) Heatmap of genes involved in indicated pathways between GFPhigh (n = 5) and GFPlow (n = 5) cells. (J) GSEA of the established list of in vivo mouse HSC quiescence genes (Venezia et al., 2004) between GFPhigh and GFPlow cells. The normalized enrichment score (NES) and the false discovery rate (FDR) are indicated in H and J.
Figure S4.
Figure S4.
Impact of Egr1 editing on cell proliferation of preleukemic B cells. (A) Comparison of the accessibility footprint of Ebf, Pax, Spi, and Runx motifs (ATAC-seq data) between GFPhigh (purple) and GFPlow (green) cells. (B) Comparison of Ebf1, Spi1, Runx1, and of total Pax5 expression (RNA-seq data, n = 5, mean ± SD) between GFPhigh (red) and GFPlow (blue) cells. The proportions of murine Pax5 (Pax5 WT) and of human PAX5 (PAX5-ELN) are shown. (C) GSEA of the well-established list of in vivo PAX5-activated genes (Revilla-I-Domingo et al., 2012) between GFPhigh and GFPlow cells. (D) GSEA of the established list of in vivo human HSC quiescence genes (Garcia-Prat et al., 2021) between GFPhigh (red) and GFPlow (blue) cells. (E) GSEA of the list of genes in the quiescencelike cluster (left panel) and in the cell-cyclelike cluster (right panel) and identified in Fig. 5 C between human CD34+ HSPCs modified or not (shCTL) with EGR1 shRNA (shEGR1) (Stoddart et al., 2022). (F) Experimental procedure to study the role of Egr1 in PEtg pre-LSC activity. (G) Transduction efficiency of preleukemic PEtgCas9tg aberrant B cells expressing sgCTL, sgEgr1 T5, and sgEgr1 T7 was assessed by FACS by monitoring the percentage of GFP for each condition (upper panels). Transduced PEtgCas9tg GFP+ cells were purified by cell sorting and cell purity was then verified (lower panels). (H) Analysis of the targeted region (exon 1) of Egr1 by NGS and quantification of the genomic editing efficiency. (I) The number of cell divisions (D0 to D7) of aberrant B GFP+ cells expressing sgCTL or sgEgr1 T7 after 6 days of coculture was analyzed (left panel) and the PI was calculated for each condition (right panel, n = 6, one experiment, *P < 0.05). (J) In vitro cell growth of GFP+ sgCTL and sgEgr1 T7 cells. Results represent the fold expansion of aberrant B GFP+ cells after 6 days of coculture on MS5 stromal cells (n = 6, one experiment, ***P < 0.001). The horizontal lines of the box plots indicate the median, while the boxes represent the first and the third quartiles of the data and the whiskers denote the minimum and the maximum values. (K) Molecular network of genes from TRN#1 of Fig. 5 D. Node color represents the log-fold difference between GFPhigh and GFPlow subset and node size represents the base-mean expression. Target genes positively regulated by the four TFs, Egr1, Mnt, Klf6, and Atf3, were annotated.
Figure 5.
Figure 5.
Transcriptional molecular network reprogrammed in quiescent pre-LSCs. (A) Study design for the generation of the pre-LSC transcription regulatory network. (B and C) Heatmap of k-means clustering for the differentially accessible region (B) or differentially expressed genes (C) integrating the different subsets of the normal B-lymphopoiesis. Clusters are separated depending on the correlation with GFPhigh or GFPlow. (D) Core TRNs are defined according to enriched positive regulation of upregulated gene (red) or negative regulation of downregulated genes (blue) in a given cluster identified in Fig. 5 C (lower panels). The significance of enrichment is displayed on the right. The upper panels displayed the number of positive (red) and negative (blue) regulatory interactions per TF. The analysis defined five cluster-specific TRNs and one cluster-shared TRN of the pre-LSC signature. (E and F) Cell division assay (E) and cell differentiation assay (F) of PEtgCas9tg aberrant B cells expressing sgCTL or sgEgr1 T7 (GFP+) according to the experimental procedure detailed in Fig. S4 F. The number of cell divisions (D0 to D7) after 6 days of coculture was then analyzed (E, left panel) and the proportion of cells in the divisions D0, D1, and D2 was quantified (E, right panel, n = 6, one experiment, mean ± SD, **P < 0.01). The proportion of Kit+ and IgM+ cells was evaluated by FACS (F, left panel) and quantified (F, right panel, n = 6, one experiment, ***P < 0.001). The horizontal lines of the box plots indicate the median, while the boxes represent the first and the third quartiles of the data and the whiskers denote the minimum and the maximum values.
Figure 6.
Figure 6.
EGR1 activation in quiescent and therapy-resistant human B-ALL. (A and B) GSEA of the up- (left panels) and down- (right panels) regulated genes from CFSE label-retaining human B-ALL cells (LRC signature, A) or from residual human B-ALL cells after chemotherapies (MRD signature, B) (Ebinger et al., 2016) between GFPhigh and GFPlow cells. NES and FDR values are indicated. (C–H) Experimental procedure to explore EGR1 expression in resistant human B-ALL cells (C). Leukemic blasts from the “de novo” B-ALL patient HB#010 were transplanted into NSG mice (n = 11). The proportion of hCD45+hCD19+ B-ALL blasts in BM aspirations was assessed 4 and 16 wk after transplantation (D). Engrafted mice were randomly selected for treatment (CHEMO) or not (vehicle) with a chemotherapeutic cocktail (DEXA+VCR) during 3 wk. Human B-ALL reconstitution (number of hCD45+hCD19+ B-ALL blasts) was monitored by FACS in the BM and the spleen after the treatment (E). Spleen weight was measured, and a picture of the spleen is shown (F). Ki67 expression was determined by FACS in blasts from the BM of treated and untreated mice (G). Data obtained with B-ALL patient HB#010 were compiled from five (vehicle) and six (CHEMO) mice per condition (***P < 0.001). The horizontal lines of the box plots indicate the median, while the boxes represent the first and the third quartiles of the data and the whiskers denote the minimum and the maximum values. Engrafted blasts were purified and mRNA levels of the human EGR1 were determined by quantitative RT-PCR and normalized to ABL1 gene. Error bars indicate mean ± SD (n = 6, ***P < 0.001) from two independent experiments (H). (I–K) Experimental procedure to explore EGR1 expression in quiescent human B-ALL cells (I). Leukemic blasts from the “de novo” B-ALL patient HB#002 were stained with CTV and the number of cell divisions (D0 to D4–5) after the coculture was then analyzed (J). The proportion of cells in each division was quantified (J, left panel). Red dotted gates were used to purify the D0 (CTVhigh) and D4–5 (CTVlow) populations (J, right panel) and the expression of human EGR1 were determined by quantitative RT-PCR (K, mean ± SD, n = 3, one experiment, **P < 0.01). (L) EGR1 expression and its associated clinical outcome in B-ALL patient extracted from Gu et al. (2019). EFS curves of B-ALL patients with EGR1 expression below (blue) and above (red) to the median. Patients are classified within the different B-ALL oncogenic subgroups.
Figure S5.
Figure S5.
Upregulation of EGR1 expression in residual leukemic blasts. (A) GSEA of the up- (left panel) and down- (right panel) regulated genes from residual human B-ALL cells after chemotherapies (Turati et al., 2021) between GFPhigh and GFPlow cells. (B–G) Experimental procedure to explore EGR1 expression in resistant human B-ALL cells (B). Leukemic blasts from the “de novo” B-ALL patient HB#007 were transplanted into NSG mice (n = 11). The proportion of hCD45+hCD19+ B-ALL blasts in BM aspirations was assessed 12 and 32 wk after transplantation (C). Engrafted mice were randomly selected for treatment (CHEMO) or not (vehicle) with a chemotherapeutic cocktail (DEXA+VCR) for 1 wk. Human B-ALL reconstitution (number of hCD45+hCD19+ B-ALL blasts) was monitored by FACS in the BM and the spleen after the treatment (D). Spleen weight was measured, and a picture of the spleen is shown (E). Ki67 expression was determined by FACS in blasts from the BM of treated and untreated mice (F). Data obtained with B-ALL patient HB#007 were compiled from five (vehicle) and five (CHEMO) mice per condition (*P < 0.05, ***P < 0.001). The horizontal lines of the box plots indicate the median, while the boxes represent the first and the third quartiles of the data and the whiskers denote the minimum and the maximum values. Engrafted blasts were purified and mRNA levels of the human EGR1 were determined by quantitative RT-PCR and normalized to ABL1 gene. Error bars indicate mean ± SD (n = 6, ***P < 0.001) from two independent experiments (G). (H) Engrafted blasts (B-ALL patient HB#010) from the BM of treated (CHEMO) and untreated (Vehicle) mice (Fig. 6 E) were purified and transplanted in equal number (2 × 10⁵ cells/mouse) in secondary recipients. The proportion of hCD45+hCD19+ B-ALL blasts in BM aspirations was assessed 4, 6, 8, and 12 wk after transplantation was monitored by FACS (n = 5, one experiment, ***P < 0.001). (I–K) Experimental procedure to explore EGR1 expression in quiescent human B-ALL cells (I). Leukemic blasts from the “de novo” B-ALL patient HB#008 were stained with CTV and the number of cell divisions (D0 to D4–5) after the coculture was then analyzed. Red dotted gates were used to purify the D0 (CTVhigh) and D4–5 (CTVlow) populations (J) and the expression of human EGR1 were determined by quantitative RT-PCR (K, mean ± SD, n = 3, one experiment, **P < 0.01). (L) EGR1 expression and its associated clinical outcome in B-ALL patient extracted from Gu et al. (2019). EFS curves of total B-ALL patients with EGR1 expression below (blue) and above (red) to the median. (M) EGR1 expression in the different B-ALL oncogenic subgroups was shown.

References

    1. Adelman, E.R., Huang H.T., Roisman A., Olsson A., Colaprico A., Qin T., Lindsley R.C., Bejar R., Salomonis N., Grimes H.L., and Figueroa M.E.. 2019. Aging human hematopoietic stem cells manifest profound epigenetic reprogramming of enhancers that may predispose to leukemia. Cancer Discov. 9:1080–1101. 10.1158/2159-8290.CD-18-1474 - DOI - PMC - PubMed
    1. Alexander, T.B., Gu Z., Iacobucci I., Dickerson K., Choi J.K., Xu B., Payne-Turner D., Yoshihara H., Loh M.L., Horan J., et al. . 2018. The genetic basis and cell of origin of mixed phenotype acute leukaemia. Nature. 562:373–379. 10.1038/s41586-018-0436-0 - DOI - PMC - PubMed
    1. Althoff, M.J., Nayak R.C., Hegde S., Wellendorf A.M., Bohan B., Filippi M.D., Xin M., Lu Q.R., Geiger H., Zheng Y., et al. . 2020. Yap1-scribble polarization is required for hematopoietic stem cell division and fate. Blood. 136:1824–1836. 10.1182/blood.2019004113 - DOI - PMC - PubMed
    1. Aurrand-Lions, M., and Mancini S.J.C.. 2018. Murine bone marrow niches from hematopoietic stem cells to B cells. Int. J. Mol. Sci. 19:2353. 10.3390/ijms19082353 - DOI - PMC - PubMed
    1. Becht, E., McInnes L., Healy J., Dutertre C.A., Kwok I.W.H., Ng L.G., Ginhoux F., and Newell E.W.. 2018. Dimensionality reduction for visualizing single-cell data using UMAP. Nat. Biotechnol. 10.1038/nbt.4314 - DOI - PubMed

LinkOut - more resources