. 2024 Feb 7;215(2):105-119.
doi: 10.1093/cei/uxad120.

Tuning the potency and selectivity of ImmTAC molecules by affinity modulation

Affiliations

Tuning the potency and selectivity of ImmTAC molecules by affinity modulation

Ian B Robertson et al. Clin Exp Immunol. .

Abstract

T-cell-engaging bispecifics have great clinical potential for the treatment of cancer and infectious diseases. The binding affinity and kinetics of a bispecific molecule for both target and T-cell CD3 have substantial effects on potency and specificity, but the rules governing these relationships are not fully understood. Using immune mobilizing monoclonal TCRs against cancer (ImmTAC) molecules as a model, we explored the impact of altering affinity for target and CD3 on the potency and specificity of the redirected T-cell response. This class of bispecifics binds specific target peptides presented by human leukocyte antigen on the cell surface via an affinity-enhanced T-cell receptor and can redirect T-cell activation with an anti-CD3 effector moiety. The data reveal that combining a strong affinity TCR with an intermediate affinity anti-CD3 results in optimal T-cell activation, while strong affinity of both targeting and effector domains significantly reduces maximum cytokine release. Moreover, by optimizing the affinity of both parts of the molecule, it is possible to improve the selectivity. These results could be effectively modelled based on kinetic proofreading with limited signalling. This model explained the experimental observation that strong binding at both ends of the molecules leads to reduced activity, through very stable target-bispecific-effector complexes leading to CD3 entering a non-signalling dark state. These findings have important implications for the design of anti-CD3-based bispecifics with optimal biophysical parameters for both activity and specificity.

Keywords: T-cell activation; bispecific; cluster of differentiation 3; cytokine release; cytotoxicity.


Conflict of interest statement

I.B.R., R.O., S.H., and P.B.K. are current employees of Immunocore and hold Immunocore stock and/or options.

Figures

None
Graphical abstract
Figure 1.
Figure 1.
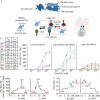
Effect of CD3 affinity on ImmTAC activity with a highly specific TCR (NY-BR-1). (A) Summary of the basic structure of an ImmTAC molecule (top) and the general mechanism of action (below): an affinity-matured TCR linked to an anti-CD3 scFv, forms bridges between effector T cells and target cells through strong binding to peptide-HLA with slow dissociation rates and intermediate binding affinity to CD3. This allows activation and redirection of T cells to specifically kill target cells. (B) IFNγ ELISA of response of HLA-A*02:01-negative peripheral blood mononuclear cells in the presence of ImmTAC molecules and T2 cells pulsed with 5 nM Target peptide (solid lines and full circles), or without pulsed peptide (dotted lines and open circles). Three plots are shown for low, medium, and high-affinity anti-CD3 variants. Data points represent the mean of eight different wells measured from a 384-well format plate. Black-dashed line highlights the 0.1 nM ImmTAC concentration used for summary plots of maximum ELISA response shown in (C) while potency (EC50) is shown in (D) Both are plotted against CD3 affinity (left) or t1/2 (right) of CD3 binding.
Figure 2.
Figure 2.
Effect of different combinations of TCR affinity and anti-CD3 affinity: (A) NY-BR-1 target peptide and a range of its mimetics were added to 50 000 T2 cells at a concentration of 5 nM, (37°C affinities of each peptide HLA for TCR shown in the figure). Four ImmTAC molecules with E8, E28, E0, and E42 anti-CD3 arms, were added at varying concentrations along with 40 000 PBMC cells. IFNγ was then measured by ELISA after a 48-hour incubation in a 96-well format. (B) Summary plot of ELISA data showing response to 1 nM ImmTAC plotted against TCR binding affinity to the different mimetic peptides. (C) Summary plot of ELISA data showing response to 1 nM ImmTAC plotted against the combined dissociation rate of TCR and anti-CD3 (i.e. the estimated t½ of a cell–cell bridge).
Figure 3.
Figure 3.
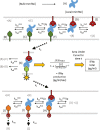
Structure of mathematical model for T-cell activation. Ten local concentrations (AJ) were modelled using 10 ordinary differential equations and these concentrations and their relationships are summarized here. Cell membranes are represented as grey lines, ImmTAC is shown alone in [A] (light blue), peptide HLA alone in [E] (dark red), resting CD3 shown alone in B (dark green), activated CD3 in complex in [G] (light green), and inhibited ‘dark state’ CD3 in [H], [I], and [J] (orange). Relevant rate parameters are shown above reaction arrows and letters in grey denote involvement of other model components (each component is only shown here once for simplicity). Concentration of active CD3 was translated into a rate of IFNγ production per second following a simple three-parameter dose–response relationship, then the area under the curve fitted for total IFNγ production over the course of the experiment. The local free ImmTAC concentration (A) was replenished by rapid diffusion from an inexhaustible bulk solution.
Figure 4.
Figure 4.
Model fitting results compared to the data. Fits of mathematical models applied to two datasets from Figs. 1 and 2. Simulated data shown here as solid lines generated using ‘best particle’ values for final iteration of ABC-SMC runs (Supplementary Table S4). (A) Fit to ELISA data from Fig. 1B generated with T2 cells pulsed with 5 nM target peptide and 10 different anti-CD3 variants. Error bars represent standard deviation from eight data points. Parameter values used in fit shown in Supplementary Table S4 (B) Fit to ELISA data from Fig. 2 generated with four anti-CD3 variants on T2 cells pulsed nine different peptides at 5 nM. Error bars represent standard deviation over three data points. Parameter values used in fit are shown in Supplementary Fig. S2 and Table S4.
Figure 5.
Figure 5.
Implications of mathematical model for ImmTAC potency and Emax. (A) Effect of varying CD3 t1/2 with fixed kon and long-lived TCR-pHLA binding (t1/2 = 1155 minutes) left, or short-lived TCR-pHLA binding (t1/2 = 0.1 minutes) right. (B) Heat maps plotting predicted IFNγ responses with different CD3-HLA affinity combinations at various ImmTAC concentrations (as written above each heat map). Off-rates of anti-CD3 variants and TCR binding mimetics are marked on axes for reference, although their on-rates also vary.
Figure 6.
Figure 6.
Effect of CD3 affinity on ImmTAC selectivity window. (A) Modelling of IFNγ response to two different HLA molecules (target and mimetic) was run with parameters fitted to NY-BR-1 data and an expanded 15 ODE model. Left: with only 1 nM target pHLA present, Middle: both 1 nM affinity target and 100 nM affinity mimetic pHLA molecules present, or right: only mimetic 100 nM affinity pHLA modelled. (The same presentation level of peptides was used in both instances and on rate was kept constant at 0.1 μM−1 s−1). (B) Modelling and data for IFNγ production from peripheral blood mononuclear cells in the presence of cross-reactive TCR-X ImmTAC and T2 cells pulsed with 5 nM Target peptide (left two graphs), or unpulsed cells (right). Lines show fits generated by the ODE model, without (left) or with (middle and right) fitted mimetic included in the model, and dots show ELISpot data points. Parameters of fit are shown in Supplementary Fig. S4. (C) ELISpot data with MAG-IC3 ImmTAC and HLA-A1 transfected T2 cells pulsed with the MAGEA3 target peptide that binds the TCR with a KD of 17 nM (left), or the mimetic Titin that binds the TCR with a KD of 180 nM (right),(2.5 μM peptide pulse used in both instances). Curves represent three-parameter fits. (Modelling was not performed for this TCR as data on peptide presentation level were not available).
Figure 7.
Figure 7.
Comparison of cytotoxicity to cytokine release (A) Killing of antigen-positive cells (left) and antigen-negative cells (middle) with different CD3 affinity molecules as measured by an Incucyte assay. Area under the curve of dead target cell counts at specified ImmTAC concentration. The plot on the right shows area under the curve versus t1/2 of CD3 binding at a singular ImmTAC concentration. Detailed time courses from which these data are derived are shown in Supplementary Fig. S6 (B) Plot of IFNγ in media at the end of killing experiment measured by ELISA with antigen-positive cells (left) and antigen-negative cells (middle). (C) Shows results from an alternative killing assay setup utilizing Phenix instrument using CAMA-1 antigen-positive cells, but a different PBMC donor with a 4:1 ratio of effectors to targets. The left panel shows the percentage of surviving cells after 96 hours relative to a control incubation without ImmTAC and normalized to initial cell counts at 2 hours (detailed time courses shown in Supplementary Fig. S6), while the right panel uses data from counting dead cells and estimating the area under the curve in the first 62 hours of the experiment. (D) ELISpot data were collected with CAMA-1 cells and the same PBMC donor as C, but with a 1:1 effector to target ratio.

References

    1. de la Roche M, Asano Y, Griffiths GM.. Origins of the cytolytic synapse. Nat Rev Immunol 2016, 16, 421–32. doi: 10.1038/nri.2016.54 - DOI - PubMed
    1. Richard AC, Frazer GL, Ma CY, Griffiths GM.. Staggered starts in the race to T cell activation. Trends Immunol 2021, 42, 994–1008. doi: 10.1016/j.it.2021.09.004 - DOI - PMC - PubMed
    1. Brameshuber M, Kellner F, Rossboth BK, Ta H, Alge K, Sevcsik E, et al. . Monomeric TCRs drive T cell antigen recognition. Nat Immunol 2018, 19, 487–96. doi: 10.1038/s41590-018-0092-4 - DOI - PMC - PubMed
    1. Cantrell D. Signaling in lymphocyte activation. Cold Spring Harbor Perspect Biol 2015, 7, a018788. doi: 10.1101/cshperspect.a018788 - DOI - PMC - PubMed
    1. Irvine DJ, Purbhoo MA, Krogsgaard M, Davis MM.. Direct observation of ligand recognition by T cells. Nature 2002, 419, 845–9. doi: 10.1038/nature01076 - DOI - PubMed

Publication types

Grants and funding