. 2024 Jan 16;84(2):258-275.
doi: 10.1158/0008-5472.CAN-23-1448.

Spatial and Single-Cell Transcriptomics Reveal a Cancer-Associated Fibroblast Subset in HNSCC That Restricts Infiltration and Antitumor Activity of CD8+ T Cells

Affiliations

Spatial and Single-Cell Transcriptomics Reveal a Cancer-Associated Fibroblast Subset in HNSCC That Restricts Infiltration and Antitumor Activity of CD8+ T Cells

Chuwen Li et al. Cancer Res. .

Abstract

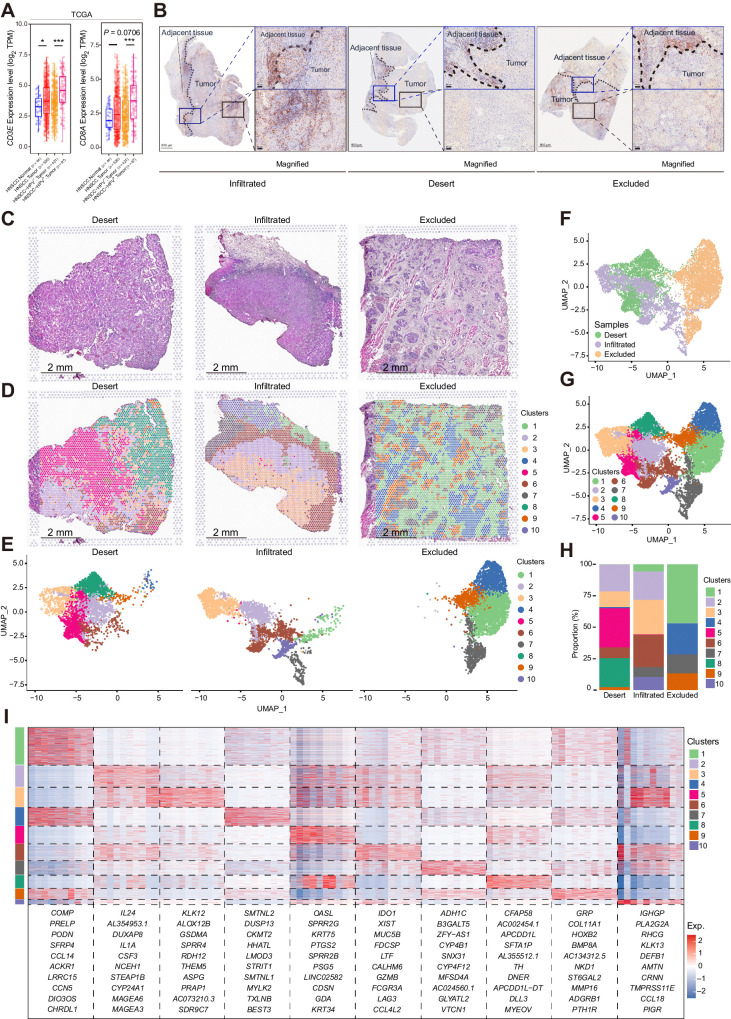
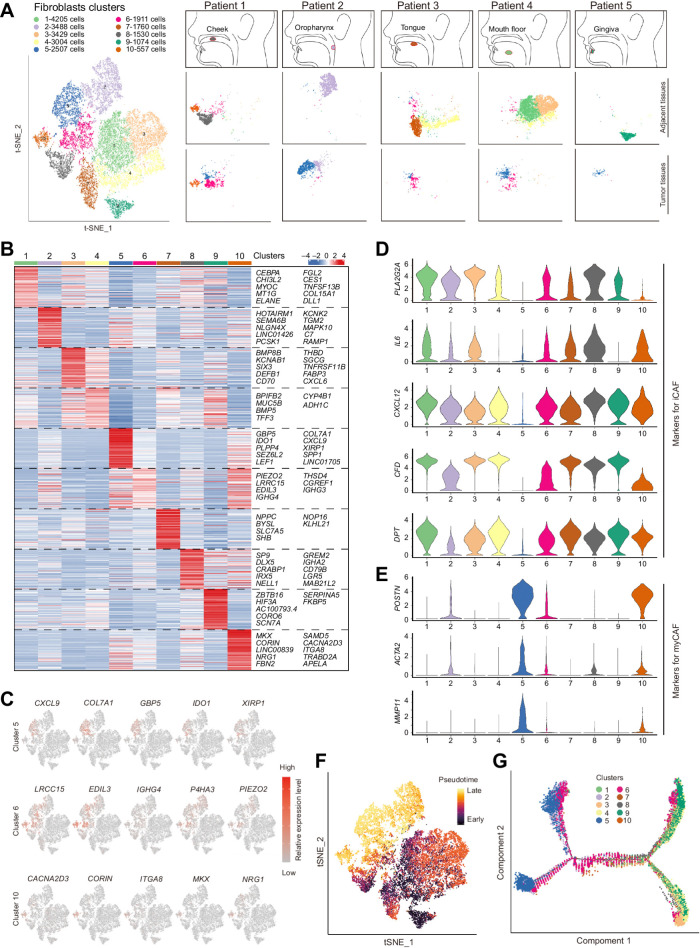
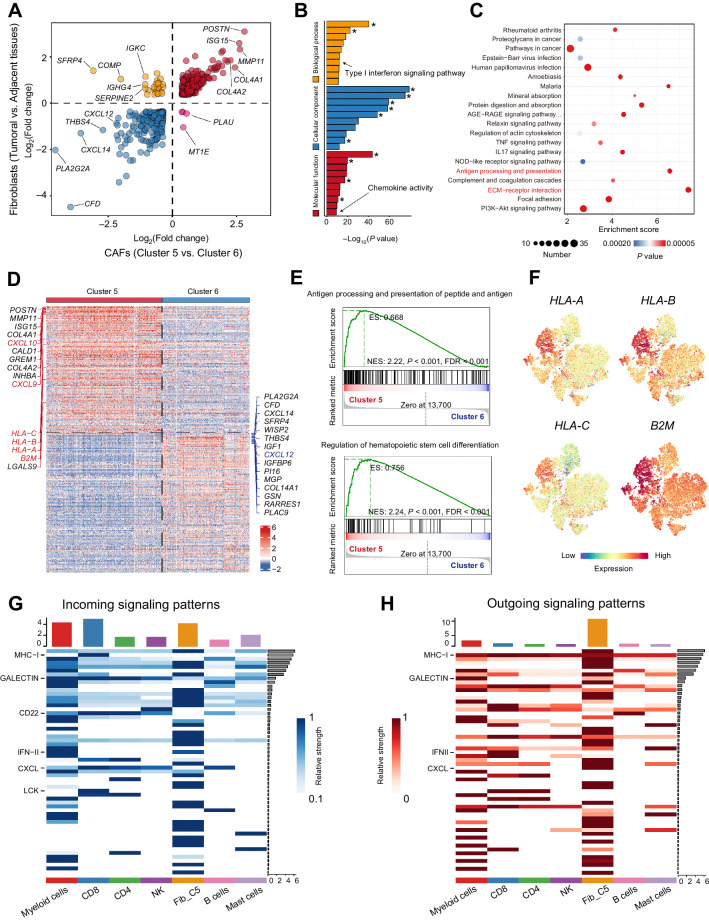
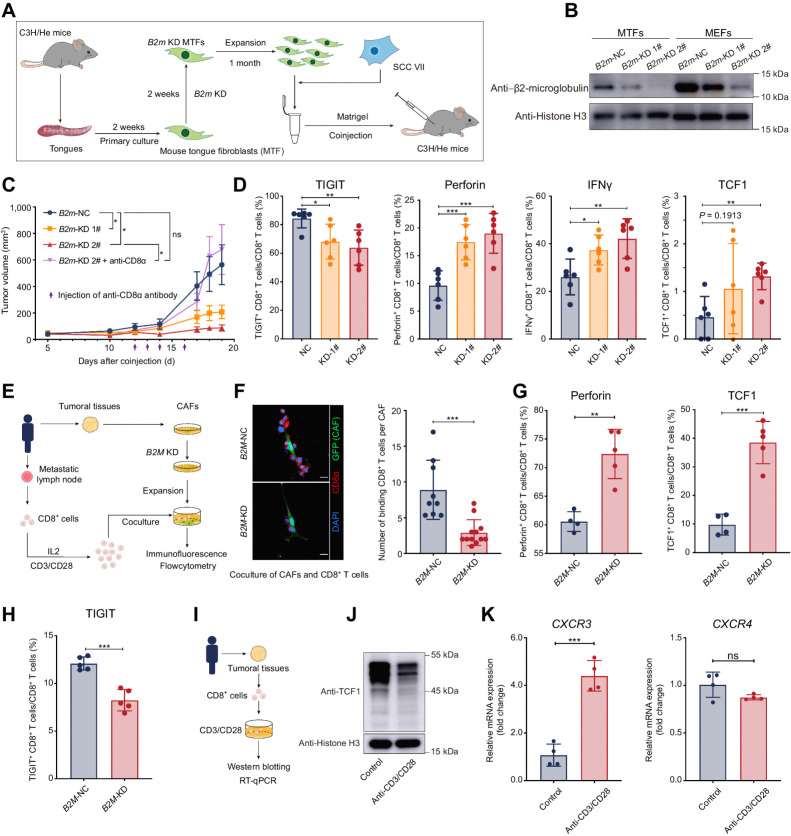
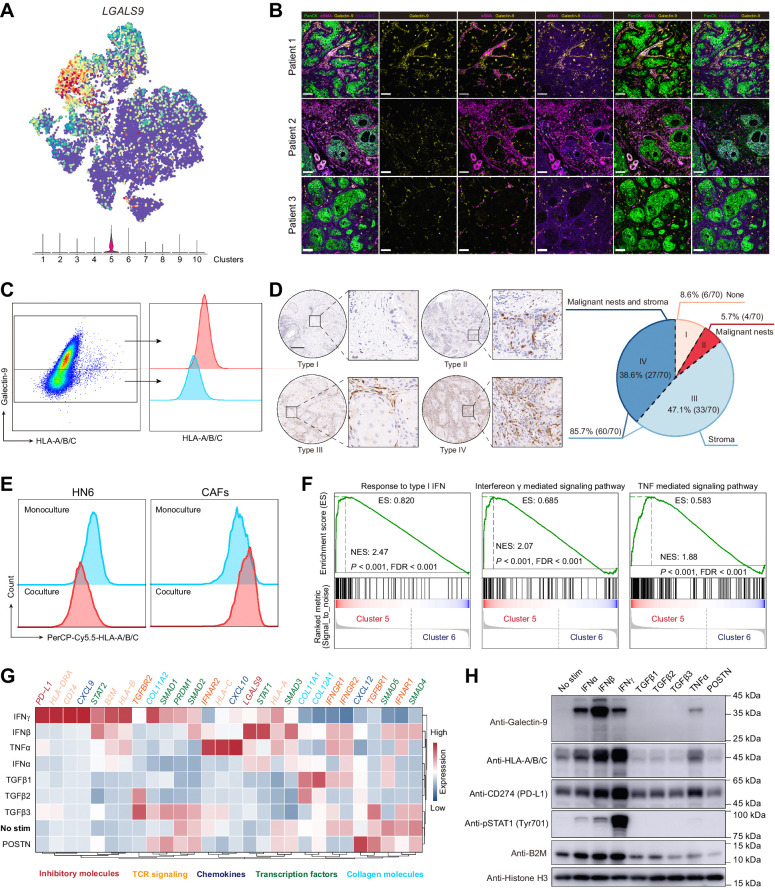
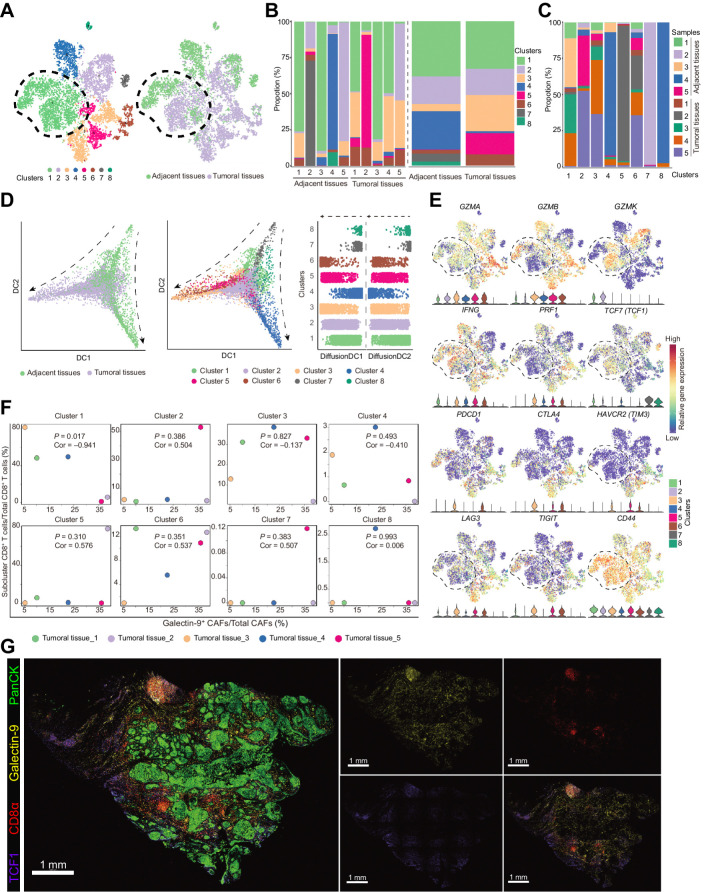
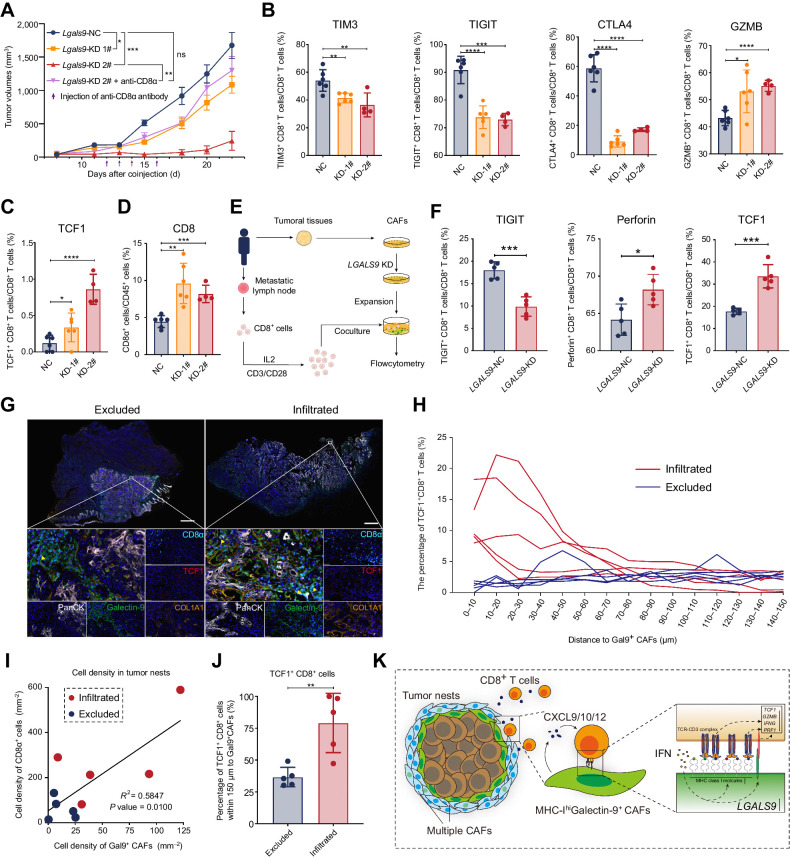
Although immunotherapy can prolong survival in some patients with head and neck squamous cell carcinoma (HNSCC), the response rate remains low. Clarification of the critical mechanisms regulating CD8+ T-cell infiltration and dysfunction in the tumor microenvironment could help maximize the benefit of immunotherapy for treating HNSCC. Here, we performed spatial transcriptomic analysis of HNSCC specimens with differing immune infiltration and single-cell RNA sequencing of five pairs of tumor and adjacent tissues, revealing specific cancer-associated fibroblast (CAF) subsets related to CD8+ T-cell infiltration restriction and dysfunction. These CAFs exhibited high expression of CXCLs (CXCL9, CXCL10, and CXCL12) and MHC-I and enrichment of galectin-9 (Gal9). The proportion of MHC-IhiGal9+ CAFs was inversely correlated with abundance of a TCF1+GZMK+ subset of CD8+ T cells. Gal9 on CAFs induced CD8+ T-cell dysfunction and decreased the proportion of tumor-infiltrating TCF1+CD8+ T cells. Collectively, the identification of MHC-IhiGal9+ CAFs advances the understanding of the precise role of CAFs in cancer immune evasion and paves the way for more effective immunotherapy for HNSCC.

Significance: Spatial analysis identifies IFN-induced MHC-IhiGal9+ CAFs that form a trap for CD8+ T cells, providing insights into the complex networks in the tumor microenvironment that regulate T-cell infiltration and function.


Figures

Figure 1. CD8α+ cells were maintained in the stroma of all three immune types of HNSCC. A, The CD8A and CD3E expression results of HNSCC bulk RNA sequencing data from TCGA database. The results are displayed in range and mean ± SEM, and statistics are accessed by the Wilcoxon test. *, P < 0.05; ***, P < 0.001. B, IHC staining of CD8α of the infiltrated, desert, and excluded immune type of HNSCC. Representative sites for the margins of tumor invasion and the tumor beds are labeled with dark blue and black rectangles, respectively, and magnified. C and D, H&E staining and spatial distribution of different clusters for spots throughout the tumor (with adjacent) tissues in the 10x Visium capture slides from desert, infiltrated, and excluded immune-subtype specimens. E–G, UMAP distribution of spots captured with the 10x Visium capture slides from desert, infiltrated, and excluded immune-subtype specimens. E, The captured spots are split by sample origins and labeled according to clusters. The spots are also summarized and labeled according to different immune-subtype specimens (F) and clusters (G). H, Proportion of the spots of different clusters in each immune-subtype specimen. I, Heat map of top markers for each cluster of spatial spots. The top 10 genes are listed. The rank of the gene markers was accessed with “findmarker” algorithm.
Figure 1.
CD8α+ cells were maintained in the stroma of all three immune types of HNSCC. A, The CD8A and CD3E expression results of HNSCC bulk RNA sequencing data from TCGA database. The results are displayed in range and mean ± SEM, and statistics are accessed by the Wilcoxon test. *, P < 0.05; ***, P < 0.001. B, IHC staining of CD8α of the infiltrated, desert, and excluded immune type of HNSCC. Representative sites for the margins of tumor invasion and the tumor beds are labeled with dark blue and black rectangles, respectively, and magnified. C and D, H&E staining and spatial distribution of different clusters for spots throughout the tumor (with adjacent) tissues in the 10x Visium capture slides from desert, infiltrated, and excluded immune-subtype specimens. E–G, UMAP distribution of spots captured with the 10x Visium capture slides from desert, infiltrated, and excluded immune-subtype specimens. E, The captured spots are split by sample origins and labeled according to clusters. The spots are also summarized and labeled according to different immune-subtype specimens (F) and clusters (G). H, Proportion of the spots of different clusters in each immune-subtype specimen. I, Heat map of top markers for each cluster of spatial spots. The top 10 genes are listed. The rank of the gene markers was accessed with “findmarker” algorithm.
Figure 2. Global analysis of fibroblasts from tumoral and adjacent tissues of HNSCC. A, Clinical information of collected tumoral and adjacent samples for single-cell RNA sequencing and each sample's t-SNE plot results for fibroblasts. B, Heat map of markers for 10 clusters of fibroblasts. The rank of the gene markers is accessed with “findmarker” algorithm. C, The expression of the top 5 markers for CAFs (clusters 5, 6, and 10) were overlaid in the t-SNE plots and also indicated in the violin plots. D and E, Violin plots of gene expression for iCAF- (D) or myCAF (E)-associated genes in fibroblasts. F and G, Pseudotime analysis for fibroblasts. F, Cells were labeled with the pseudodifferentiation time in the t-SNE plots. G, Cells labeled according to different clusters were also assigned to different pseudotime trajectories.
Figure 2.
Global analysis of fibroblasts from tumoral and adjacent tissues of HNSCC. A, Clinical information of collected tumoral and adjacent samples for single-cell RNA sequencing and each sample's t-SNE plot results for fibroblasts. B, Heat map of markers for 10 clusters of fibroblasts. The rank of the gene markers is accessed with “findmarker” algorithm. C, The expression of the top 5 markers for CAFs (clusters 5, 6, and 10) were overlaid in the t-SNE plots and also indicated in the violin plots. D and E, Violin plots of gene expression for iCAF- (D) or myCAF (E)-associated genes in fibroblasts. F and G, Pseudotime analysis for fibroblasts. F, Cells were labeled with the pseudodifferentiation time in the t-SNE plots. G, Cells labeled according to different clusters were also assigned to different pseudotime trajectories.
Figure 3. High expression levels of CXCLs and MHC class I molecules linked cluster 5 CAFs and CD8+ T cells. A, Plots of DEGs (fold change >1) between fibroblasts from tumoral and adjacent tissues and between clusters 5 and 6 CAFs. B and C, Gene ontology analysis (B) and GSEA (C) for expression differences between fibroblasts from tumoral and adjacent tissues. Asterisk (*), terms related to extracellular matrix or collagen. D–F, Expression difference between two CAF clusters (clusters 5 and 6). D, Heat map of top DEGs between cluster 5 and cluster 6 CAFs. E, GSEA analysis of DEGs between clusters 5 and 6 in the terms of “Antigen processing and presentation of peptide antigen via MHC class I” and “Regulation of hemataopoietic stem cell differentiation.” F, MHC class I molecules (HLA-A, HLA-B, HLA-C, and B2M) expression in the t-SNE plots of fibroblasts. G and H, Cell interaction analysis of cluster 5 CAFs and immune cells in HNSCC.
Figure 3.
High expression levels of CXCLs and MHC class I molecules linked cluster 5 CAFs and CD8+ T cells. A, Plots of DEGs (fold change >1) between fibroblasts from tumoral and adjacent tissues and between clusters 5 and 6 CAFs. B and C, Gene ontology analysis (B) and GSEA (C) for expression differences between fibroblasts from tumoral and adjacent tissues. Asterisk (*), terms related to extracellular matrix or collagen. D–F, Expression difference between two CAF clusters (clusters 5 and 6). D, Heat map of top DEGs between cluster 5 and cluster 6 CAFs. E, GSEA analysis of DEGs between clusters 5 and 6 in the terms of “Antigen processing and presentation of peptide antigen via MHC class I” and “Regulation of hemataopoietic stem cell differentiation.” F, MHC class I molecules (HLA-A, HLA-B, HLA-C, and B2M) expression in the t-SNE plots of fibroblasts. G and H, Cell interaction analysis of cluster 5 CAFs and immune cells in HNSCC.
Figure 4. Higher expression of MHC class I limited the antitumor function of CD8+ T cells. A, Schematic diagram of coinjection of subcutaneous tumor models for mouse tongue fibroblasts and SCC VII. B, Western blotting of β2-microglobulin in MTFs and MEFs. C, Tumor growth of subcutaneous coinjection of SCC VII and B2m knocked-down (B2m-KD) MTFs. Purple arrows, intratumoral injection time points of the anti-CD8α antibody or saline. D, The proportion of CD8+ T-expressing cytotoxic cytokines (perforin and IFNγ), the immune checkpoint (TIGIT), and TCF1 in CD8+ T cells isolated from subcutaneous tumors formed by coinjection of SCC VII and MTFs. E, A diagrammatic sketch for coculture experiments of B2M-KD CAFs and CD8+ T cells from the same patients. F, Left, immunofluorescent results for the CD8+ T cells binding to B2M-KD CAFs. Right, the average numbers of CD8+ T cells binding to one CAF are summarized. G, The flow cytometry results of expression for perforin and TCF1 in CD8+ T cells after coculturing with CAFs. H, The flow cytometry results of expression for TIGIT on CD8+ T cells after coculturing with CAFs. I, A diagrammatic sketch for isolation of CD8+ cells from HNSCC tumoral tissues and activation of TCR signaling in CD8+ cells by anti-CD3/CD8 antibody. J, Western blotting of TCF1 in CD8+ cells isolated from HNSCC tumoral tissues after TCR signaling activation. K, The mRNA expression changes of CXCR3 and CXCR4 in CD8+ T cells isolated from HNSCC tumoral tissues treated with or without anti-CD3/CD28 antibody. Statistics are shown in mean ± SEM (C) or mean± SD (D, F–H, and K) accessed by the unpaired t test. *, P < 0.05; **, P < 0.01; ***, P < 0.001; ns, nonsignificant.
Figure 4.
Higher expression of MHC class I limited the antitumor function of CD8+ T cells. A, Schematic diagram of coinjection of subcutaneous tumor models for mouse tongue fibroblasts and SCC VII. B, Western blotting of β2-microglobulin in MTFs and MEFs. C, Tumor growth of subcutaneous coinjection of SCC VII and B2m knocked-down (B2m-KD) MTFs. Purple arrows, intratumoral injection time points of the anti-CD8α antibody or saline. D, The proportion of CD8+ T-expressing cytotoxic cytokines (perforin and IFNγ), the immune checkpoint (TIGIT), and TCF1 in CD8+ T cells isolated from subcutaneous tumors formed by coinjection of SCC VII and MTFs. E, A diagrammatic sketch for coculture experiments of B2M-KD CAFs and CD8+ T cells from the same patients. F, Left, immunofluorescent results for the CD8+ T cells binding to B2M-KD CAFs. Right, the average numbers of CD8+ T cells binding to one CAF are summarized. G, The flow cytometry results of expression for perforin and TCF1 in CD8+ T cells after coculturing with CAFs. H, The flow cytometry results of expression for TIGIT on CD8+ T cells after coculturing with CAFs. I, A diagrammatic sketch for isolation of CD8+ cells from HNSCC tumoral tissues and activation of TCR signaling in CD8+ cells by anti-CD3/CD8 antibody. J, Western blotting of TCF1 in CD8+ cells isolated from HNSCC tumoral tissues after TCR signaling activation. K, The mRNA expression changes of CXCR3 and CXCR4 in CD8+ T cells isolated from HNSCC tumoral tissues treated with or without anti-CD3/CD28 antibody. Statistics are shown in mean ± SEM (C) or mean± SD (D, F–H, and K) accessed by the unpaired t test. *, P < 0.05; **, P < 0.01; ***, P < 0.001; ns, nonsignificant.
Figure 5. The immune checkpoint ligand molecule, galectin-9, was enriched in cluster 5 of CAFs. A, The t-SNE result of fibroblasts overlaid with LGALS9 (the gene encoding galectin-9). B, Representative immunofluorescence results of human HNSCC tumor samples stained for pan-cytokeratin (PanCK; green), αSMA (wine), galectin-9 (yellow), HLA-A/B/C (purple). Scale bar, 80 μm. C, Galectin-9 and HLA-A/B/C expressions in CAFs from human HNSCC tumor samples. The gating strategy for CAFs is presented in Supplementary Fig. S7C. D, Left, representative images of HNSCC tissue chip for different distribution patterns of galectin-9. Scale bar, 200 μm. Right, the proportions for four types of galectin-9 distribution are also summarized. E, Flow cytometry of HLA-A/B/C expression for monocultured or cocultured HN6 and CAFs. F, GSEA for cytokines-associated pathway enrichment of differentially expressed genes between clusters 5 and 6 CAFs. G and H, Gene expressions in CAFs treated with different cytokines (IFNα, IFNβ, IFNγ, TGFβ1, TGFβ2, TGFβ3, TNFα, and POSTN; the concentration of cytokines was 100 ng/mL). G, CAFs treated with cytokines for 24 hours were harvested for mRNA isolation and qRT-PCR. The data were pooled from three independent experiments and the relative expressions of targeted genes were analyzed relative to GAPDH or ACTB. H, CAFs treated with cytokines for 48 hours were harvested for Western blotting.
Figure 5.
The immune checkpoint ligand molecule, galectin-9, was enriched in cluster 5 of CAFs. A, The t-SNE result of fibroblasts overlaid with LGALS9 (the gene encoding galectin-9). B, Representative immunofluorescence results of human HNSCC tumor samples stained for pan-cytokeratin (PanCK; green), αSMA (wine), galectin-9 (yellow), HLA-A/B/C (purple). Scale bar, 80 μm. C, Galectin-9 and HLA-A/B/C expressions in CAFs from human HNSCC tumor samples. The gating strategy for CAFs is presented in Supplementary Fig. S7C. D, Left, representative images of HNSCC tissue chip for different distribution patterns of galectin-9. Scale bar, 200 μm. Right, the proportions for four types of galectin-9 distribution are also summarized. E, Flow cytometry of HLA-A/B/C expression for monocultured or cocultured HN6 and CAFs. F, GSEA for cytokines-associated pathway enrichment of differentially expressed genes between clusters 5 and 6 CAFs. G and H, Gene expressions in CAFs treated with different cytokines (IFNα, IFNβ, IFNγ, TGFβ1, TGFβ2, TGFβ3, TNFα, and POSTN; the concentration of cytokines was 100 ng/mL). G, CAFs treated with cytokines for 24 hours were harvested for mRNA isolation and qRT-PCR. The data were pooled from three independent experiments and the relative expressions of targeted genes were analyzed relative to GAPDH or ACTB. H, CAFs treated with cytokines for 48 hours were harvested for Western blotting.
Figure 6. TCF1+GZMK+CD8+ T cells were negatively correlated with galectin-9+ CAFs. A, t-SNE plots of single-cell RNA sequencing result for the CD8+ T cells from the previous 5 paired tumoral and adjacent normal tissues. Cells were clustered into 8 populations (left) and origins (right) are also indicated in the t-SNE plots. B, Bar plots show cluster proportions in tumoral and adjacent tissues (left) and cluster proportions (right) in each sample. C, Bar plots show sample fraction in each cluster. D, Pseudotime analysis of CD8+ T cells by “DiffusionMap” algorithm. Cells were labeled by tissue origins (left) or clusters (middle). Right, the top two major diffusion compounds distribution of cells from different clusters. Arrows, differentiation directions. E, Regression analysis of the fraction of galectin-9+ CAFs in total CAFs and the fraction of eight clusters of CD8+ T cells from the 5 tumoral tissues. F, Expression of genes defining cytotoxic functions (GZMA, GZMB, GZMK, IFNG, and PRF1) and status (TCF1, PDCD1, CTLA4, HAVCR2, LAG3, and TIGIT) of CD8+ T cells and the genes coding the receptors of galectin-9 (CD44, HAVCR2) in the 8 clusters of CD8+ T cells. G, Representative immunofluorescence results of human HNSCC tumor samples stained for PanCK (green), galectin-9 (yellow), CD8α (red), and TCF1 (purple). Scale bar, 1 mm.
Figure 6.
TCF1+GZMK+CD8+ T cells were negatively correlated with galectin-9+ CAFs. A, t-SNE plots of single-cell RNA sequencing result for the CD8+ T cells from the previous 5 paired tumoral and adjacent normal tissues. Cells were clustered into 8 populations (left) and origins (right) are also indicated in the t-SNE plots. B, Bar plots show cluster proportions in tumoral and adjacent tissues (left) and cluster proportions (right) in each sample. C, Bar plots show sample fraction in each cluster. D, Pseudotime analysis of CD8+ T cells by “DiffusionMap” algorithm. Cells were labeled by tissue origins (left) or clusters (middle). Right, the top two major diffusion compounds distribution of cells from different clusters. Arrows, differentiation directions. E, Regression analysis of the fraction of galectin-9+ CAFs in total CAFs and the fraction of eight clusters of CD8+ T cells from the 5 tumoral tissues. F, Expression of genes defining cytotoxic functions (GZMA, GZMB, GZMK, IFNG, and PRF1) and status (TCF1, PDCD1, CTLA4, HAVCR2, LAG3, and TIGIT) of CD8+ T cells and the genes coding the receptors of galectin-9 (CD44, HAVCR2) in the 8 clusters of CD8+ T cells. G, Representative immunofluorescence results of human HNSCC tumor samples stained for PanCK (green), galectin-9 (yellow), CD8α (red), and TCF1 (purple). Scale bar, 1 mm.
Figure 7. Galectin-9+ CAFs were associated with dysfunctional differentiation of TCF1+ CD8+ T cells. A, Tumor growth of subcutaneous coinjection of SCC VII and Lgals9-KD MTFs. Purple arrows, intratumoral injection time points of the anti-CD8α antibody or saline. B and C, The flow cytometry results of the proportion of CD8+ T expressing the immune checkpoint (TIM3, TIGIT, and CTLA4), the cytotoxic cytokine (granzyme B, GZMB) and TCF1, which are isolated from subcutaneous tumors formed by coinjection of SCC VII and MTFs. D, The proportion of CD8+ T cells in CD45+ cells in subcutaneous tumors formed by coinjection of SCC VII and MTFs. E, A diagrammatic sketch for coculture experiments of LGALS9-KD CAFs and CD8+ T cells from the same patients. F, The flow cytometry results of expression for TIGIT, perforin, and TCF1 in CD8+ T cells after coculturing with CAFs. G, Representative multiple immunofluorescent staining results of excluded or infiltrated HNSCC tumor samples stained for PanCK (white), galectin-9 (green), CD8α (cyan), TCF1 (red), and COL1A1 (orange). Yellow arrows, TCF1+CD8+ T cells around Gal9+ CAFs. Scale bars, respectively, indicate 2 mm in the large-scaled images and 50 μm in the magnified images. H, Distribution of the distances between TCF1+ CD8+ cells and galectin-9+ CAFs nuclei for 5 pairs of excluded and infiltrated HNSCC tumors. I, The percentage of TCF1+ CD8+ cells within 150 μm to galectin-9+ CAFs in the excluded and infiltrated HNSCC tumors. J, Correlation between cell density of CD8α+ cells and galectin-9+ CAFs in the 10 HNSCC tumors. K, Illustration of mechanisms for restriction of TCF1+GZMK+CD8+ T cells by MHC-IhiGal9+ CAFs. Statistics are shown in mean ± SEM (A) or mean ± SD (B–D, F, and J) accessed by unpaired t test. *, P < 0.05; **, P < 0.01; ***, P < 0.001; ****, P < 0.0001.
Figure 7.
Galectin-9+ CAFs were associated with dysfunctional differentiation of TCF1+ CD8+ T cells. A, Tumor growth of subcutaneous coinjection of SCC VII and Lgals9-KD MTFs. Purple arrows, intratumoral injection time points of the anti-CD8α antibody or saline. B and C, The flow cytometry results of the proportion of CD8+ T expressing the immune checkpoint (TIM3, TIGIT, and CTLA4), the cytotoxic cytokine (granzyme B, GZMB) and TCF1, which are isolated from subcutaneous tumors formed by coinjection of SCC VII and MTFs. D, The proportion of CD8+ T cells in CD45+ cells in subcutaneous tumors formed by coinjection of SCC VII and MTFs. E, A diagrammatic sketch for coculture experiments of LGALS9-KD CAFs and CD8+ T cells from the same patients. F, The flow cytometry results of expression for TIGIT, perforin, and TCF1 in CD8+ T cells after coculturing with CAFs. G, Representative multiple immunofluorescent staining results of excluded or infiltrated HNSCC tumor samples stained for PanCK (white), galectin-9 (green), CD8α (cyan), TCF1 (red), and COL1A1 (orange). Yellow arrows, TCF1+CD8+ T cells around Gal9+ CAFs. Scale bars, respectively, indicate 2 mm in the large-scaled images and 50 μm in the magnified images. H, Distribution of the distances between TCF1+ CD8+ cells and galectin-9+ CAFs nuclei for 5 pairs of excluded and infiltrated HNSCC tumors. I, The percentage of TCF1+ CD8+ cells within 150 μm to galectin-9+ CAFs in the excluded and infiltrated HNSCC tumors. J, Correlation between cell density of CD8α+ cells and galectin-9+ CAFs in the 10 HNSCC tumors. K, Illustration of mechanisms for restriction of TCF1+GZMK+CD8+ T cells by MHC-IhiGal9+ CAFs. Statistics are shown in mean ± SEM (A) or mean ± SD (B–D, F, and J) accessed by unpaired t test. *, P < 0.05; **, P < 0.01; ***, P < 0.001; ****, P < 0.0001.

References

    1. Carlisle JW, Steuer CE, Owonikoko TK, Saba NF. An update on the immune landscape in lung and head and neck cancers. CA Cancer J Clin 2020;70:505–17. - PubMed
    1. Ruffin AT, Li H, Vujanovic L, Zandberg DP, Ferris RL, Bruno TC. Improving head and neck cancer therapies by immunomodulation of the tumour microenvironment. Nat Rev Cancer 2023;23:173–88. - PMC - PubMed
    1. Rafiq S, Hackett CS, Brentjens RJ. Engineering strategies to overcome the current roadblocks in CAR T-cell therapy. Nat Rev Clin Oncol 2020;17:147–67. - PMC - PubMed
    1. Park J, Hsueh PC, Li Z, Ho PC. Microenvironment-driven metabolic adaptations guiding CD8+ T-cell antitumor immunity. Immunity 2023;56:32–42. - PubMed
    1. Davidson S, Coles M, Thomas T, Kollias G, Ludewig B, Turley S, et al. . Fibroblasts as immune regulators in infection, inflammation, and cancer. Nat Rev Immunol 2021;21:704–17. - PubMed

Publication types

MeSH terms