. 2024 Feb 1;147(2):717-734.
doi: 10.1093/brain/awad375.

Caspase cleavage of gasdermin E causes neuronal pyroptosis in HIV-associated neurocognitive disorder

Affiliations

Caspase cleavage of gasdermin E causes neuronal pyroptosis in HIV-associated neurocognitive disorder

Jason P Fernandes et al. Brain. .

Abstract

Despite effective antiretroviral therapies, 20-30% of persons with treated HIV infection develop a neurodegenerative syndrome termed HIV-associated neurocognitive disorder (HAND). HAND is driven by HIV expression coupled with inflammation in the brain but the mechanisms underlying neuronal damage and death are uncertain. The inflammasome-pyroptosis axis coordinates an inflammatory type of regulated lytic cell death that is underpinned by the caspase-activated pore-forming gasdermin proteins. The mechanisms driving neuronal pyroptosis were investigated herein in models of HAND, using multi-platform molecular and morphological approaches that included brain tissues from persons with HAND and simian immunodeficiency virus (SIV)-infected non-human primates as well as cultured human neurons. Neurons in the frontal cortices from persons with HAND showed increased cleaved gasdermin E (GSDME), which was associated with β-III tubulin degradation and increased HIV levels. Exposure of cultured human neurons to the HIV-encoded viral protein R (Vpr) elicited time-dependent cleavage of GSDME and Ninjurin-1 (NINJ1) induction with associated cell lysis that was inhibited by siRNA suppression of both proteins. Upstream of GSDME cleavage, Vpr exposure resulted in activation of caspases-1 and 3. Pretreatment of Vpr-exposed neurons with the caspase-1 inhibitor, VX-765, reduced cleavage of both caspase-3 and GSDME, resulting in diminished cell death. To validate these findings, we examined frontal cortical tissues from SIV-infected macaques, disclosing increased expression of GSDME and NINJ1 in cortical neurons, which was co-localized with caspase-3 detection in animals with neurological disease. Thus, HIV infection of the brain triggers the convergent activation of caspases-1 and -3, which results in GSDME-mediated neuronal pyroptosis in persons with HAND. These findings demonstrate a novel mechanism by which a viral infection causes pyroptotic death in neurons while also offering new diagnostic and therapeutic strategies for HAND and other neurodegenerative disorders.

Keywords: HIV; caspase; neurodegeneration; neuroinflammation; neuron; pyroptosis.


Conflict of interest statement

The authors report no competing interests.

Figures
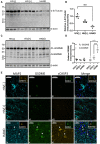
Figure 1
Figure 1
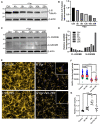
GSDME expression is increased in HAND brains. Frontal cortex tissues from HIV-infected persons (HIV[+], without neurological disease) or HAND as well as uninfected persons (HIV[−]) were analysed. (A) Immunoblot showing β-III tubulin expression in HIV[−], HIV[+] and HAND cortical lysates. (B) Ratio of β-III tubulin immunoreactivity to β-actin immunoreactive band intensity expressed relative to the mean immunoreactivity of the HIV[−] group. (C) Representative immunoblots showing expression of full length (FL) GSDME and its active cleavage product (N-GSDME) in cortical lysates from each clinical group. Immunoblots were performed using an antibody raised against the N-terminal fragment of GSDME. (D) FL-GSDME and N-GSDME immunoreactivity normalized to β-actin ratios, expressed relative to the mean immunoreactivity for the HIV[−] group. (E) Confocal microscopy of representative frontal cortex from each group that was immunolabelled for MAP2, active caspase-3 (cleavage specific; cCASP3) and GSDME. Insets show representative images from frontal cortex tissue immunolabelled for MAP2 and NINJ1. Each data-point in B and D represents a sample from an individual person; errors bars show standard deviation. Statistical significance was assessed by one-way ANOVA (B) or two-way ANOVA (D) with Tukey's post hoc analysis. *P < 0.05, **P < 0.01, ****P < 0.0001). GSDME = gasdermin E; HAND = HIV-associated neurocognitive disorder.
Figure 2
Figure 2
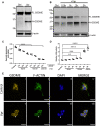
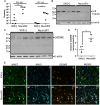
HIV viral protein R exposure induces GSDME cleavage and lytic neuronal death. (A) Differentiated human neuronal cells were exposed to viral protein R (Vpr) (150 nM) for 4 h or mock-exposed and subsequently processed into protein lysates. Immunoblotting using an antibody raised against N-GSDME shows levels of full-length (FL-GSDME) and cleaved GSDME (N-GSDME) following Vpr exposure. (B) Immunoblot shows levels of FL-GSDME and N-GSDME following Vpr exposure (150 nM) for 0.5–3 h. (C) Cell viability and (D) lactate dehydrogenase (LDH) cytotoxicity assays performed in differentiated human neuronal cells following exposure to Vpr; the LDH assay-derived values were normalized to the mean LDH activity in supernatants from mock-exposed (control) cells. (E) Neuronal cells were exposed to Vpr (150 nM) followed by fixation and immunolabelled using an antibody to GSDME followed by nuclear (DAPI) and F-actin staining. Statistical significance was assessed by one-way ANOVA with Dunnett's post hoc analysis. **P < 0.01, ***P < 0.001, ****P < 0.0001. GSDME = gasdermin E.
Figure 3
Figure 3
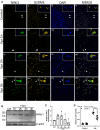
NINJ1 expression and localization in viral protein R-exposed neuronal cells. (A) Neuronal cells were exposed to viral protein R (Vpr) for 1–3 h or mock-exposed (Control), followed by fixation with immunolabelling with antibodies against NINJ1 and GSDME as well as DAPI stained. Insets show reconstructions of cells (by arrows), using confocal data over 10 planes in the z-axis. (B and C) Neuronal cells were exposed to Vpr (100 nM) for 1–4 h. (B) Immunoblot using antibody raised against the NINJ1 C-terminus shows increased immunoreactive bands following Vpr (100 nM) exposure. (C) NINJ1 immunoreactivity normalized to β-actin and expressed relative to normalized immunoreactivity in mock-exposed control (Ctrl) neuronal cells. (D) Neuronal cells were transfected with NINJ1 (siNINJ1) targeting siRNA or control siRNA (siNon-coding) for 72 h and exposed to Vpr (150 nM)for 4 h. Supernatant from each condition was assayed for lactate dehydrogenase (LDH) release and is shown relative to siNon-coding Vpr-exposed cells. ****P < 0.0001, one-way ANOVA with Dunnett's post hoc analysis.
Figure 4
Figure 4
Inflammasome activation and associated plasma membrane rupture in neuronal cells exposed to viral protein R. (A) Differentiated human neuronal cells were exposed to viral protein R (Vpr) (150 nM) from which immunoblots showed full-length and cleaved (p33) caspase-1 immunoreactive bands. (B) Immunoblot showing ASC expression in neuronal cells following exposure to Vpr (150 nM). (C) Neuronal cells were transfected with siRNAs that targeted NLRP3 (siNLRP3), caspase-1 (siCaspase-1) or control siRNA (siNon-Coding, NC) for 72 h followed by Vpr (150 nM) exposure. Lactate dehydrogenase (LDH) assay showed released LDH in supernatants under each condition (relative to Vpr-exposed siNon-coding treated cells) after 1 h of Vpr exposure. (DF) Neuronal cells were pretreated with VX-765 (100 μM) for 1.5 h followed by exposure to Vpr (150 nM) for 3 h and (D) subsequent cell viability, (E) LDH release (relative to control cells) and (F) SYTOX uptake assays were performed and assessed relative to total number of DAPI-positive cells. CF were assessed by one-way ANOVA with Dunnett's post hoc analysis. ***P < 0.001, ****P < 0.0001.
Figure 5
Figure 5
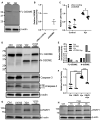
Caspase-1 inhibition prevents activation of GSDME and caspase-3 in viral protein R-exposed neuronal cells. Differentiated human neuronal cells were transfected with control siRNA (siNon-coding, NC) or GSDME targeting siRNAs (siGSDME; GE) for 72 h followed by exposure to viral protein R (Vpr) (150 nM). (A) Immunoblotting for GSDME using lysates from non-Vpr exposed neuronal cells shows knockdown of GSDME and (B) was normalized to β-actin and expressed relative to siNon-coding control. (C) Lactate dehydrogenase (LDH) assay was performed on supernatants from mock- or Vpr (150 nM)-exposed cells and LDH activity is shown relative to siNon-coding Vpr exposed cells (one-way ANOVA with Dunnett's post hoc analysis, *P < 0.01). (D) Neuronal cells were pretreated with VX765 (100 μM, 1.5 h) followed by Vpr (150 nM, 3.5 h) exposure and immunoblotting was performed. (E) Quantitation of full-length (FL-GSDME) and cleaved (N-GSDME) GSDME immunoreactive bands. (F) To examine the involvement of caspase-3 in Vpr-mediated pyroptosis, neuronal cells were pretreated with the caspase-3 inhibitor Z-DEVD-FMK (100 μM, 2 h) followed by Vpr exposure (150 nM, 3.5 h) with subsequent LDH release analysis (expressed relative to Vpr alone; one way ANOVA with Dunnett's post hoc analysis, ****P < 0.0001). (G) Immunoblot showing reduced cleaved PARP1 (cPARP1) levels in neuronal cells following pretreatment with VX765 and subsequent exposure to Vpr and (H) increased cPARP1 immunoreactive band density levels in neuronal cells following exposure to Vpr over time. GSDME = gasdermin E.
Figure 6
Figure 6
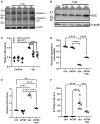
Primary human neurons exposed to viral protein R display GSDME cleavage and plasma membrane rupture. Primary human neurons (PHNs) were exposed to viral protein R (Vpr) (150 nM) for indicated periods, followed by lysate collection. (A) Immunoblotting was conducted to assess (A) β-III tubulin immunoreactive band density, (B) which was quantified in relation to β-actin immunoreactivity. Similarly, (C) FL-GSDME and N-GSDME immunoreactive bands were detected by immunoblot and (D) quantified relative to β-actin immunoreactivity. (EG) PHNs were exposed to Vpr (100 nM, 18 h) with or without VX-765 pretreatment (100 uM, 2 h) followed by immunolabelling against MAP2 (E and F) and (G) supernatant LDH assay. (E) Representative images of MAP2 immunolabelled PHNs with insets showing neurite morphology. (F) Neurite lengths of MAP2 immunolabelled PHNs were measured over 25–36 fields of view and pooled from four separate tissue donors (indicated by colour; one-way ANOVA with Tukey's post hoc analysis, **P < 0.01, ****P < 0.0001). (G) Lactate dehydrogenase (LDH) assay of supernatants from PHNs, expressed relative to unexposed (control) measurements (one-way ANOVA with Dunnett's post hoc analysis, ****P < 0.0001). FL = full-length; GSDME = gasdermin E; n.s. = not significant.
Figure 7
Figure 7
Neuronal GSDME induction in cortex from animals with NeuroSIV. Indian Rhesus macaques infected with SIVmac251 were stratified based on the presence (NeuroSIV) or absence (SIV[+]) of neurological disease. (A) SIV pol and vpr transcript levels in frontal cortex from each animal was measured by ddPCR. Line represents median value (Mann-Whitney U-test, *P < 0.05). (B) Immunoblot showing β-III tubulin expression in cortex from individual animals in each group. (C) Immunoblot showing full-length (FL)-GSDME expression in cortex tissue. (D) Quantification of FL-GSDME immunoreactivity normalized to β-actin and expressed relative to the average of the SIV[+] group. Unpaired t-test, **P < 0.01. (E) Frontal cortical sections from each group were immunolabelled using antibodies against MAP2 (as a neuronal marker), NINJ1 and GSDME. GSDME = gasdermin E; SIV = simian immunodeficiency virus.
Figure 8
Figure 8
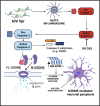
HIV induces the inflammasome-pyroptosis axis in neurons. HIV infection results in viral protein R (Vpr) release and exposure to neurons causing activation of the NLRP3 inflammasome and caspase-1. Caspase-1 cleavage results in caspase-3 activation that was blocked by a caspase-1 inhibitor (VX-765). Activation of caspase-3 permitted it to cleave established substrates such as PARP1 and GSDME. Cleaved (active) N-GSDME forms pores on the neuronal plasma membrane that was amplified by NINJ1 induction, resulting in nuclear disintegration, PMR and eventual pyroptotic neuronal death.

Comment in

References

    1. Moujalled D, Strasser A, Liddell JR. Molecular mechanisms of cell death in neurological diseases. Cell Death Differ. 2021;28:2029–2044. - PMC - PubMed
    1. Zhang S, Tang M-B, Luo H-Y, Shi C-H, Xu Y-M. Necroptosis in neurodegenerative diseases: A potential therapeutic target. Cell Death Dis. 2017;8:e2905. - PMC - PubMed
    1. McKenzie BA, Dixit VM, Power C. Fiery cell death: Pyroptosis in the central nervous system. Trends Neurosci. 2020;43:55–73. - PubMed
    1. Galluzzi L, Vitale I, Aaronson SA, et al. . Molecular mechanisms of cell death: Recommendations of the Nomenclature Committee on Cell Death 2018. Cell Death Differ. 2018;25:486–541. - PMC - PubMed
    1. Bock FJ, Riley JS. When cell death goes wrong: Inflammatory outcomes of failed apoptosis and mitotic cell death. Cell Death Differ. 2023;30:293–303. - PMC - PubMed

Publication types