. 2024 Apr 4;147(4):1344-1361.
doi: 10.1093/brain/awad373.

Interferon-γ controls aquaporin 4-specific Th17 and B cells in neuromyelitis optica spectrum disorder

Affiliations

Interferon-γ controls aquaporin 4-specific Th17 and B cells in neuromyelitis optica spectrum disorder

Gabriel Arellano et al. Brain. .

Abstract

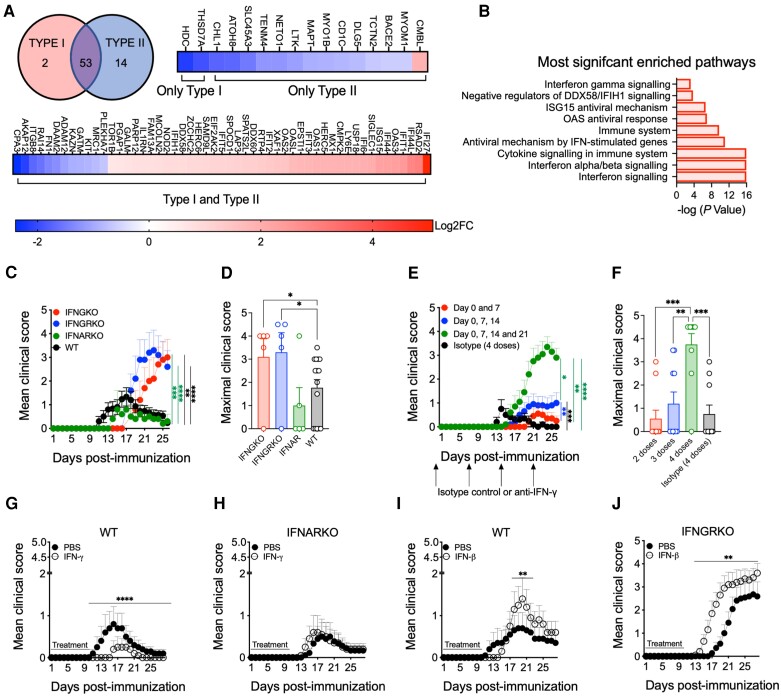
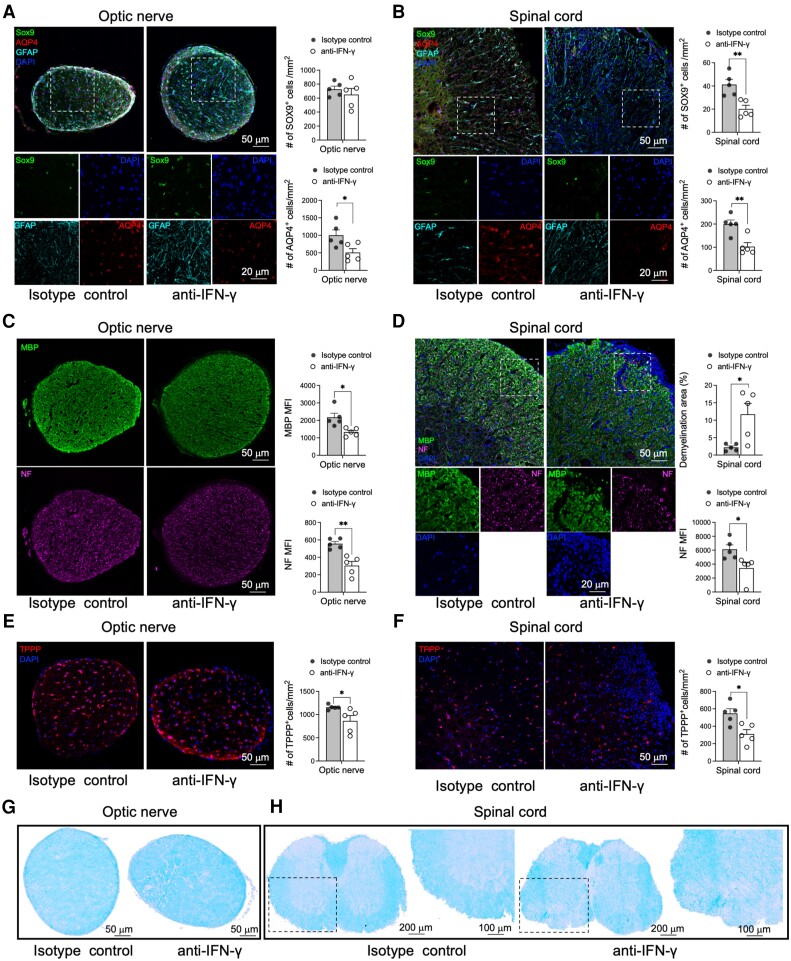
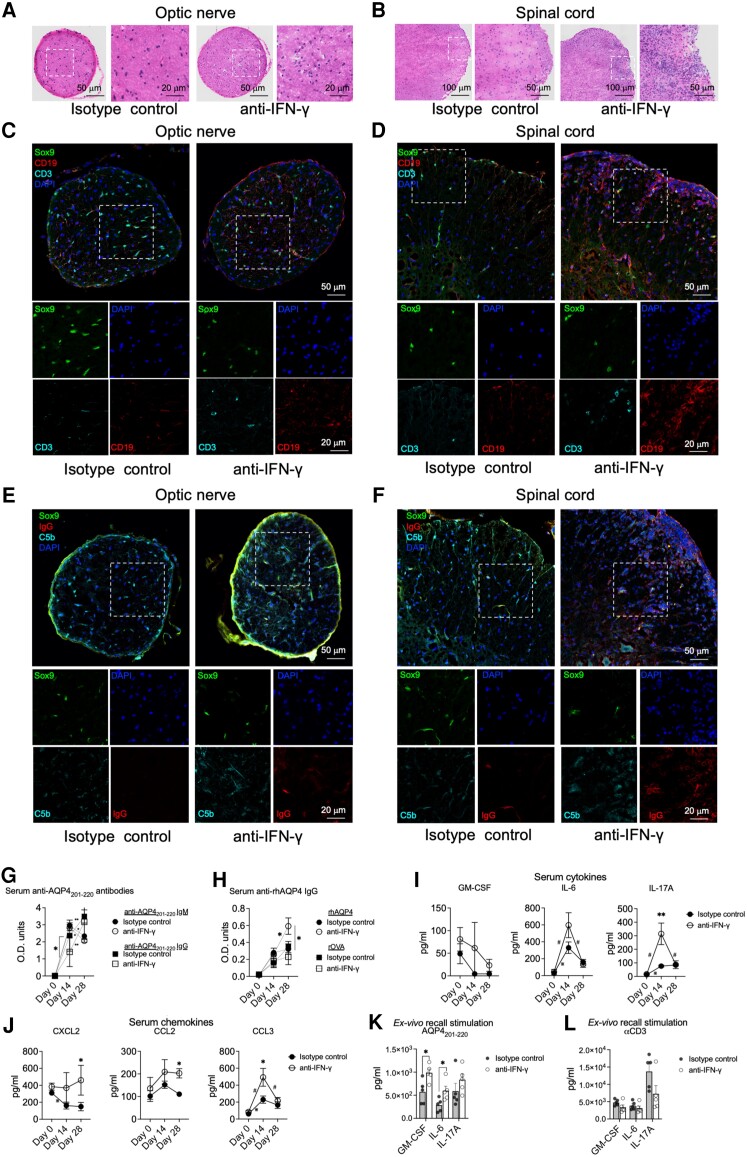
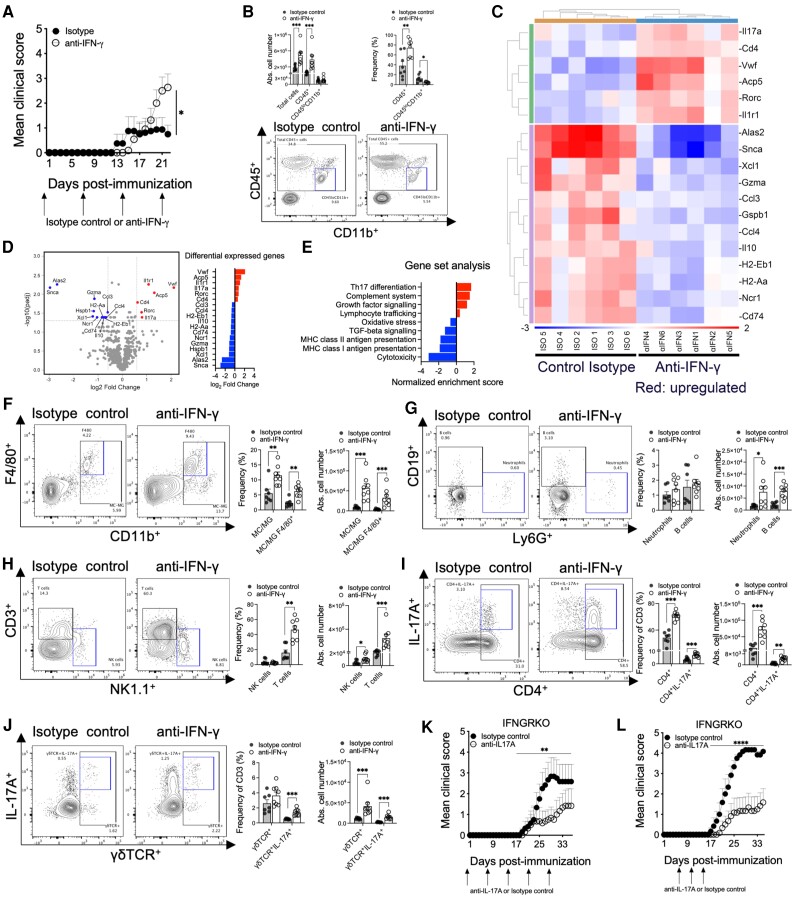
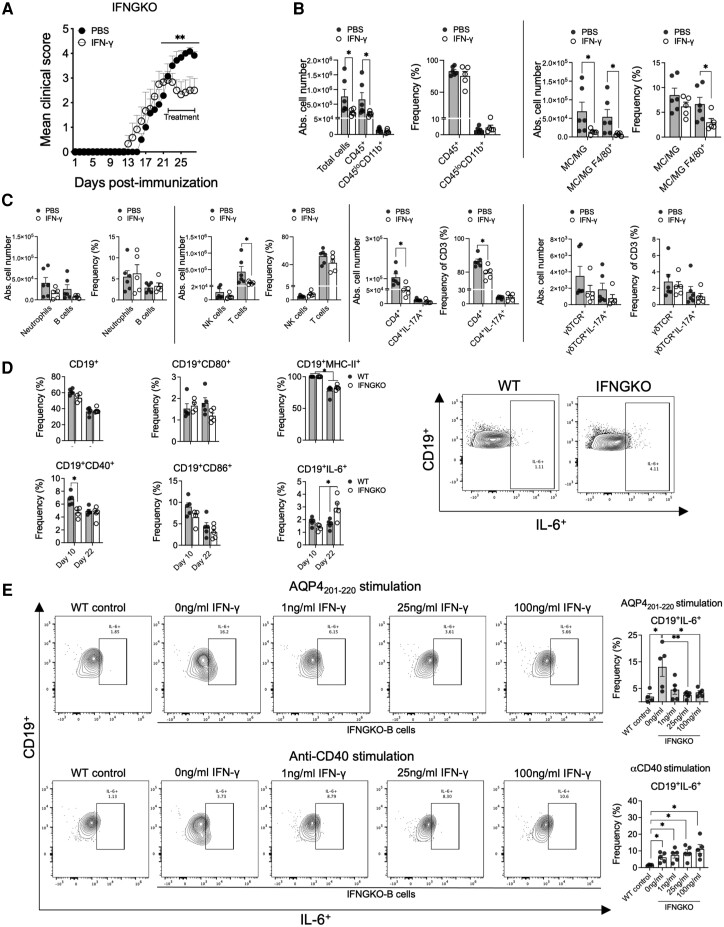
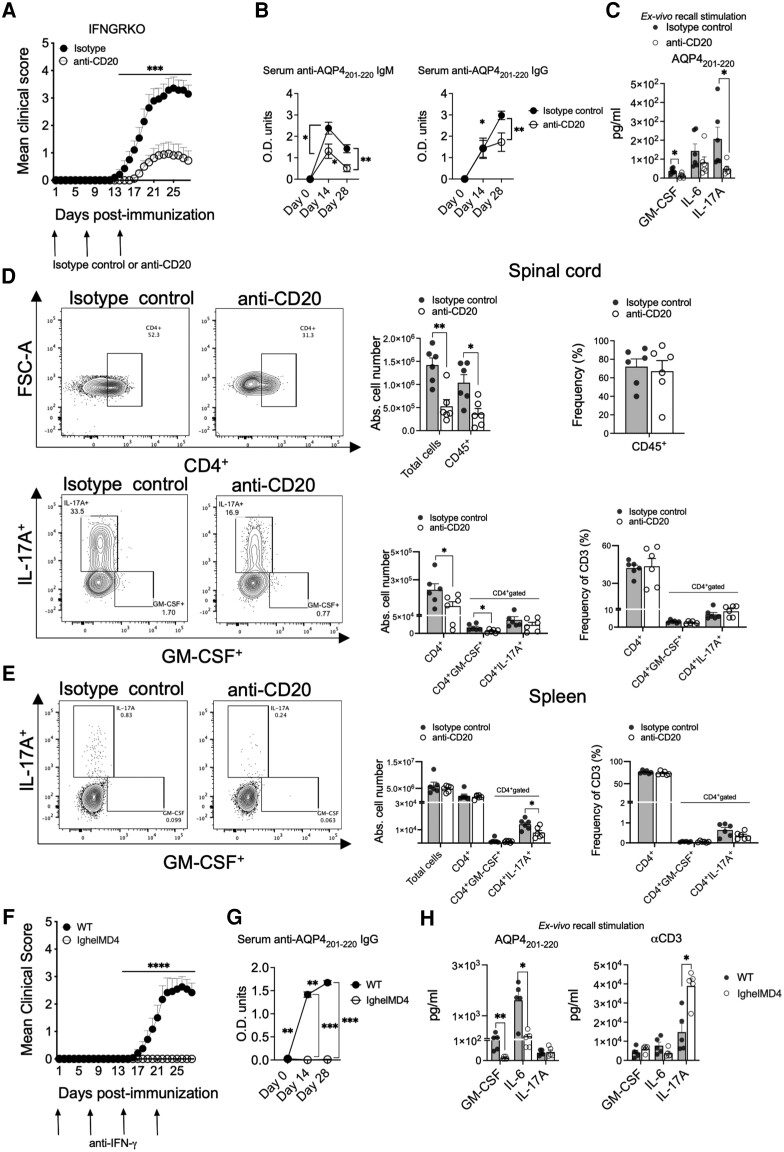
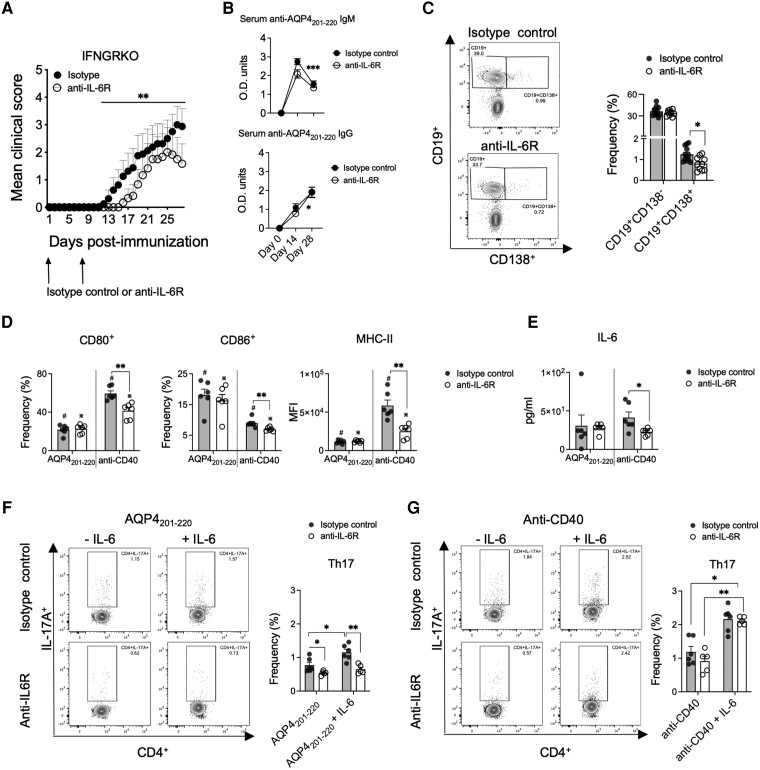
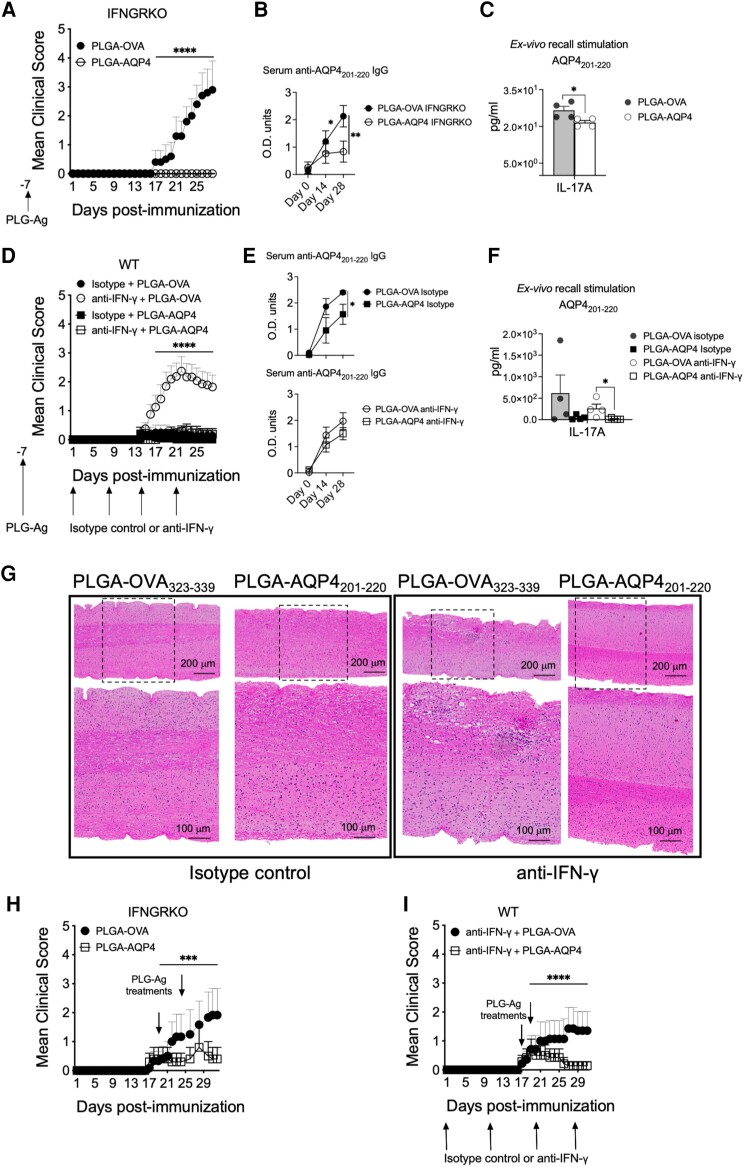
Neuromyelitis optica spectrum disorder (NMOSD) is a CNS autoimmune inflammatory disease mediated by T helper 17 (Th17) and antibody responses to the water channel protein, aquaporin 4 (AQP4), and associated with astrocytopathy, demyelination and axonal loss. Knowledge about disease pathogenesis is limited and the search for new therapies impeded by the absence of a reliable animal model. In our work, we determined that NMOSD is characterized by decreased IFN-γ receptor signalling and that IFN-γ depletion in AQP4201-220-immunized C57BL/6 mice results in severe clinical disease resembling human NMOSD. Pathologically, the disease causes autoimmune astrocytic and CNS injury secondary to cellular and humoral inflammation. Immunologically, the absence of IFN-γ allows for increased expression of IL-6 in B cells and activation of Th17 cells, and generation of a robust autoimmune inflammatory response. Consistent with NMOSD, the experimental disease is exacerbated by administration of IFN-β, whereas repletion of IFN-γ, as well as therapeutic targeting of IL-17A, IL-6R and B cells, ameliorates it. We also demonstrate that immune tolerization with AQP4201-220-coupled poly(lactic-co-glycolic acid) nanoparticles could both prevent and effectively treat the disease. Our findings enhance the understanding of NMOSD pathogenesis and provide a platform for the development of immune tolerance-based therapies, avoiding the limitations of the current immunosuppressive therapies.

Keywords: animal model; aquaporin 4; immune tolerance; interferon-γ; neuromyelitis optica spectrum disorder.


Conflict of interest statement

S.D.M. is an academic co-founder, scientific advisory board member, paid consultant and grantee of COUR Pharmaceuticals and a consultant for NextCure and Takeda Pharmaceuticals. J.R.P. is an employee of COUR Pharmaceuticals. R.B. has received honoraria from Biogen, Teva Pharmaceuticals, Sanofi and Alexion. B.P. is a member of the scientific advisory board of Inflectis Bioscience. The other authors report no competing interests.

Figures

Figure 1
Figure 1
Opposing roles of type I and type II interferons in the regulation of neuromyelitis optica spectrum disorder and AQP4201–220-induced disease. (A) Venn diagram and differentially expressed genes (DEGs) following Interferome analysis for type I and type II IFN-regulated genes (a total of 69 of 87 genes regulated by IFNs) from whole blood of untreated neuromyelitis optica spectrum disorder (NMOSD) patients versus healthy donors obtained from publicly available RNA sequencing data (see ‘Materials and methods’ section). (B) Reactome pathway enrichment analysis of DEGs (total of 87 DEGs). Mean clinical score (C) and maximal clinical score (D) were evaluated in AQP4201–220-immunized wild-type (WT) (black, n = 15), IFN-γ-knockout (IFNGKO; red, n = 5), IFN-γ-receptor knockout (IFNGRKO; blue, n = 5) and type I IFN-receptor knockout (IFNARKO; green, n = 5) mice. Mean clinical scores (E) and maximal clinical scores (F) were recorded in AQP4201–220-immunized WT mice treated with two (red, n = 10), 3 (blue, n = 10) or four (green, n = 10) weekly doses starting from Day 0 of anti-IFN-γ, or isotype control antibodies (filled circles, total of four doses, n = 10). Administration of IFN-γ to WT (G) and IFNARKO (H), or IFN-β to WT (I) and IFNGRKO (J) mice was performed for 10 days beginning on the day of immunization (n = 10). All data are presented as mean ± standard error of the mean (SEM). Statistical analyses were performed using the Mann–Whitney test. *P < 0.05, **P < 0.01, ***P < 0.001.
Figure 2
Figure 2
AQP4201–220-induced disease is characterized by loss of astrocytes, oligodendrocytes, myelin and axons. Optic nerve (A, C and E) and lumbar spinal cord (B, D and F) sections were obtained from isotype control- and anti-IFN-γ-treated mice at Day 22 post-immunization (p.i.) and immunostained for astrocyte (Sox9-AQP4-GFAP-DAPI) (A and B), myelin (MBP-DAPI), neurofilament (NF-DAPI) (C and D) and oligodendrocyte (TPPP-DAPI) markers (E and F). The immunofluorescent images were accompanied by a statistical comparison of the markers’ mean fluorescence intensity (MFI) between the isotype control- and anti-IFN-γ-treated groups. Luxol fast blue (LFB) staining was performed to examine optic nerve (G) and lumbar spinal cord (H) for evidence of demyelination. The rectangle delineates an area of the anterior spinal columns that demonstrates loss of LFB staining depicted at low and high magnifications. Scale bars of 20, 50, 100 and 200 μm are indicated on the images. All data are presented as mean ± SEM (n = 5). Statistical analyses were performed using the Mann–Whitney test. *P < 0.05, **P < 0.01.
Figure 3
Figure 3
IFN-γ regulates peripheral immune responses and CNS infiltration of inflammatory cells in AQP4201–220-induced disease. Optic nerve (A, C and E) and spinal cord (B, D and F) sections from wild-type (WT) mice treated with either anti-IFN-γ or isotype control antibodies were analysed at Day 22 post-immunization (p.i.) using haematoxylin and eosin staining (A and B), and Sox9-CD3-CD19-DAPI (C and D), Sox9-C5b-IgG-DAPI (E and F) immunostaining. Scale bars for 20, 50 and 100 μm are indicated on the images. Optical densities of total serum levels of anti-AQP4201–220-specific IgM (circles) and IgG (squares) in peptide-immunized mice treated with anti-IFN-γ (open circles, n = 9) or isotype control (filled circles, n = 11) antibodies were determined by ELISA before immunization at Day 0 and at Days 14 and 28 p.i. (G). Serum IgG antibody levels against recombinant human AQP4 (rhAQP4) or rOVA (control protein) were also determined (H). Serum levels of GM-CSF, IL-6 and IL-17 cytokines (I), and CXCL2, CCL2 and CCL3 chemokines (J) from AQP4201–220-immunized mice treated with anti-IFN-γ (n = 6) or isotype control (n = 6) antibodies were determined by multiplex cytokine assay prior immunization at Day 0 and at Days 14 and 28 p.i. Ex vivo recall analysis was performed using supernatants (multiplex cytokine analysis of GM-CSF, IL-6 and IL-17A) from splenocytes of anti-IFN-γ-treated (n = 5) or isotype control-treated (n = 5) groups obtained at Day 18 p.i. and following cell culture for 72 h in the presence of 40 μg/ml AQP4201–220 peptide (K) or 1 μg/ml of soluble anti-CD3 antibody (L). All data are presented as mean ± SEM. Statistical analyses were performed using the Mann–Whitney test: *P < 0.05, **P < 0.01; #,*statistically significant difference between Days 0–14 or 14–28 p.i. in anti-IFN-γ- or isotype control-treated groups, respectively.
Figure 4
Figure 4
Anti-IFN-γ enhancement of AQP4201–220-induced disease is driven by Th17 cells. Mean clinical scores of AQP4201–220-immunized wild-type (WT) mice treated with anti-IFN-γ (four doses, open circles, n = 8) or isotype control (four doses, filled circles, n = 11) until Day 22 post-immunization (p.i.) (A). Absolute cell number of mononuclear cells obtained from the spinal cords of anti-IFN-γ-treated (n = 8) and isotype control-treated (n = 7) groups (B). CD45+ and CD45loCD11b+ cell number and frequency were analysed by flow cytometry. Total RNA from mononuclear cells obtained from the spinal cord of anti-IFN-γ-treated (n = 6) and isotype control-treated (n = 6) groups were analysed, and a hierarchical heatmap clustering was created based on the most differentially expressed genes (C). A Volcano plot of RNA profiles comparing anti-IFN-γ versus isotype control treatments, and pathway enrichment analysis of the most differentially expressed gene sets (D and E). Absolute cell number and frequencies of monocytes/macrophages (MC)/activated microglia (MG; CD45hi), MC/MG F4/80+, Neutrophils Ly6G+, NK (NK1.1+), CD3+, CD4+, CD4+17A+, γδTCR+, γδTCR+IL-17A+, CD19+ cells were determined by flow cytometry analyses (FJ). Administration of anti-IL-17A (open circles) or isotype control (filled circles) antibodies to IFNGRKO mice, as weekly doses beginning at Day 0 (K) or three doses beginning at Days 6, 10 and 14 p.i. (n = 6) (L). All data are presented as mean ± SEM. Statistical analyses were performed using the Mann–Whitney test. *P < 0.05, **P < 0.01** and ***P < 0.001.
Figure 5
Figure 5
IFN-γ treatment reduces clinical severity and CNS inflammatory cell infiltration in IFN-γ knockout (IFNGKO) mice with AQP4 201-220 -induced disease. Mean clinical scores of AQP4201-220-immunized IFNGKO mice treated daily with recombinant IFN-γ (open circles, n = 5) or PBS (filled circles, n = 6) starting at the peak of the disease (Day 21) (A). Absolute cell numbers of total CNS mononuclear cells, CD45+ cells and CD45loCD11b+ cells (analysed by flow cytometry) for IFN-γ-treated (open circles) (n = 6) or PBS-treated (filled circles) (n = 5) mice (B). Absolute cell number and frequencies of monocytes/macrophages (MC)/activated microglia (MG;CD45hi), MC/MGF4/80+, Neutrophils Ly6G+, NK (NK1.1+), CD3+, CD4+, CD4+17A+, γδTCR+, γδTCR+IL-17A+ and CD19+ cells were determined by flowcytometry analyses (C). Flow cytometry frequency analysis of expression of activation markers (CD40, CD80, CD86, MHC-II and IL-6) on CD19+ cells at Days 10 and 22 post-immunization (p.i.) in wild-type (WT) (n = 5) and IFNGKO (n = 5) AQP4201-220-immunized mice (D). Pan-B cells purified from spleens of IFNGKO mice stimulated with 40 μg/ml AQP4201-220 peptide or 1 μg/ml of coated anti-CD40 antibody for 72 h, with 0, 1, 25 and 100 ng/ml of IFN-γ. Frequencies of CD19+IL-6+ B cells were determined (E).WT pan-B cells were used as controls. All data are presented as mean ± SEM. Statistical analyses were performed using the Mann-Whitney test: *P < 0.05, **P < 0.01.
Figure 6
Figure 6
AQP4201–220-induced disease is strictly dependent on B-cell activation. Mean clinical scores of AQP4201–220-immunized IFN-γ-receptor knockout (IFNGRKO) mice treated with three weekly doses of anti-CD20 (open circles, n = 16) or isotype control (filled circles, n = 14) antibodies starting at Day 0 (A). Optical density of total serum AQP4201–220-specific IgM and IgG of mice treated with anti-CD20 (open circles, n = 8) or isotype control (filled circles, n = 6) antibodies were determined by ELISA at Days 0, 14 and 28 post-immunization (p.i.) (B). Ex vivo recall analysis (multiplex cytokine analysis) for GM-CSF, IL-6 and IL-17 of supernatants of splenocytes obtained from anti-CD20-treated (n = 6) and isotype control-treated (n = 6) mice at Day 28 p.i. and cultured for 72 h with 20 μg/ml AQP4201–220 peptide (C). Flow cytometry analysis of the absolute cell numbers and frequency of CD4+, CD4+GM-CSF+ and CD4+IL-17A+ T cells from the CNS (D) and spleen (E) of anti-CD20-treated (n = 6) or isotype control-treated (n = 6) mice. Mean clinical score of IghelMD4 (n = 10) and wild-type (WT) (n = 12) mice immunized and treated with weakly doses of anti-IFN-γ (F). Optical density of ELISA of total serum AQP4201–220-specific IgG for IghelMD4 (n = 6) and WT (n = 10) mice at Days 0, 14 and 28 p.i (G). Ex vivo recall analysis (multiplex cytokine analysis) for GM-CSF, IL-6, and IL-17A of supernatants of splenocytes obtained from IghelMD4 (n = 5) and WT (n = 5) mice at Day 28 p.i. and cultured for 72 h with 40 μg/ml AQP4201–220 peptide or 1 μg/ml of soluble anti-CD3 antibody (H). All data are presented as mean ± SEM. Statistical analyses were performed using the Mann–Whitney test. *P < 0.05, **P < 0.01, ***P < 0.001.
Figure 7
Figure 7
IL-6 signalling regulates severity of AQP4201–220-induced disease and modulates B-cell activation and induction of Th17 cells. Mean clinical scores of AQP4201–220-immunized IFN-γ-receptor knockout (IFNGRKO) mice treated with two weekly doses of anti-IL-6R (open circles, n = 10) or isotype control antibody (filled circles, n = 13) starting at Day 0 (A). Optical density of total serum anti-AQP4201–220-specific IgM and IgG of mice treated with anti-IL6R (open circles, n = 6) or isotype control (filled circles, n = 8) antibodies were determined by ELISA at Days 0, 14 and 28 post-immunization (p.i.) (B). Flow cytometry frequency analysis of spleen CD19+CD138+ and CD19+CD138 cells at Day 8 p.i. from mice treated with anti-IL6R (open circles, n = 10) and isotype control (filled circles, n = 12) antibodies (C). Flow cytometry frequency analysis of total CD19+ pan-B cells purified at Day 8 p.i. from spleens of anti-IL6R (n = 6)- or isotype control (n = 6)-treated mice stimulated with 40 μg/ml of AQP4201–220 peptide or 1 μg/ml of coated anti-CD40 for 72 h. Frequencies of CD80+ and CD86+ B cells, and MFI of MHC-II (D), as well as supernatant levels of IL-6 (measured by multiplex cytokine assay) (E) were determined. B cells stimulated for 24 h with either AQP4201–220 peptide (F) or anti-CD40 (G) were washed and replated with untouched purified CD4+ T cells from IFNGRKO mice at Day 9 p.i. at 1:1 ratio, with 0 or 10 ng/ml of recombinant IL-6 and cultured for 72 h, and the frequency of Th17 cells was assessed. All data are presented as mean ± SEM. Statistical analyses were performed using the Mann–Whitney test. *P < 0.05, **P < 0.01.
Figure 8
Figure 8
Immune tolerization by AQP4201–220-coupled PLGA nanoparticles both prevents and ameliorates established AQP4201–220-induced disease. Mean clinical scores of AQP4201–220-immunized IFN-γ-receptor knockout (IFNGRKO) (A and H) and anti-IFN-γ-treated wild-type (WT) (D and I) mice receiving prophylactic intravenous infusion of either PLGA-AQP4201–220 (PLGA-AQP4) or PLGA-OVA323–339 (PLGA-OVA) nanoparticles 7 days prior to AQP4201–220 immunization (Day −7) (A and D), or two therapeutic doses of nanoparticles at disease onset [Days 17–18 and Days 19–22 post-immunization (p.i.)] (H and I). See Supplementary Table 3 for the number of mice in each treatment group. Representative images of haematoxylin and eosin staining of lumbar spinal cord of isotype control- and anti-IFN-γ-treated WT mice that have received a prophylactic treatment with either PLGA-AQP4201–220 or PLGA-OVA323–339 7 days prior to immunization (G). Serum anti-AQP4201–220 IgG was measured by ELISA (B and E) and IL-17A secretion by splenocytes in ex vivo recall experiments quantitated by using multiplex cytokine assays (C and F). All data presented as mean ± SEM. Statistical analyses were performed using the Mann–Whitney test. ***P < 0.001, ****P < 0.0001. PLGA = poly(lactic-co-glycolic acid).

References

    1. Jarius S, Paul F, Weinshenker BG, Levy M, Kim HJ, Wildemann B. Neuromyelitis optica. Nat Rev Dis Primers. 2020;6:85. - PubMed
    1. Varrin-Doyer M, Spencer CM, Schulze-Topphoff U, et al. Aquaporin 4-specific T cells in neuromyelitis optica exhibit a Th17 bias and recognize clostridium ABC transporter. Ann Neurol. 2012;72:53–64. - PMC - PubMed
    1. Carnero Contentti E, Correale J. Neuromyelitis optica spectrum disorders: From pathophysiology to therapeutic strategies. J Neuroinflammation. 2021;18:208. - PMC - PubMed
    1. Saadoun S, Waters P, Bell BA, Vincent A, Verkman AS, Papadopoulos MC. Intra-cerebral injection of neuromyelitis optica immunoglobulin G and human complement produces neuromyelitis optica lesions in mice. Brain. 2010;133(Pt 2):349–361. - PMC - PubMed
    1. Pohl M, Kawakami N, Kitic M, et al. T cell-activation in neuromyelitis optica lesions plays a role in their formation. Acta Neuropathol Commun. 2013;1:85. - PMC - PubMed

Publication types