. 2023 Nov 2;25(11):euad324.
doi: 10.1093/europace/euad324.

Characterization of unipolar electrogram morphology: a novel tool for quantifying conduction inhomogeneity

Affiliations

Characterization of unipolar electrogram morphology: a novel tool for quantifying conduction inhomogeneity

Ziliang Ye et al. Europace. .

Abstract

Aims: Areas of conduction inhomogeneity (CI) during sinus rhythm may facilitate the initiation and perpetuation of atrial fibrillation (AF). Currently, no tool is available to quantify the severity of CI. Our aim is to develop and validate a novel tool using unipolar electrograms (EGMs) only to quantify the severity of CI in the atria.

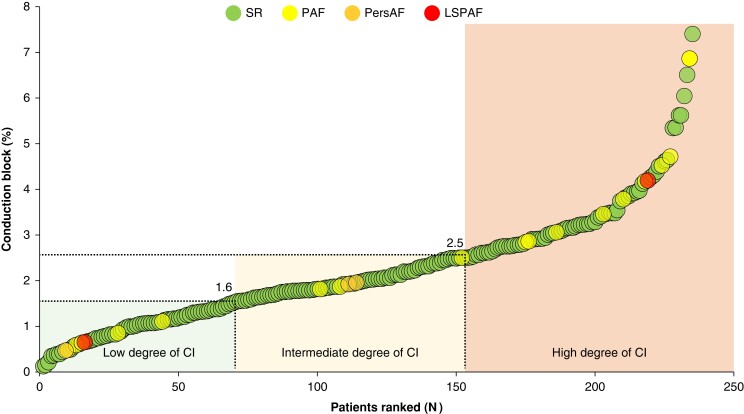
Methods and results: Epicardial mapping of the right atrium (RA) and left atrium, including Bachmann's bundle, was performed in 235 patients undergoing coronary artery bypass grafting surgery. Conduction inhomogeneity was defined as the amount of conduction block. Electrograms were classified as single, short, long double (LDP), and fractionated potentials (FPs), and the fractionation duration of non-single potentials was measured. The proportion of low-voltage areas (LVAs, <1 mV) was calculated. Increased CI was associated with decreased potential voltages and increased LVAs, LDPs, and FPs. The Electrical Fingerprint Score consisting of RA EGM features, including LVAs and LDPs, was most accurate in predicting CI severity. The RA Electrical Fingerprint Score demonstrated the highest correlation with the amount of CI in both atria (r = 0.70, P < 0.001).

Conclusion: The Electrical Fingerprint Score is a novel tool to quantify the severity of CI using only unipolar EGM characteristics recorded. This tool can be used to stage the degree of conduction abnormalities without constructing spatial activation patterns, potentially enabling early identification of patients at high risk of post-operative AF or selection of the appropriate ablation approach in addition to pulmonary vein isolation at the electrophysiology laboratory.

Keywords: Atrial fibrillation; Conduction inhomogeneity; Diagnostic tool; Epicardial mapping; Sinus rhythm.


Conflict of interest statement

Conflict of interest: None declared.

Figures

Graphical Abstract
Graphical Abstract
Figure 1
Figure 1
Left upper panel: a 192-unipolar electrode array (left panel) is used for atrial mapping; middle top panel: projection of the electrode array on a schematic posterior view of the entire atria; right panel: a colour-coded activation time map demonstrating both areas of uniform fast conduction and CB. From both areas, unipolar potentials are shown outside the activation time map. Left bottom panel: examples of different potentials. Middle bottom panel: example of a line of CB. Differences in local activation time between two adjacent electrodes ≥12 ms were defined as CB. Isochronal lines (thin black lines) are drawn at 10 ms intervals, and the black arrow indicates the direction of wavefront propagation. BB, Bachmann’s bundle; FP, fractionated potential; ICV, inferior caval vein; LA, left atrium; LAT, local activation time; LDP, long double potential; PV, pulmonary vein; PVL, pulmonary vein left; PVR, pulmonary vein right; RA, right atrium; SDP, short double potential; SP, single potential; SCV, superior caval vein.
Figure 2
Figure 2
Graph depicting the percentage of CB for each patient individually. The green dots represent patients with SR, whereas the yellow, orange, and red dots represent patients with paroxysmal, persistent, and longstanding persistent AF, respectively. The numbers of 1.6 and 2.5 on the ranking plot correspond to 33 and 66% of CB, respectively. CI, conduction inhomogeneity; LSPAF, long stand persistent atrial fibrillation; PAF, paroxysmal atrial fibrillation; PersAF, persistent atrial fibrillation; SR, sinus rhythm.
Figure 3
Figure 3
Graph illustrating representative examples of unipolar voltage maps obtained from two patients from each of the three groups. Left panel: maps obtained from two patients of the low CI group, and the total amount of CB was 0.79 and 0.73%, respectively. Middle panel: maps obtained from two patients of the intermediate CI group (the amount of CB was 2.35 and 2.29%, respectively); right panel: maps obtained from two patients of the high CI group (CB was 3.44 and 4.39%, respectively). In general, unipolar voltages decrease when CB increases. CB, conduction block; CI, conduction inhomogeneity; LVA, low-voltage area; m-mV, median unipolar potential voltage.
Figure 4
Figure 4
Boxplots comparing the differences in median potential voltage and LVA among the three groups in each atrial region. *P < 0.05; **P < 0.01; ***P < 0.001. BB, Bachmann’s bundle; CI, conduction inhomogeneity; LA, left atrium; PVA, pulmonary vein area; RA, right atrium.
Figure 5
Figure 5
Boxplots evaluating the differences in different atrial morphologies among the three groups in each atrial region. *P < 0.05; **P < 0.01; ***P < 0.001. BB, Bachmann’s bundle; CI, conduction inhomogeneity; LA, left atrium; PVA, pulmonary vein area; RA, right atrium.
Figure 6
Figure 6
ROC curves calculated by using the EGM features recorded from the whole atrium and regional atrium in the diagnosis of a high degree of CI. AUC, area under the curve; BB, Bachmann’s bundle; FD, fractionation duration; FPs, fractionated potentials; LA, left atrium; LDPs, long double potentials; LVA, low-voltage area; m-mV, median unipolar potential voltage; PVA, pulmonary vein area; RA, right atrium.
Figure 7
Figure 7
Nomogram for quantifying the severity of CI in the entire atria. The influence of each parameter on the nomogram predicting the risk of high CI is exhibited on the horizontal axes of variable lengths. The usage of this nomogram is described below: chose a specific value of one parameter and draw a vertical line up to ‘Points’ to determine the score of this parameter earned. The sum of those scores corresponding to the ‘Total Points’ axis on the bottom and another vertical line is drawn up to the axis of ‘Risk of high conduction inhomogeneity’ to determine the risk of high CI. CI, conduction inhomogeneity; FD, fractionation duration; LDP, long double potential; LVA, low-voltage area.
Figure 8
Figure 8
Correlation of the Global Electrical Fingerprint Score and Regional Electrical Signal Fingerprint Score and CB in the individual patient. BB, Bachmann’s bundle; CI, conduction inhomogeneity; LA, left atrium; PVA, pulmonary vein area; RA, right atrium.

References

    1. Allessie MA, de Groot NMS, Houben RPM, Schotten U, Boersma E, Smeets JLet al. . Electropathological substrate of long-standing persistent atrial fibrillation in patients with structural heart disease: longitudinal dissociation. Circ Arrhythm Electrophysiol 2010;3:606–15. - PubMed
    1. Williams SE, Linton NWF, Harrison J, Chubb H, Whitaker J, Gill Jet al. . Intra-atrial conduction delay revealed by multisite incremental atrial pacing is an independent marker of remodeling in human atrial fibrillation. JACC Clin Electrophysiol 2017;3:1006–17. - PMC - PubMed
    1. Pytkowski M, Jankowska A, Maciag A, Kowalik I, Sterlinski M, Szwed Het al. . Paroxysmal atrial fibrillation is associated with increased intra-atrial conduction delay. Europace 2008;10:1415–20. - PubMed
    1. de Groot NM, Schalij MJ, Zeppenfeld K, Blom NA, Van der Velde ET, Van der Wall EE. Voltage and activation mapping: how the recording technique affects the outcome of catheter ablation procedures in patients with congenital heart disease. Circulation 2003;108:2099–106. - PubMed
    1. Miyamoto K, Tsuchiya T, Narita S, Yamaguchi T, Nagamoto Y, Ando Set al. . Bipolar electrogram amplitudes in the left atrium are related to local conduction velocity in patients with atrial fibrillation. Europace 2009;11:1597–605. - PubMed