. 2024 Feb 8;14(2):308-325.
doi: 10.1158/2159-8290.CD-23-0289.

Alveolar Differentiation Drives Resistance to KRAS Inhibition in Lung Adenocarcinoma

Affiliations

Alveolar Differentiation Drives Resistance to KRAS Inhibition in Lung Adenocarcinoma

Zhuxuan Li et al. Cancer Discov. .

Abstract

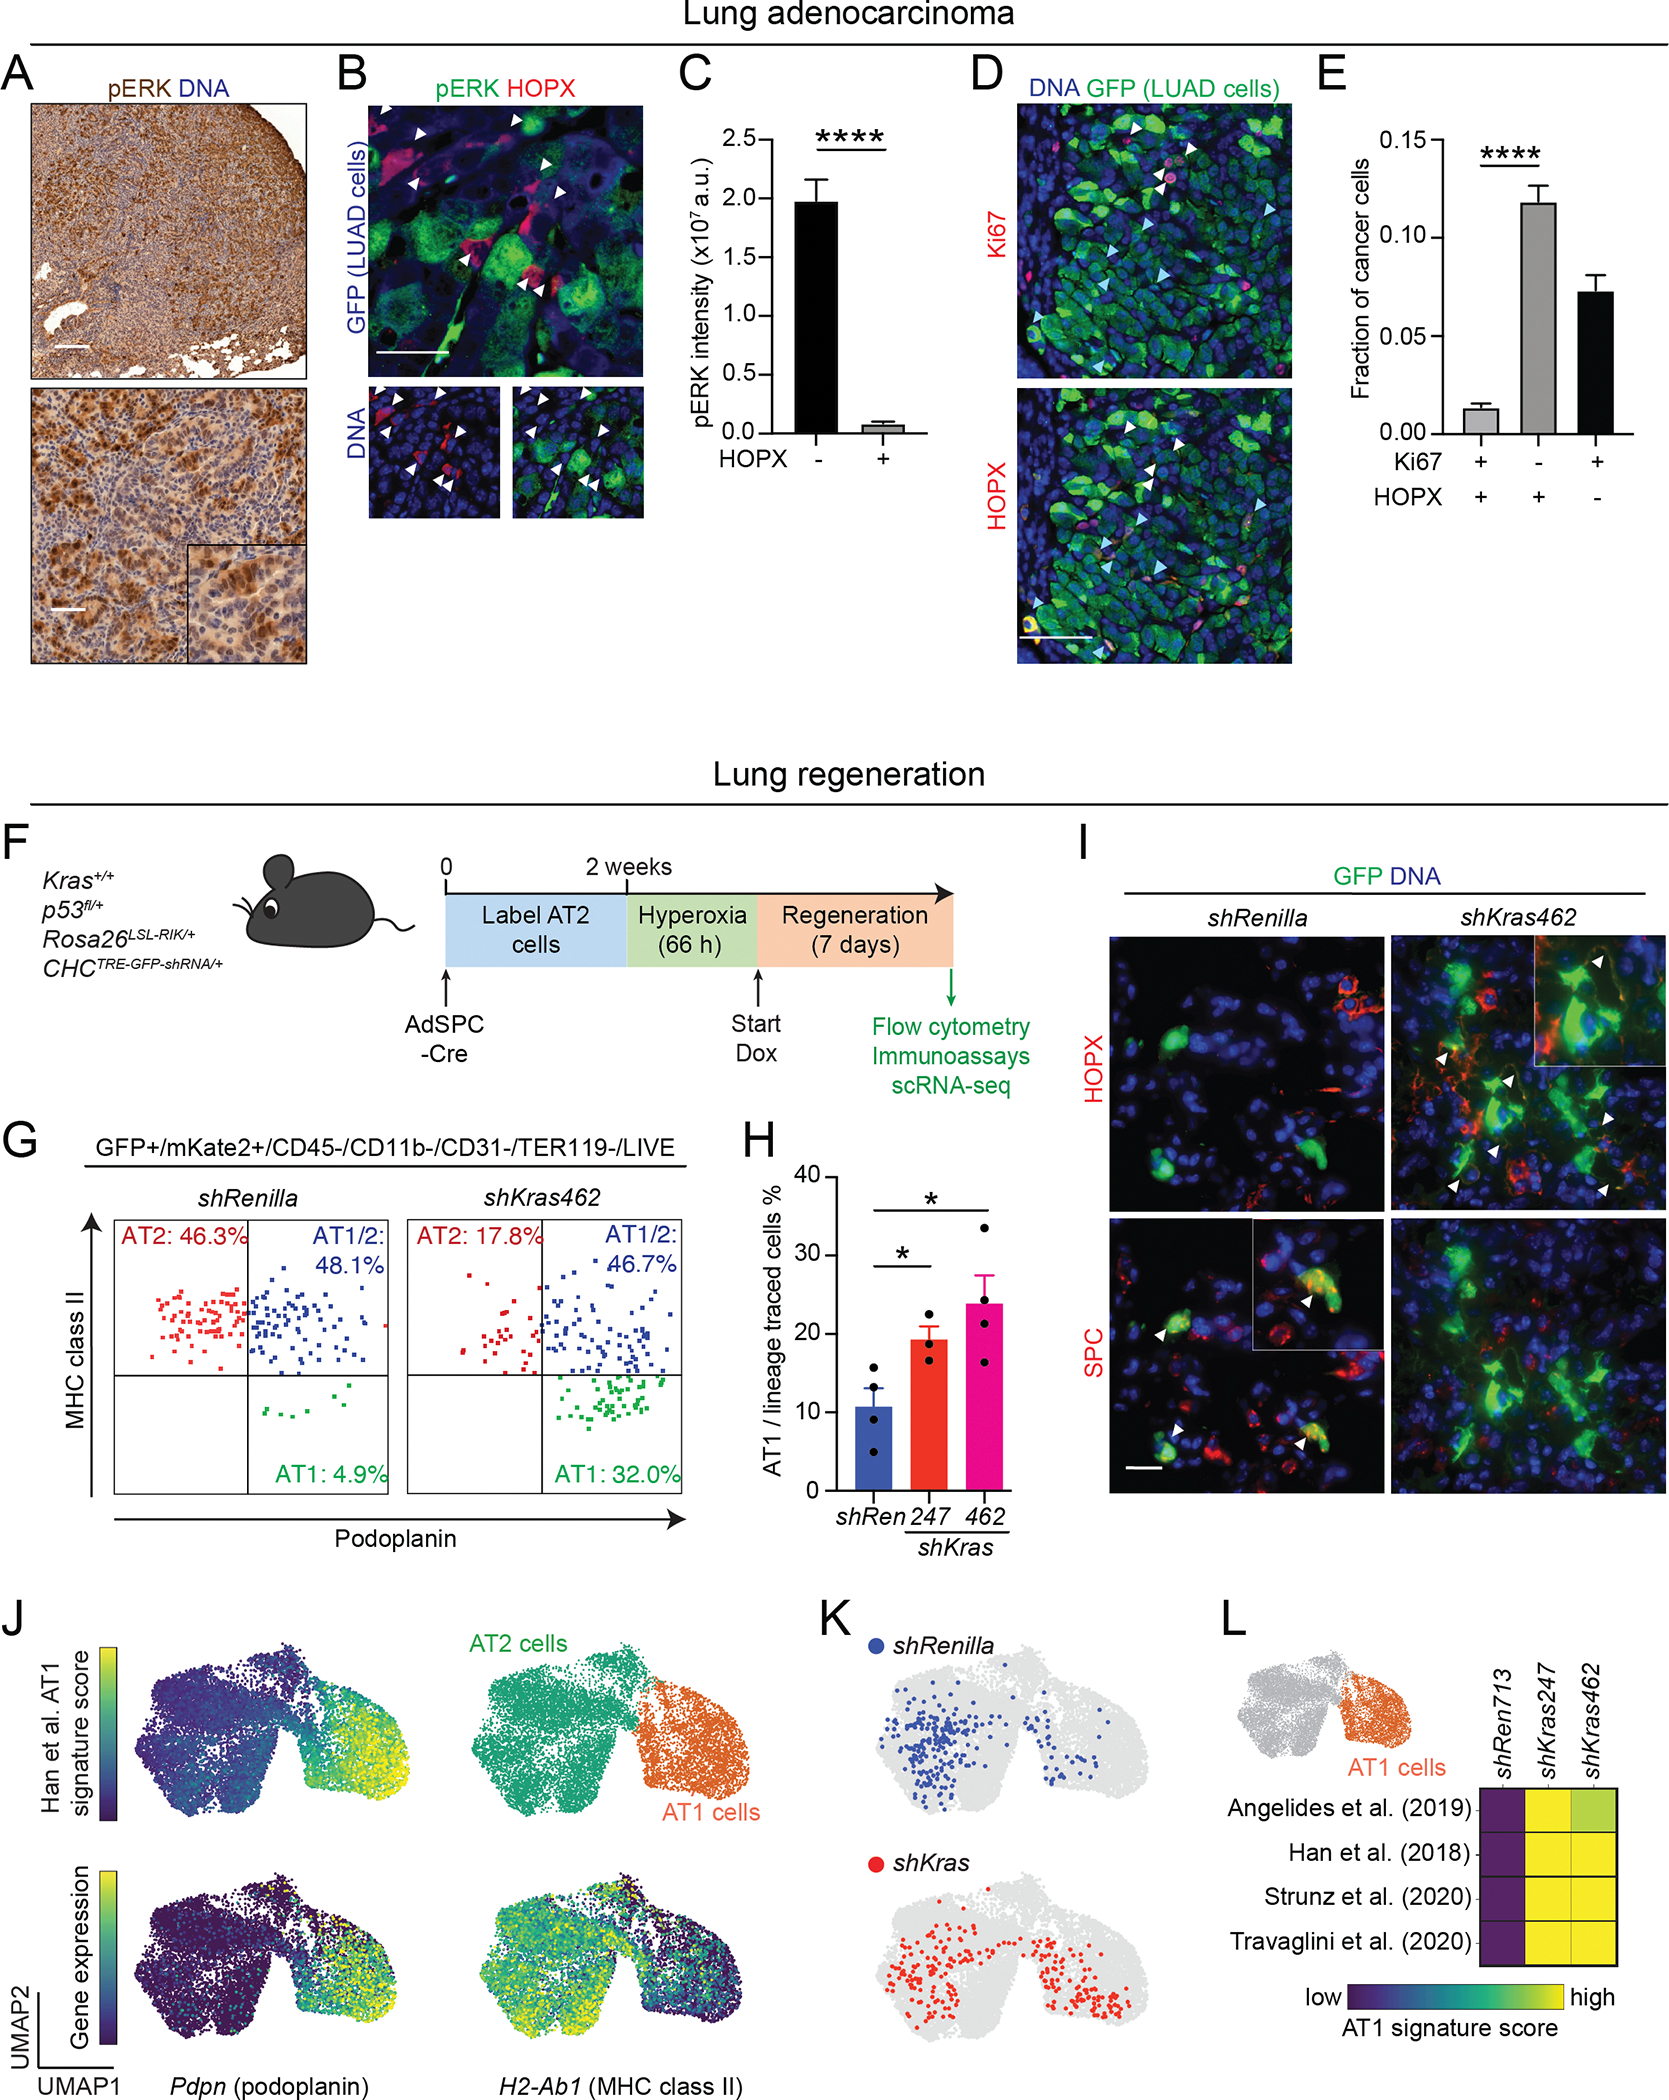
Lung adenocarcinoma (LUAD), commonly driven by KRAS mutations, is responsible for 7% of all cancer mortality. The first allele-specific KRAS inhibitors were recently approved in LUAD, but the clinical benefit is limited by intrinsic and acquired resistance. LUAD predominantly arises from alveolar type 2 (AT2) cells, which function as facultative alveolar stem cells by self-renewing and replacing alveolar type 1 (AT1) cells. Using genetically engineered mouse models, patient-derived xenografts, and patient samples, we found inhibition of KRAS promotes transition to a quiescent AT1-like cancer cell state in LUAD tumors. Similarly, suppressing Kras induced AT1 differentiation of wild-type AT2 cells upon lung injury. The AT1-like LUAD cells exhibited high growth and differentiation potential upon treatment cessation, whereas ablation of the AT1-like cells robustly improved treatment response to KRAS inhibitors. Our results uncover an unexpected role for KRAS in promoting intratumoral heterogeneity and suggest that targeting alveolar differentiation may augment KRAS-targeted therapies in LUAD.

Significance: Treatment resistance limits response to KRAS inhibitors in LUAD patients. We find LUAD residual disease following KRAS targeting is composed of AT1-like cancer cells with the capacity to reignite tumorigenesis. Targeting the AT1-like cells augments responses to KRAS inhibition, elucidating a therapeutic strategy to overcome resistance to KRAS-targeted therapy. This article is featured in Selected Articles from This Issue, p. 201.


Figures

Figure 1.
Figure 1.. Targeting Kras promotes an AT1-like differentiation program in LUAD cells.
(A) Genetically engineered KP; RIK; TET-GFPshRNA mouse model enabling doxycycline (Dox)-inducible shRNA expression in KP LUAD cells. (B) Experimental design for targeting Kras using the KP; RIK; TET-GFPshRNA system. Inset: Flow cytometry plot showing induction of GFPshRNA upon Dox administration in the KP tumors in vivo. Cell gating: CD45/CD31/CD11b/F480/TER119/DAPI (live). (C) GFP expression in mKate+/CD45/CD31/CD11b/F480/TER119/DAPI (live) cells in shRenilla and shKras groups at different time points. (D) Proportion of GFP+/mKate+ cells in the total mKate+ LUAD cell pool in shRenilla and shKras groups at indicated time points; n = 3 replicates per model for each time point. (E) Relative KRAS(G12D) protein expression in isolated primary GFP+/mKate+ KP; RIK; TET-GFPshRNA LUAD cells after 20 days on Dox; n = 3 mice/group. (F) Fraction of proliferating (Ki67+) GFP+/mKate+ LUAD cells after 5 days on Dox; n ≥ 13 mice/group. (G) Unsupervised clustering of GFP+/mKate+ single LUAD cell transcriptomes, colored and annotated based on Marjanovic et al. (9). Normal healthy AT2 and AT1 single-cell transcriptomes (gray) isolated from wild-type mice are co-embedded. (H) Projection of wild-type mouse AT1 cell gene expression signature (47) onto the UMAP space shown in (G). (I) Location of KP; RIK; TET-GFPshRNA LUAD cell transcriptomes in the UMAP space following expression of shRenilla control or shKras247/shKras462 at the indicated time points; n = 3–4 mice/group (750 randomly sampled cells per condition). (J) Fold change (log2) in the proportion of the distinct cancer cell subsets shown in (G) following expression of shKras at the indicated time points. Open circle: p < 0.05; closed circle: p < 0.01 (t test vs. shRenilla with individual tumors as biological replicates). (K) Signature score of four independent AT1 cell signatures in the AT1-like LUAD cell state (orange) in each model. The average score of the single-cell transcriptomes in each group is shown. Note increasing expression of AT1 cell genes over time. Open circle: p < 0.05; closed circle: p < 0.01 (t test vs. shRenilla with individual tumors as biological replicates). (L) Left: projection of Hopx expression level onto the UMAP in (G). Right: representative images of HOPX immunofluorescence (red) in the LUAD cells expressing the indicated shRNAs (green). Arrowheads indicate HOPX+/GFP+ cells. Scale bar: 100 μm. (M) Quantification of the fraction of HOPX+/GFP+ cells within the total GFP+ cell pool; n ≥ 36 tumors/experimental group. Two-way ANOVA was used in (D), (E), (F), and (M) to test for statistical significance: **** p < 0.0001; ** p < 0.01; * p < 0.05. Error bars indicate SEM.
Figure 2.
Figure 2.. KRAS suppresses AT1 differentiation in LUAD and in the regenerating lung.
(A) Immunohistochemical staining for pERK (brown) in an autochthonous KP LUAD tumor at 16 weeks post-initiation. Scale bars: 200 μm (top) and 100 μm (bottom). (B) Representative images showing pERK (green) and HOPX (red) immunofluorescence in a KP; RIK; TET-GFPshRenilla LUAD tumor at 16 weeks post-tumor initiation + 5 days on Dox. GFP (blue in top image) marks LUAD cells expressing the shRenilla control shRNA. Note absence of pERK immunoreactivity in the HOPX+/GFP+ cells (arrowheads). Scale bar: 50 μm. (C) Quantification of pERK staining intensity in HOPX+/GFP+ vs. HOPX/GFP+ LUAD cells in KP; RIK; TET-GFPshRenilla tumors at 16 weeks post-tumor initiation + 5 days on Dox; n = 168 tumors. An unpaired t test was used to test significance. (D) Representative images showing Ki67+ (red in top image) and HOPX+ (red in bottom image) in GFP+ LUAD cells in KP; RIK; TET-GFPshRenilla LUAD tumors at 16 weeks post-tumor initiation + 5 days on Dox. Note mutual exclusivity of HOPX (turquoise arrowheads) and Ki67 (white arrowheads) staining. Scale bar: 50 μm. (E) Quantification of the fraction of Ki67+/HOPX+/GFP+, Ki67HOPX/GFP+, and Ki67+/HOPX+/GFP+ LUAD cells in KP; RIK; TET-GFPshRenilla LUAD tumors at 16 weeks post-tumor initiation + 5 days on Dox; n = 59 tumors. (F) Outline of experiment combining AT2 cell lineage-tracing and perturbation of wild-type Kras using the RIK; TET-GFPshRNA system. (G) Representative flow cytometry plots depicting expression of the AT2 marker MHC class II (y-axis) and AT1 marker podoplanin (x-axis) in RIK; TET-GFPshRenilla vs. RIK; TET-GFPshKras462 mice following lineage-tracing, hyperoxia injury, and 7-day exposure to Dox. (H) Quantification of proportion of AT1 cells within total pool of lineage-traced AT2 cells; n = 3–4 mice/group. (I) Immunofluorescence for HOPX (red, top row) and SPC (red, bottom row). White arrowheads indicate HOPX+ AT1 cells in the top row, SPC+ AT2 cells in the bottom row. Scale bar: 20 μm. (J) Single-cell transcriptomes of lineage-traced (GFP+/mKate2+) RIK; TET-GFPshRenilla vs. RIK; TET-GFPshKras462 cells following hyperoxia injury, and 7-day exposure to Dox, co-embedded with primary AT2 and AT1 cell transcriptomes isolated from wild-type uninjured lungs. Heatmaps indicate AT1 gene expression score or H2-ab1 (MHC class II) or Pdpn (podoplanin) gene expression; unsupervised clustering separates AT2 (green) and AT1 (orange) cells. (K) Lineage-traced cells isolated from RIK; TET-GFPshRenilla (blue) or RIK; TET-GFPshKras462 (red) mice are projected into UMAP space (250 random samples cells per condition). (L) Heatmap showing four previously published healthy AT1 cell signatures in the AT1 space (orange) in the indicated RIK; TET-GFPshRNA models. The average score over all single-cell transcriptomes per group; n = 2–4 models/group is shown. Two-way ANOVA was used in (E), and (H) to test for statistical significance: **** p < 0.0001; * p < 0.05. Error bars indicate SEM.
Figure 3.
Figure 3.. Pharmacologic allele-specific inhibition of KRAS promotes an AT1-like differentiation program in LUAD cells.
(A) Outline of experimental design to investigate KRAS(G12D) inhibition in autochthonous KPT LUAD tumors using the KRAS(G12D) inhibitor MRTX1133. (B) Quantification of tumor burden (tdTomato+ area/total lung cross-sectional area) at 16 weeks post-tumor initiation + 20 days on MRTX1133 or vehicle control; n ≥ 6. (C) Representative images of tdTomato immunofluorescence in KPT lung tumors after 20 days of MRTX1133 or vehicle administration. Scale bar: 1 mm. (D) Quantification of apoptotic [cleaved caspase 3 (CC3)+/tdTomato+] cancer cells at 16 weeks post-tumor initiation + 5 days on MRTX1133 or vehicle control (n ≥ 17). (E) Left: Representative images of Ki67 and tdTomato immunofluorescence magnified from the boxed region in (C). Scale bar: 50 μm. Right: Quantification of proliferating (Ki67+/tdTomato+) cancer cells in LUAD tumors at 16 weeks post-tumor initiation + 20 days on MRTX1133 or vehicle control (n ≥ 37). (F) Left: Representative images of HOPX and tdTomato immunofluorescence in the boxed region in (C). Scale bar: 50 μm. Right: Quantification of AT1-like (HOPX+/tdTomato+) cancer cells in LUAD tumors at 16 weeks post-tumor initiation + 20 days on MRTX1133 or vehicle control (n ≥ 37). (G) Unsupervised clustering of tdTomato+/CD45/CD31/CD11b/F480/TER119/DAPI single LUAD cell transcriptomes, colored and annotated based on Marjanovic et al. (9). (H) Location of the LUAD cell transcriptomes in the UMAP space following exposure to vehicle control (blue) or MRTX1133 (red) at the indicated time points (n = 3–4 mice/group). (I) Fold change in the proportion of the distinct cancer cell subsets shown in (C) following MRTX1133 therapy or vehicle control at the indicated time points. Open circle: p < 0.05; closed circle: p < 0.01 (t test vs. vehicle with individual tumors as biological replicates). (J) Signature score of four independent healthy AT1 cell signatures in the AT1-like LUAD cell state (orange) following MRTX1133 therapy or vehicle control. The average score over all single-cell transcriptomes per group is shown. Note increasing expression of AT1 cell genes over time. Open circle: p < 0.05; closed circle: p < 0.01 (t test vs. vehicle with individual tumors as biological replicates). (K) Outline of experimental design to investigate KRAS(G12C) inhibition in autochthonous KRAS(G12C)PT LUAD tumors. (L) Left: Representative images of tdTomato immunofluorescence in KRAS(G12C)PT lung tumors at 16 weeks post-tumor initiation + 20 days on sotorasib or vehicle. Scale bar: 1 mm. Right: Quantification of tumor burden (tdTomato+ area/total lung cross-sectional area) following 20 days of sotorasib therapy or vehicle control; n = 3. (M) Left: Representative images of HOPX and tdTomato immunofluorescence in the boxed region in (L). Scale bar: 50 μm. Right: Quantification of AT1-like (HOPX+/tdTomato+) cancer cells in LUAD tumors at 16 weeks post-tumor initiation + 20 days on sotorasib or vehicle control (n ≥ 18 tumors/group). Unpaired t test was used in (B), (D), (E), (F), (L) and (M) to test for statistical significance: **** p < 0.0001; *** p < 0.001; ** p < 0.01;* p < 0.05. Error bars indicate SEM.
Figure 4.
Figure 4.. Enrichment of an AT1-like cancer cell state in response to KRAS inhibitors in LUAD.
(A) Genetically engineered Hopx-MACD reporter system enabling lineage tracing and ablation of AT1-like KP LUAD cells. Frt-Stop-Frt-mScarlet-Akaluc-CreERT2-DTR reporter construct knocked in frame into the stop codon of Hopx exon 3. T2A and P2A: short polypeptide cleavage sites. PGK-Gluc-miRFP-EFS-lox-BFP-lox lentiviral lineage tracing vector was integrated into the Hopx-MACD reporter cells, enabling lineage-tracing of Hopx+ cells with a single pulse of tamoxifen (TAM). (B) Outline of experimental design to investigate Hopx expression during and following withdrawal of KRAS(G12D) inhibition in subcutaneous KRAS(G12D);P;Hopx-MACD LUAD tumors using bioluminescence imaging (BLI) at the indicated time points. (C) Tumor burden measured by Gaussia princeps (G-Luc) luminescence in response to MRTX1133 therapy (n ≥ 7 mice/group). (D) Hopx::AkaLuc bioluminescence detection in mice bearing KP; Hopx-MACD reporter allografts subjected to vehicle (top) or MRTX1133 (bottom) before (day 0), ON (10 days on), and OFF (7 days off) treatment. (E) Quantification of Hopx::AkaLuc bioluminescence normalized to tumor burden (G-Luc bioluminescence) (n ≥ 14 tumors/group). (F) Left: Representative images of KP; Hopx-MACD reporter cells in 2D culture at 4 h and 10 h following exposure to MRTX1133. Note induction of Hopx expression as indicated by mScarlet fluorescence (white arrowheads). Scale bar: 200 μm. Right: Quantification of number of cells switching to the AT1-like state (mScarlet+) per high-power field (HPF) (n = 6/group). (G) Experimental design for lineage-tracing the AT-like state before KRAS(G12D) inhibition in subcutaneous KP; Hopx-MACD reporter allografts. (H) Representative images of BFP and mScarlet immunofluorescence in the KP; Hopx-MACD reporter allografts before and on MRTX1133 or vehicle exposure. Scale bars: top 50 μm, bottom 25 μm. Note efficient labeling of mScarlet+ cells (BFP+/mScarlet+, white arrowheads) at 3 days following TAM administration and an increase of non-traced cells (BFP/mScarlet+; yellow arrowheads) during MRTX1133 treatment. (I) Quantification of non-traced Hopx+ (BFP/mScarlet+) cancer cells in Hopx+ (mScarlet+) tumors in (H) (n ≥ 3 tumors/group). (J) Schematic summary of findings: KRAS inhibition induces AT1 differentiation in non-AT1 LUAD cell states. Unpaired t test was used in (F) and (I) to test for statistical significance: *** p < 0.001; * p < 0.05. Error bars indicate SEM.
Figure 5.
Figure 5.. AT1-like LUAD cells drive resistance to and relapse following KRAS inhibition.
(A) Histogram showing podoplanin expression in tdTomato+/CD45/CD31/CD11b/F480/TER119/DAPI (live) LUAD cells isolated from autochthonous tumors at 16 weeks post-tumor initiation plus 20 days on MRTX1133 (red) or vehicle control (blue). MFI: median fluorescence intensity. Dashed line separates podoplanin (–) and podoplanin+ (+) cells. (B) Representative images of 3D tumor spheres established from podoplanin+ [+ in (A)] and podoplanin [- in (A)] LUAD cells isolated from autochthonous tumors at 16 weeks post-tumor initiation plus 20 days on MRTX1133 or vehicle control. Spheres were cultured for 10 days in the absence of drug. Scale bar: 500 μm. (C) Quantification of the number of tumor spheres in the experiment outlined in (G-H); n = 8, 12, 3, and 5 mice from left to right. (D) Left: Histogram showing podoplanin expression in tdTomato+/CD45/CD31/CD11b/F480/TER119/DAPI (live) LUAD cells isolated from autochthonous tumors at 16 weeks post-tumor initiation plus 20 days on vehicle (blue) or MRTX1133 (red), or 20 days on MRTX1133 plus 10 days of MRTX1133 washout (purple). Right: Quantification of the percentage of podoplanin+ cells in the aforementioned conditions (n ≥ 6). One-way ANOVA was used to examine statistical significance. (E) Outline of experimental design to lineage-trace Hopx+ AT1-like LUAD cells on and after MRTX1133 therapy vs. vehicle control in subcutaneous KP; Hopx-MACD reporter allografts. (F) Representative images of BFP and mScarlet immunofluorescence in KP; Hopx-MACD reporter allografts at 13 days on MRTX1133 therapy (left) and 7 days after relapse (right). Note efficient labeling of Hopx::mScarlet+ cells (BFP+/mScarlet+; white arrowheads) after TAM administration and increase in lineage-traced cells that are not in the AT1-like state (BFP+/mScarlet; turquoise arrowheads) after withdrawal of MRTX1133. Scale bars at top: 50 μm; scale bar at bottom: 25 μm. (G) Quantification of lineage-traced cells not in AT1-like state (BFP+/mScarlet) (n ≥ 3 tumors/group). An unpaired t test was used to examine significance. (H) Unsupervised clustering of miRFP+/CD45/CD31/CD11b/F480/TER119/DAPI single LUAD cell transcriptomes, colored and annotated based on unsupervised Leiden clustering. (I) Projection of mouse AT1 cell gene expression signature (47) onto the UMAP space. (J) LUAD cell transcriptomes in the UMAP space following exposure to vehicle control (blue) or AT1 lineage-traced cells after 13 days of MRTX1133 exposure followed by 7 days of drug washout (red). Purple arrow indicates transdifferentiation of the AT1-like cells from the AT1-like state (orange dashed line) into other LUAD cell states. (K) Fraction of vehicle vs. AT1-lineage-traced cells transiently exposed to MRTX1133 in the Leiden clusters (H) (n = 3 mice/group). (L) Schematic summary of key findings: Loss of AT1-like identity during KRAS reactivation and tumor relapse. (M) Outline of experimental design to test ablation of Hopx+ AT1-like LUAD cells in the context of MRTX1133 therapy or vehicle control in a subcutaneous KP; Hopx-MACD reporter allografts. (N) Quantification of the percentage of mScarlet+ cells within the miRFP+/CD45/CD31/CD11b/F480/TER119/DAPI (live) total LUAD cell pool at 20 days following MRTX1133 therapy or vehicle with or without DT (n ≥ 6). (O) Volume of subcutaneous KP; Hopx-MACD reporter allografts subjected to the indicated therapies; n ≥ 4/group. Asterisks indicate statistical significance (unpaired t test p-value) between MRTX1133 vs. MRTX1133 + DT groups. Two-way ANOVA was used in (C) and (N) to test for statistical significance: **** p < 0.0001; *** p < 0.001; ** p < 0.01; * p < 0.05. Error bars indicate SEM.
Figure 6.
Figure 6.. KRAS inhibitors enrich for AT1-like cancer cells in human LUAD.
(A) Experiment to investigate KRAS(G12C) inhibition in a human LUAD PDX model using sotorasib. (B) Tumor volume fold change in response to sotorasib therapy (n ≥ 3 mice/group). Statistical significance was examined using an unpaired t test. (C) HOPX immunofluorescence in PDX models subjected to 10 days of sotorasib therapy. White arrowheads indicate HOPX+ cells. Scale bar: 20 μm. (D) Quantification of the fraction of HOPX+ cells in the PDX model (n = 6 tumors/experimental condition). An unpaired t test was used to test for statistical significance. (E) Signature scores of wild-type AT1 cell and AT1-like LUAD cell signatures in the PDXs following adagrasib therapy or vehicle control. “Mouse AT1-like LUAD” and “Mouse MRTX1133” signatures were defined in this study (Supplementary Table 3 and Supplementary Table 4, respectively). Closed circle: p < 0.05 (three individual PDXs were used as biological replicates, see Supplementary Fig. 6). (F) HOPX (red) and pan-cytokeratin (pan-CK, green) immunofluorescence in longitudinal tumor tissue biopsies obtained from human patients before and on sotorasib or adagrasib therapy. Scale bar at left: 50 μm; scale bar at right: 25 μm. (G) Fraction of HOPX+/ pan-CK+ area in tumor regions in matched pre-treatment and on-sotorasib (blue line) or on-adagrasib (orange line) biopsies. A paired t test was used to test for statistical significance. (H) Schematic summary of key findings. See text. * p < 0.05. Error bars indicate SEM.

Update of

References

    1. Moore AR, Rosenberg SC, McCormick F, Malek S. RAS-targeted therapies: is the undruggable drugged? Nat Rev Drug Discov 2020;19(8):533–52 doi 10.1038/s41573-020-0068-6. - DOI - PMC - PubMed
    1. Zehir A, Benayed R, Shah RH, Syed A, Middha S, Kim HR, et al. Mutational landscape of metastatic cancer revealed from prospective clinical sequencing of 10,000 patients. Nat Med 2017;23(6):703–13 doi 10.1038/nm.4333. - DOI - PMC - PubMed
    1. Kim D, Xue JY, Lito P. Targeting KRAS(G12C): From Inhibitory Mechanism to Modulation of Antitumor Effects in Patients. Cell 2020;183(4):850–9 doi 10.1016/j.cell.2020.09.044. - DOI - PMC - PubMed
    1. Skoulidis F, Li BT, Dy GK, Price TJ, Falchook GS, Wolf J, et al. Sotorasib for Lung Cancers with KRAS p.G12C Mutation. N Engl J Med 2021;384(25):2371–81 doi 10.1056/NEJMoa2103695. - DOI - PMC - PubMed
    1. Zhao Y, Murciano-Goroff YR, Xue JY, Ang A, Lucas J, Mai TT, et al. Diverse alterations associated with resistance to KRAS(G12C) inhibition. Nature 2021;599(7886):679–83 doi 10.1038/s41586-021-04065-2. - DOI - PMC - PubMed

Substances