. 2023 Nov 6;7(1):e202302335.
doi: 10.26508/lsa.202302335. Print 2024 Jan.

ESYT1 tethers the ER to mitochondria and is required for mitochondrial lipid and calcium homeostasis

Affiliations

ESYT1 tethers the ER to mitochondria and is required for mitochondrial lipid and calcium homeostasis

Alexandre Janer et al. Life Sci Alliance. .

Abstract

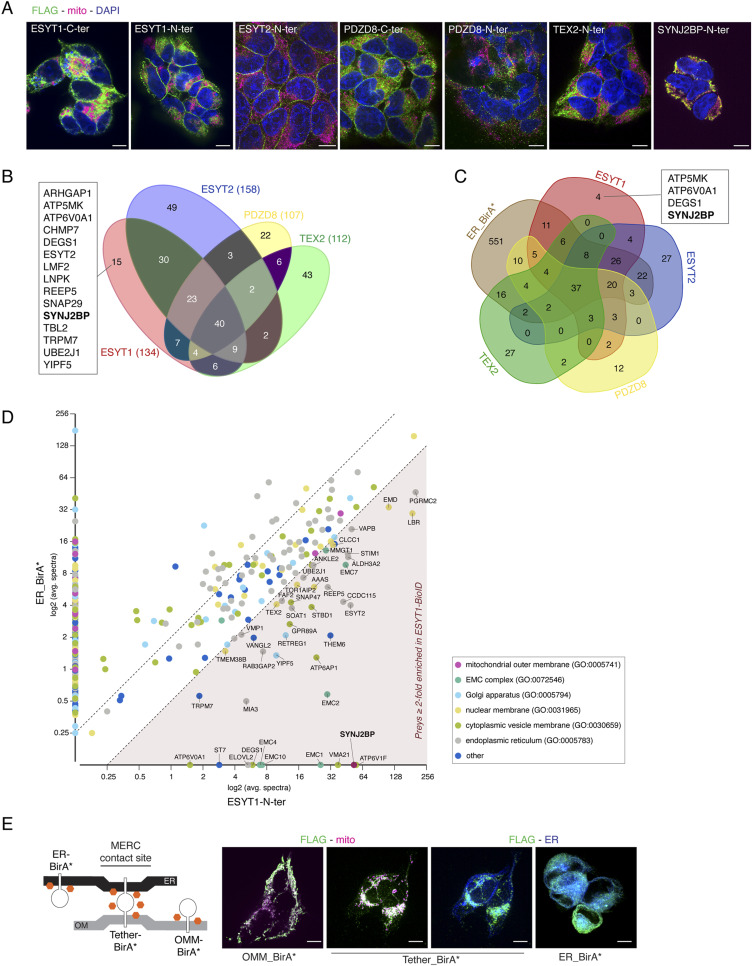
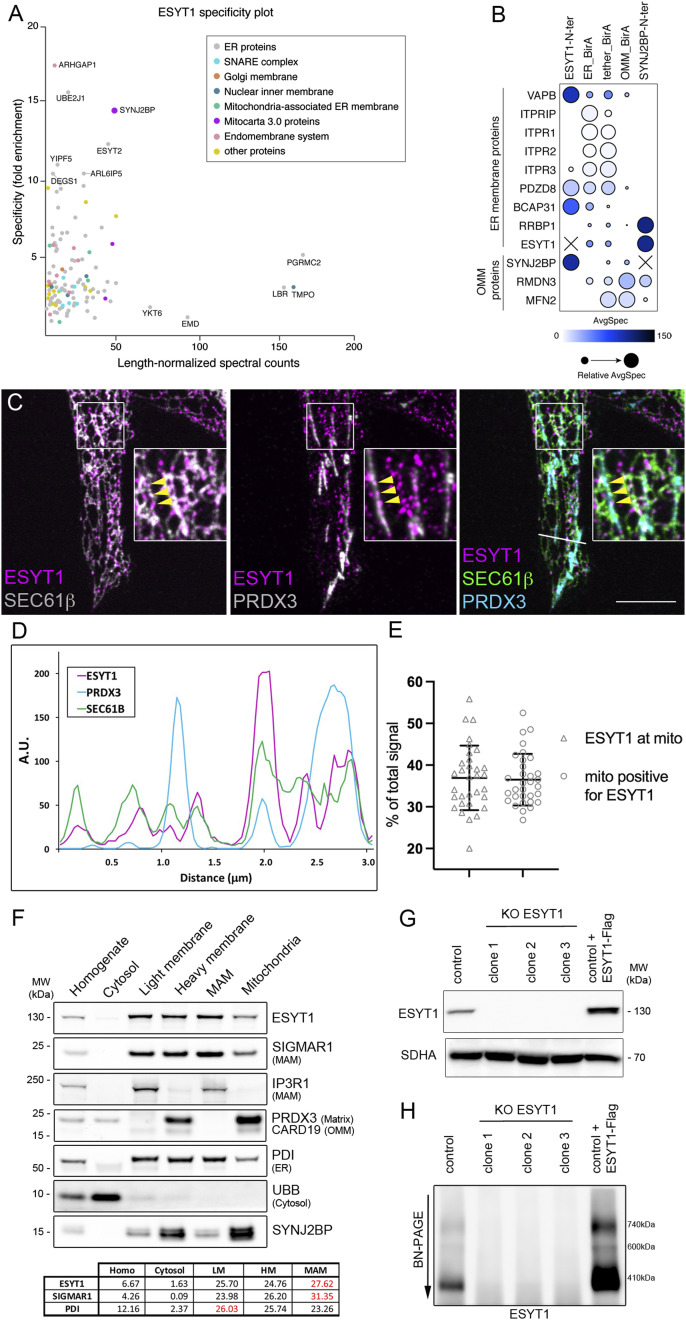
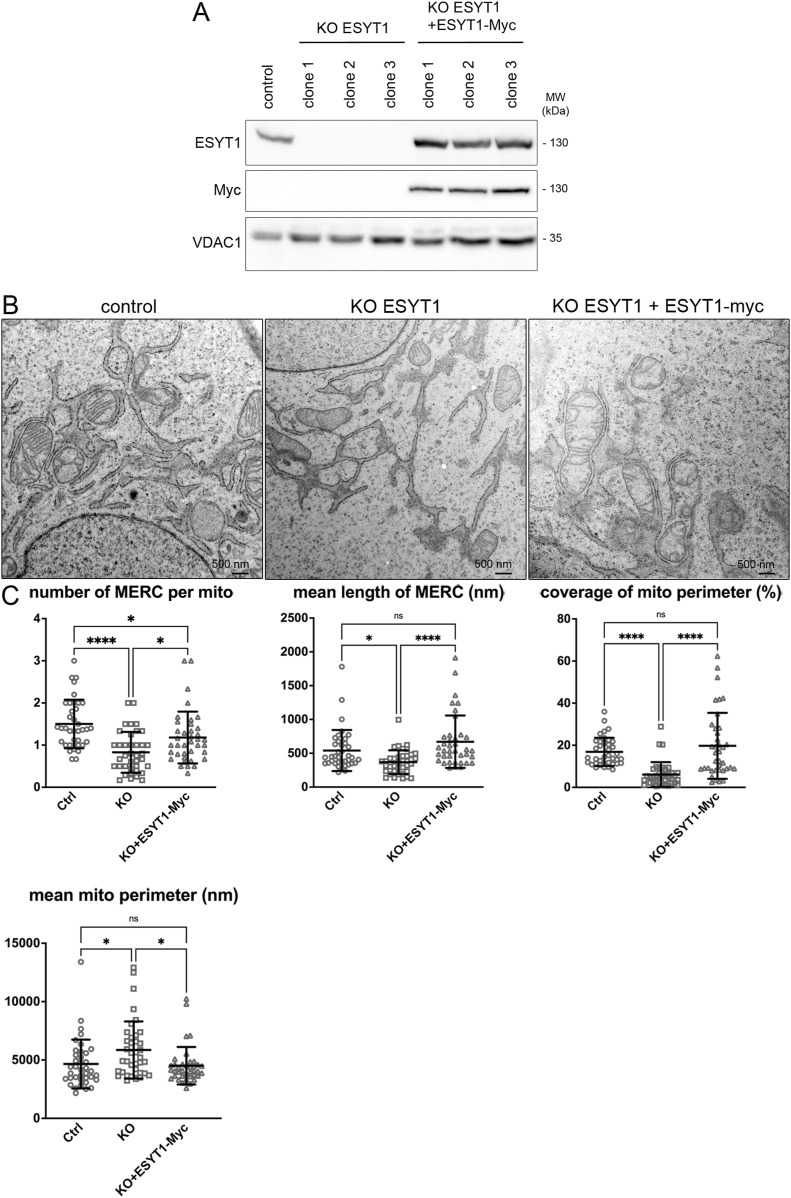
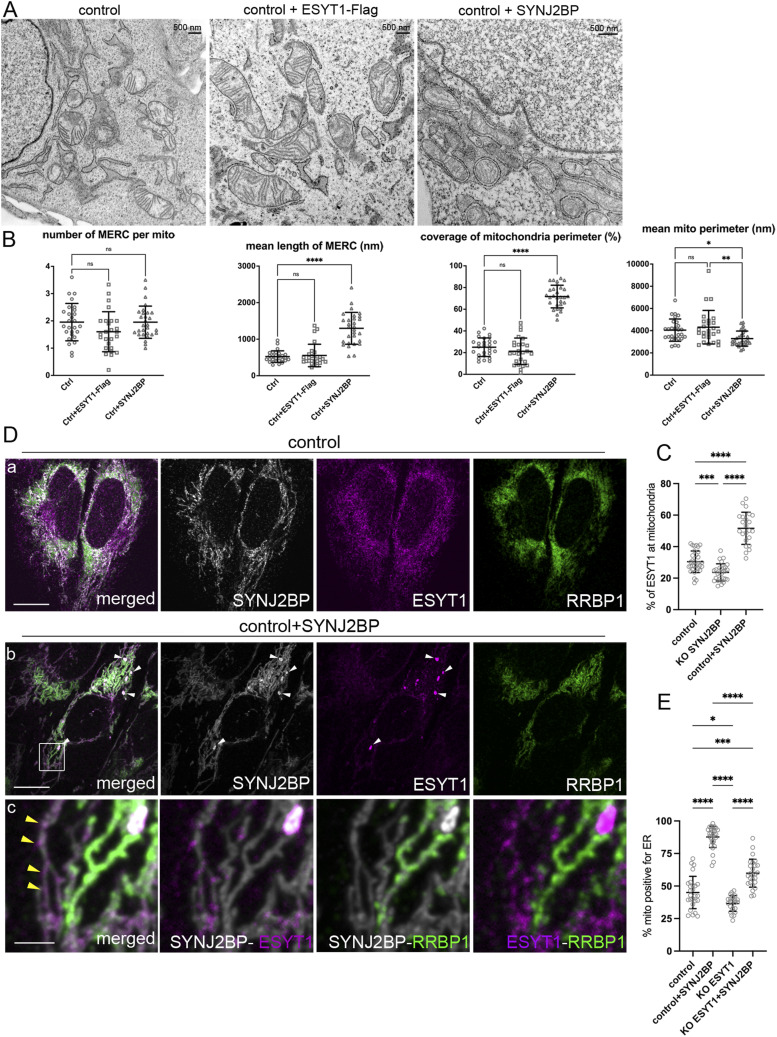
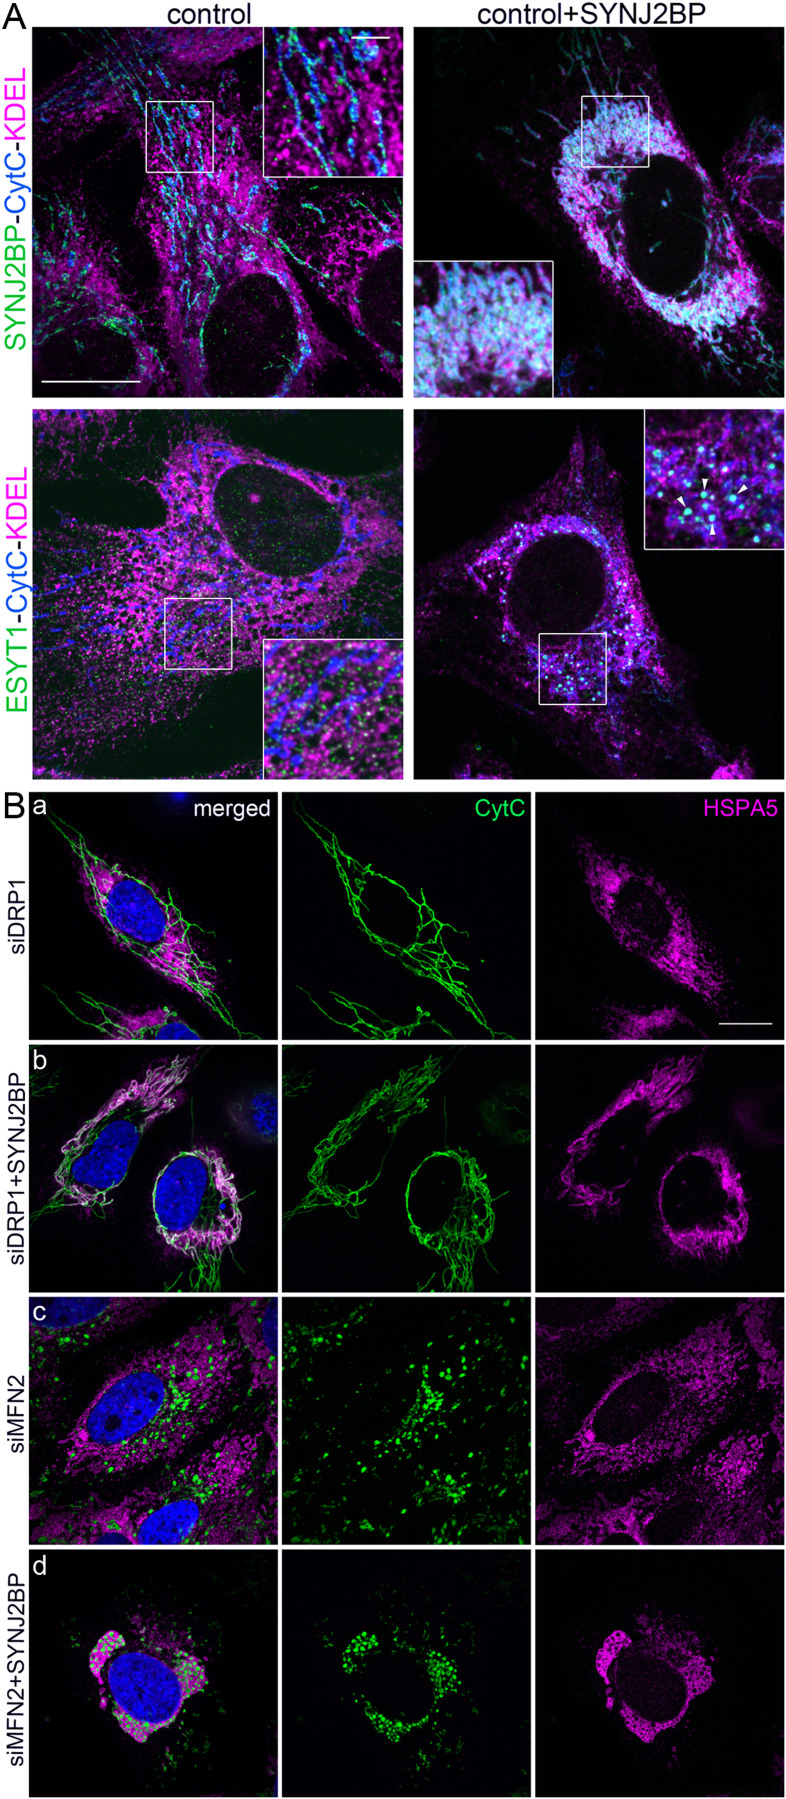
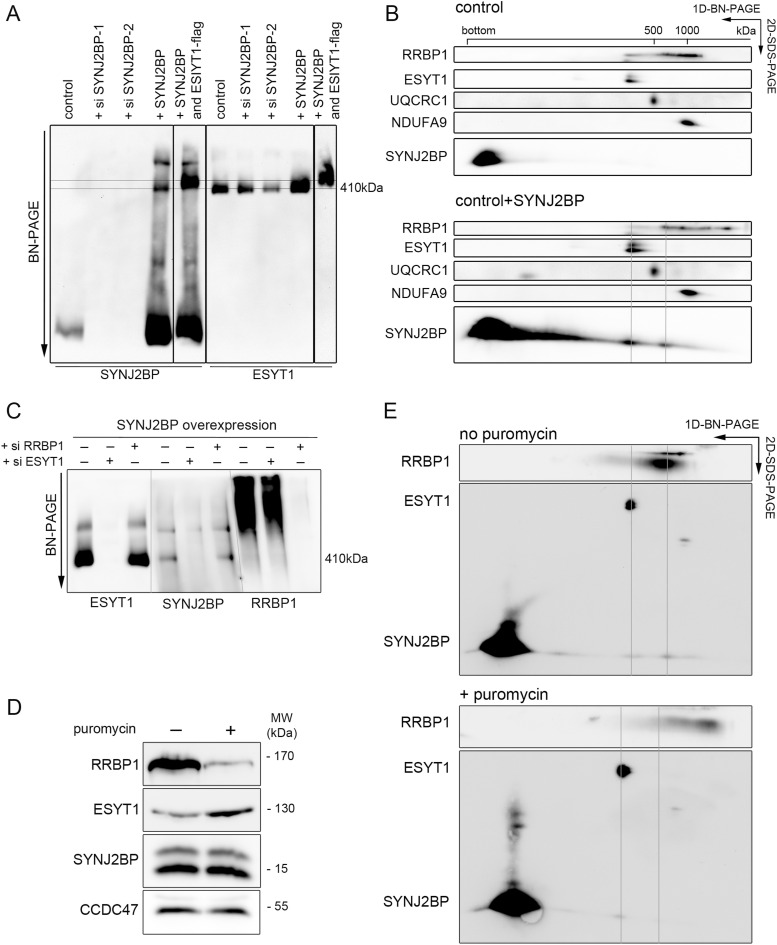
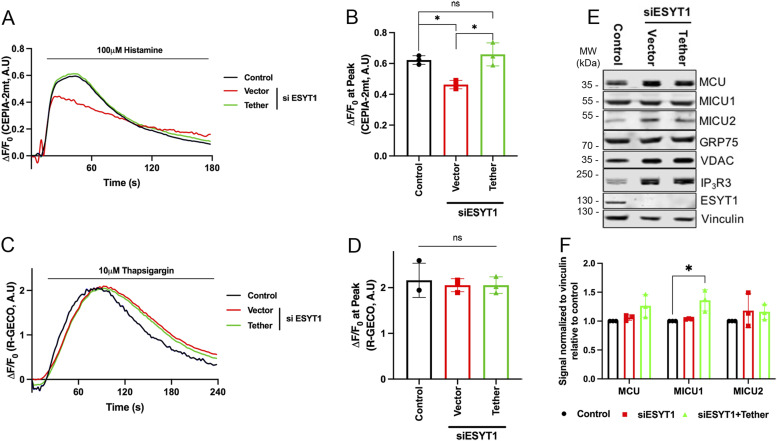
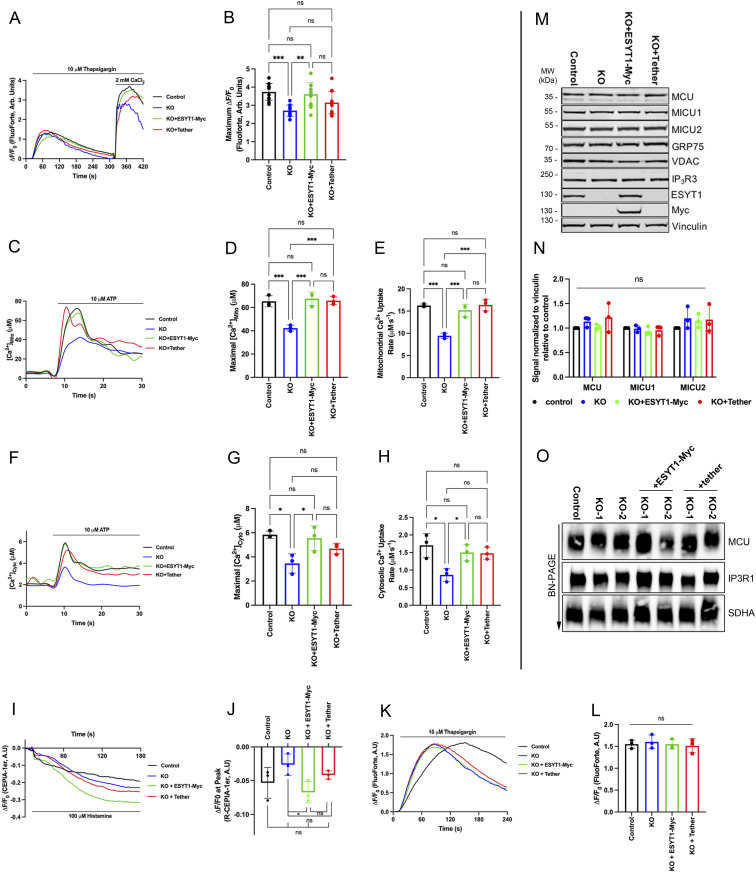
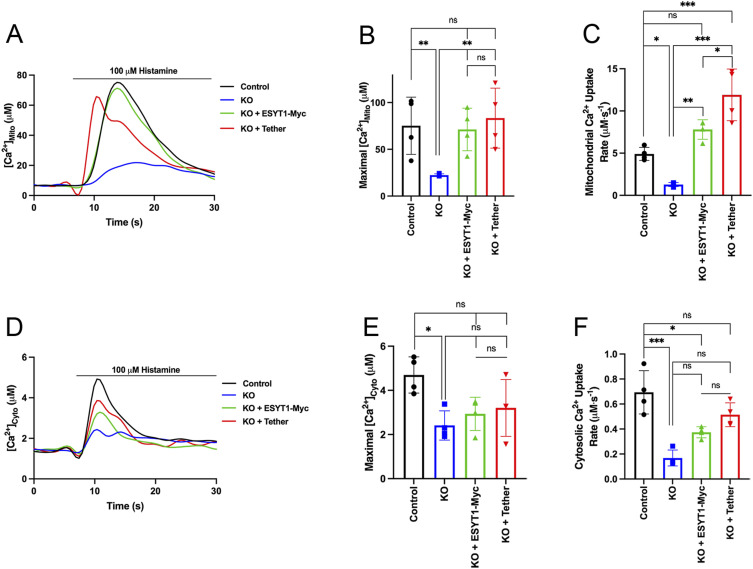
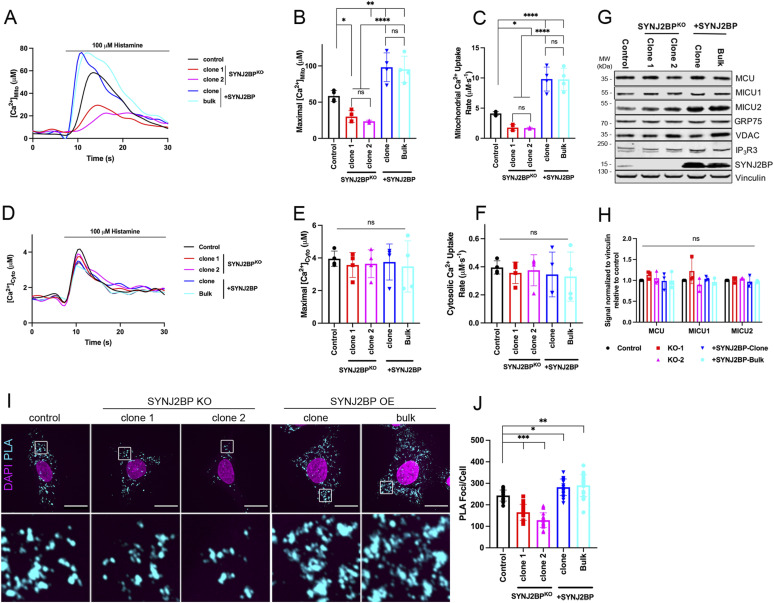
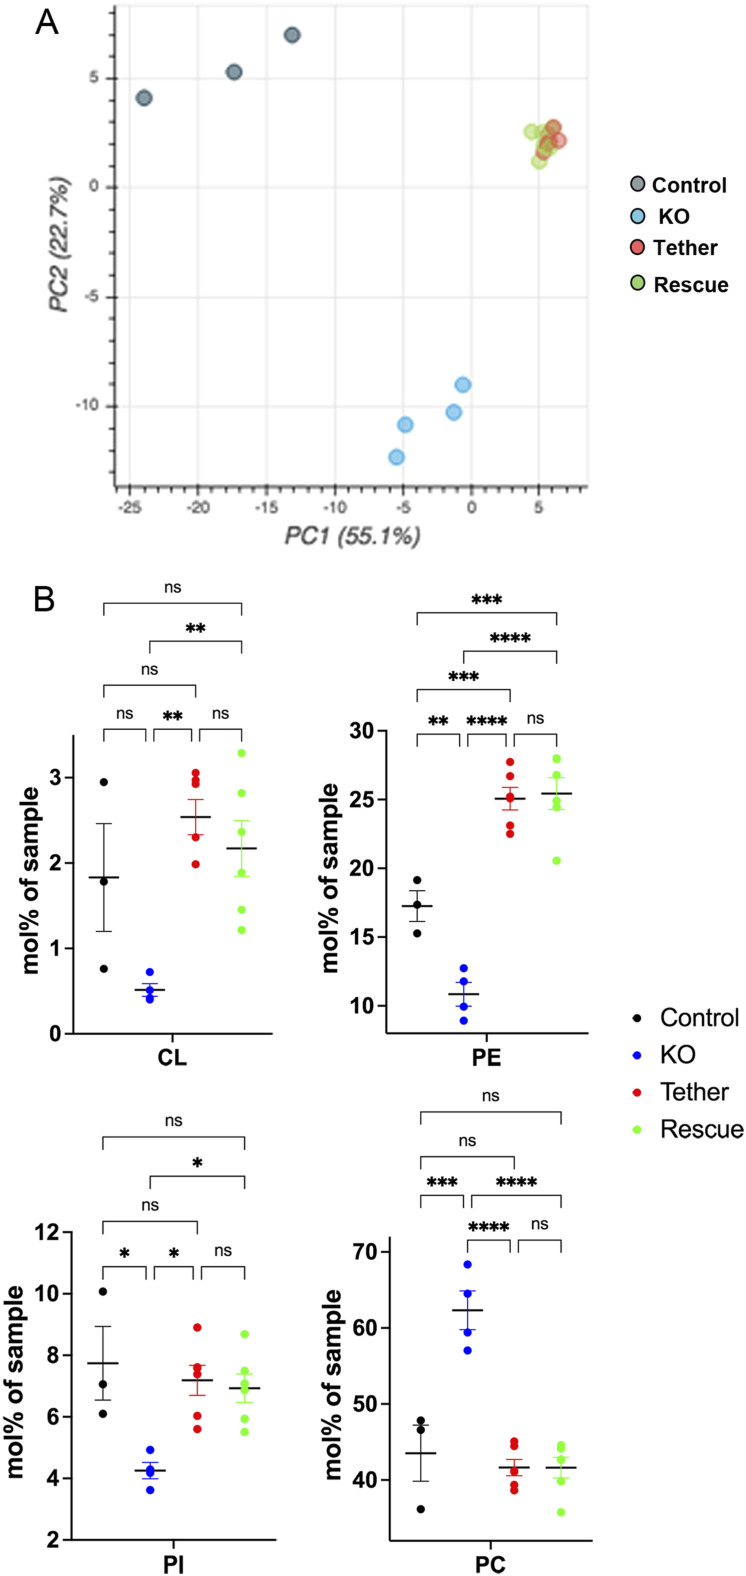
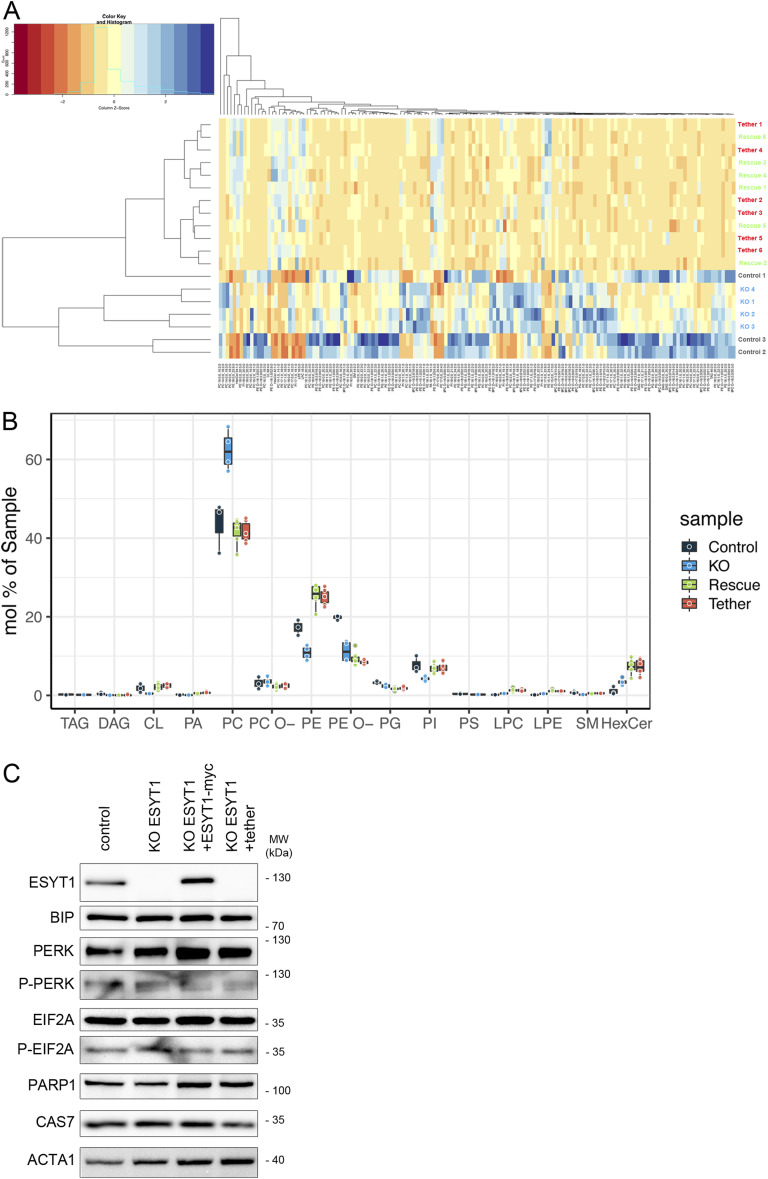
Mitochondria interact with the ER at structurally and functionally specialized membrane contact sites known as mitochondria-ER contact sites (MERCs). Combining proximity labelling (BioID), co-immunoprecipitation, confocal microscopy and subcellular fractionation, we found that the ER resident SMP-domain protein ESYT1 was enriched at MERCs, where it forms a complex with the outer mitochondrial membrane protein SYNJ2BP. BioID analyses using ER-targeted, outer mitochondrial membrane-targeted, and MERC-targeted baits, confirmed the presence of this complex at MERCs and the specificity of the interaction. Deletion of ESYT1 or SYNJ2BP reduced the number and length of MERCs. Loss of the ESYT1-SYNJ2BP complex impaired ER to mitochondria calcium flux and provoked a significant alteration of the mitochondrial lipidome, most prominently a reduction of cardiolipins and phosphatidylethanolamines. Both phenotypes were rescued by reexpression of WT ESYT1 and an artificial mitochondria-ER tether. Together, these results reveal a novel function for ESYT1 in mitochondrial and cellular homeostasis through its role in the regulation of MERCs.


Conflict of interest statement

The authors declare that they have no conflict of interest.

Figures

Figure S1.
Figure S1.. BioID analysis.
(A) Representative images of immunofluorescence analysis of individual baits. FLAG staining representing the bait is in green, mitochondrial marker TOMM20 in magenta, and DAPI in blue. Scale bar, 10 μm. (B) Venn diagram of the BioID results for all four SMP-domain proteins. Preys that were found as significant interactors of only ESYT1 are shown; SYNJ2BP is highlighted in bold. The numbers in parenthesis indicate a total number of identified preys for each bait with BFDR ≤ 0.01. (C) Venn diagram of the BioID results for all four SMP-domain proteins and the ER_BirA*. Preys (BFDR ≤ 0.01) that were found as significant proximity interactors of only ESYT1 are shown, SYNJ2BP is highlighted in bold. (D) Enrichment of proximity interactions of ESYT1 in comparison to the proximity interaction with ER_BirA*. Preys enriched in ESYT1 BioID (≥twofold) are indicated by their gene name. Cellular compartment GO term analysis of all preys was performed and is specified in the legend. Preys found on the x- or y-axis are only present in ESYT1 or ER BioID, respectively. (E) Schematic representation of ER-targeted BirA*, OMM-targeted BirA*, and artificial ER-OMM tether BirA* and representative images of immunofluorescence analysis of individual baits. FLAG staining representing the bait is in green, mitochondrial marker PRDX3 in magenta, and ER-mEmerald stain in blue. Tether_BirA* cells were stained with all three markers and the co-localization of the bait (in the same cell) with either the mitochondrial marker or the ER marker is shown. Scale bar, 10 μm.
Figure 1.
Figure 1.. ESYT1 localizes to mitochondria–ER contact sites where it interacts with SYNJ2BP.
(A) Specificity plot of ESYT1-N-ter BioID analysis indicates the specific proximity interaction with SYNJ2BP. The specificity denotes the fold enrichment of the spectral counts detected for each prey in the ESYT1 BioID compared with the spectral counts for that prey in all other baits in the dataset (all four SMP proteins). Prey names for the most specific preys and for preys with the highest length-normalized spectral counts are indicated. Preys are colour-coded based on their GO term cellular compartment analysis. MitoCarta3.0 proteins are SYNJ2BP, FKBP8, and ALDH3A2. (B) Proximity interaction between known (and predicted) ER–mitochondrial tethers with indicated baits (BFDR ≤ 0.01). The colour of each circle represents the prey-length normalized average spectra detected for the indicated protein by each bait and the size of the circle represents the relative average spectra across the baits analyzed in this dataset. The SAINT analysis excludes self-detection for the bait protein as a prey, and is represented as X in the graph. (C) Confocal microscopy images of endogenous ESYT1 localization (magenta) in human fibroblasts stably overexpressing SEC61B-mCherry as an ER marker (green). Staining for endogenous PRDX3 serves as a mitochondrial marker (cyan). Yellow arrows point to foci of ESYT1 colocalizing with both ER and mitochondria. Scale bar = 5 μm. (D) Line scan of fluorescence intensities demonstrating focal accumulations of endogenous ESYT1 along the ER network that partially colocalize with mitochondria (A.U. = arbitrary units). (E) Quantitative confocal microscopy analysis of endogenous ESYT1 localization in control human fibroblasts stably overexpressing SEC61B-mCherry as an ER marker, labelled with ESYT1 and with TOMM40 as a mitochondrial marker. Percentage of ESYT1 signal colocalizing with mitochondria and percentage of mitochondria positive for ESYT1 were assessed. Results are expressed as means ± S.D. (n = 32). (F) Subcellular localization of endogenous ESYT1 and SYNJ2BP. Mouse liver was fractionated, and the fractions were analyzed by SDS–PAGE and immunoblotting. SIGMAR1 and IP3R1 are MAM markers, PRDX3 is a mitochondrial matrix marker, CARD19 is an outer mitochondrial membrane marker, PDI is an ER marker, and UBB is a cytosol marker. The percentage of ESYT1, SIGMAR1, and PDI signal in each fraction is shown. (G) ESYT1 protein levels in control human fibroblast, three individual clones of ESYT1 knock-out fibroblasts and fibroblasts overexpressing ESYT1-3xFLAG. Whole-cell lysates were analyzed by SDS–PAGE and immunoblotting. SDHA was used as a loading control. (H) Characterization of the ESYT1 complexes. Heavy membrane fractions were isolated from control human fibroblasts, ESYT1 knock-out fibroblasts, and fibroblasts overexpressing ESYT1-3xFLAG, solubilized with 1% DDM and analyzed by blue native PAGE.
Figure 2.
Figure 2.. Loss of ESYT1 decreases MERCs.
(A) ESYT1 protein levels in control human fibroblasts, ESYT1 knock-out fibroblasts, and ESYT1 knock-out fibroblasts expressing ESYT1-Myc. Whole cell lysates were analyzed by SDS–PAGE and immunoblotting. VDAC1 was used as a loading control. (B) Transmission electron microscopy images of control human fibroblasts, ESYT1 knock-out fibroblasts, and ESYT1 knock-out fibroblasts expressing ESYT1-Myc. (C) Quantitative analysis of Mitochondria–ER contact sites (MERCs) from the TEM images: number of MERC per mitochondria, length of MERC (nm), coverage of the mitochondrial perimeter by ER (%), and mitochondrial perimeter (nm). Results are expressed as means ± S.D. Images in each condition were analyzed (n = 38), totaling 245 mitochondria for control cells, 154 mitochondria for KO cells, and 224 mitochondria for rescued cells. Kruskal–Wallis and post hoc multiple comparisons tests were applied, ns: nonsignificant, *P < 0.05, ****P < 0.0005.
Figure 3.
Figure 3.. SYNJ2BP but not ESYT1 promotes the formation of mitochondria–ER contacts.
(A) Transmission electron microscopy images of control human fibroblasts, fibroblasts overexpressing ESYT1-FLAG, and fibroblasts overexpressing SYNJ2BP. (B) Quantitative analysis of mitochondria–ER contact sites (MERCs) in control human fibroblasts, fibroblasts overexpressing ESYT1-FLAG, and fibroblasts overexpressing SYNJ2BP showing the number of MERC per mitochondria, the length of MERC (nm), and the coverage of the mitochondrial perimeter by ER (%), and mitochondrial perimeter (nm). Results are expressed as means ± S.D. Images were analyzed in control fibroblasts (n = 27), totaling 152 mitochondria; in fibroblasts overexpressing ESYT1-FLAG (n = 26), totaling 140 mitochondria; in fibroblasts overexpressing SYNJ2BP (n = 29), totaling 300 mitochondria. Kruskal–Wallis and post hoc multiple comparisons tests were applied, ns: nonsignificant, *P < 0.05, **P < 0.01, ****P < 0.0005. (C) Quantitative confocal microscopy analysis of endogenous ESYT1 colocalization with mitochondria in control human fibroblasts (n = 32), SYNJ2BP KO fibroblasts (n = 28), and fibroblasts overexpressing SYNJ2BP (n = 23). Cells were labelled with ESYT1 and PRDX3 as a mitochondrial marker. Results are expressed as means ± S.D. ***P < 0.0005; ****P < 0.0001 (Brown–Forsythe and Welch ANOVA test). (D) Confocal microscopy images of control human fibroblasts (a) and fibroblasts overexpressing SYNJ2BP (b, c) showing SYNJ2BP localization (grey), ESYT1 localization (magenta), and RRBP1 localization (green). White arrows point to large foci of endogenous ESYT1 colocalizing with SYNJ2BP accumulations when SYNJ2BP is overexpressed. Scale bar = 10 μm. (c): zoomed image from (b) showing ESYT1 and RRBP1 accumulation in different mitochondria when SYNJ2BP is overexpressed. Yellow arrowheads point to mitochondrial ghost pattern for ESYT1 localization when SYNJ2BP is overexpressed. Scale bar = 2 μm. (E) Quantitative confocal microscopy analysis of mitochondria positive for ER in control human fibroblasts (n = 26), SYNJ2BP overexpressing fibroblasts (n = 29), ESYT1 KO fibroblasts (n = 24) and ESYT1 KO fibroblasts overexpressing SYNJ2BP (n = 26). Cells were labelled with PRDX3 as a mitochondrial marker and CANX as an ER marker. Results are expressed as means ± S.D. *P < 0.05; ***P < 0.0005; ****P < 0.0001 (Brown–Forsythe and Welch ANOVA test).
Figure S2.
Figure S2.. SYNJ2BP effect on MERCs is independent of the mitochondrial fission-fusion machinery.
(A) Confocal microscopy images of control human fibroblasts and fibroblasts overexpressing SYNJ2BP. Top panel: SYNJ2BP localization (green), cytochrome C (CytC) serves as a mitochondrial marker (cyan) and KDEL as an ER marker (magenta). Bottom panel: ESYT1 localization (green), CytC serves as a mitochondrial marker (cyan), and KDEL as an ER marker (magenta). White arrowheads highlight the accumulation of endogenous ESYT1 at MERCs when SYNJ2BP is overexpressed. Scale bar = 10 μm. Zoomed-in images, scale bar = 2 μm. (B) Confocal microscopy images of human fibroblasts. CytC serves as a mitochondrial marker (green), HSPA5 as an ER marker (magenta), and nuclei are stained with DAPI (blue). (a, b) Knock-down of DRP1 in control fibroblasts (a) and in SYNJ2BP overexpressing fibroblasts (b). (c, d) Knock-down of MFN2 in control fibroblasts (c) and in fibroblasts overexpressing SYNJ2BP (d). Scale bar = 10 μm.
Figure 4.
Figure 4.. SYNJ2BP is present in a high-molecular weight complex with ESYT1.
(A) Characterization of ESYT1 and SYNJ2BP complexes. Heavy-membrane fractions from control human fibroblasts, SYNJ2BP knock-down fibroblasts, fibroblasts overexpressing SYNJ2BP, and fibroblasts overexpressing SYNJ2BP together with a 3XFLAG-tagged version of ESYT1 were analyzed by blue native PAGE. Samples were run in duplicate on the same gel and immunoblotted with anti-SYNJ2BP (left) and anti-ESYT1 antibodies (right). Lower horizontal line: 410 kD complex where both SYNJ2BP and ESYT1 run. Higher horizontal line: higher molecular weight complex observed when SYNJ2BP is overexpressed together with a 3xFLAG-tagged version of ESYT1. (B) Two-dimensional electrophoresis analysis (BN-PAGE/SDS–PAGE) of SYNJ2BP-interacting proteins in control human fibroblasts and fibroblasts overexpressing SYNJ2BP. The migration of known protein complexes in the first dimension is indicated on the top of the blot (UQCRC1: OXPHOS complex III at 500 kD, NDUFA9: OXPHOS complex I at 1,000 kD). The position of identified SYNJ2BP containing complexes and their alignment with ESYT1 and RRBP1 containing complexes are indicated with grey lines. (C) Characterization of ESYT1, SYNJ2BP, and RRBP1 complexes. Heavy-membrane fractions from fibroblasts overexpressing SYNJ2BP or fibroblasts overexpressing SYNJ2BP in which either ESYT1 or RRBP1 was knocked down were analyzed by Blue-Native PAGE. Samples were run in triplicate on the same gel and immunoblotted with anti-ESYT1 (left), anti-SYNJ2BP (center), and anti-RRBP1 antibodies (right). (D) RRBP1, ESYT1 and SYNJ2BP protein levels in fibroblasts overexpressing SYNJ2BP untreated or treated with puromycin (200 μM for 2h and 30 mins). Whole-cell lysates were analyzed by SDS–PAGE and immunoblotting. CCDC47 was used as a loading control. (E) Two-dimensional electrophoresis analysis (BN-PAGE/SDS–PAGE) of SYNJ2BP-interacting proteins in fibroblasts overexpressing SYNJ2BP untreated or treated with puromycin (200 μM for 2h and 30 mins). The position of identified SYNJ2BP-containing complexes and their alignment with ESYT1 and RRBP1-containing complexes are indicated with grey lines.
Figure 5.
Figure 5.. ESYT1 is required for ER to mitochondria Ca2+ transfer in Hela cells.
(A) Trace of mitochondrial (Ca2+) upon histamine stimulation (100 μM) in control HeLa cells, cells knocked-down for ESYT1, and cells knocked-down for ESYT1 that express an artificial ER–mitochondria tether. All cells express the mitochondrial Ca2+ probe, CEPIA-2mt. (B) Quantification of the maximal fluorescence intensity fold-change (ΔF/F0) of CEPIA-2mt induced by histamine. Results are expressed as mean ± SD; From >50 cells per condition; n = 3 independent experiments. ns: not significant; *P < 0.05 (Turkey’s multiple comparisons test). (C) Trace of cytosolic (Ca2+) upon thapsigargin treatment (10 μM) in control HeLa cells, cells knocked-down for ESYT1 and cells knocked-down for ESYT1 that express an artificial ER–mitochondria tether. All cells express the cytosolic Ca2+ probe, R-GECO. (D) Quantification of the maximal fluorescence intensity fold change (ΔF/F0) of R-GECO upon thapsigargin treatment. Results are expressed as mean ± SD; from >50 cells per condition; n = 3 independent experiments. ns: not significant (Turkey’s multiple comparisons test). (E) Whole-cell lysates of control HeLa cells, cells knocked-down for ESYT1 and cells knocked-down for ESYT1 that express an artificial ER–mitochondria tether were analyzed by SDS–PAGE and immunoblotting. Vinculin was used as a loading control. (E, F) Quantification of three independent experiments as in panel (E). The graphs show the signal normalized to vinculin relative to control. Results are expressed as means ± S.D. Two-way ANOVA with a Dunnett correction for multiple comparisons was performed. *P < 0.05.
Figure 6.
Figure 6.. ESYT1 is required for ER to mitochondria Ca2+ transfer in human fibroblasts.
(A) Trace of cytosolic Ca2+ probe Fluoforte in control human fibroblasts, ESYT1 KO fibroblasts, ESYT1 KO fibroblasts expressing ESYT1–Myc, or an artificial mitochondria–ER tether, after treatment with thapsigargin (10 μM) and addition of 2 mM CaCl2. (B) Quantification of maximal fold change in cytosolic Ca2+ levels from thapsigargin-induced ER Ca2+ depletion to maximal cytosolic signal in control human fibroblasts, ESYT1 KO fibroblasts, ESYT1 KO fibroblasts expressing ESYT1–Myc, or an artificial mitochondria–ER tether. Results are expressed as mean ± SD from >50 cells per condition; n = 3 independent experiments. ns: not significant; *P < 0.05; **P < 0.01; ***P < 0.001 (Turkey’s multiple comparisons test). (C) Trace of mitochondrial–aequorin measurements of mitochondrial Ca2+ levels upon ATP (10 μM) stimulation in control human fibroblasts, ESYT1 KO fibroblasts, ESYT1 KO fibroblasts expressing ESYT1-Myc, or an artificial mitochondria–ER tether. (D) Quantification of maximal mitochondrial Ca2+ levels in control human fibroblasts, ESYT1 KO fibroblasts, ESYT1 KO fibroblasts expressing ESYT1–Myc or an artificial mitochondria–ER tether. Results are expressed as mean ± SD from >50 cells per condition; n = 3 independent experiments. ns: not significant; **P < 0.01 (Turkey’s multiple comparisons test). (E) Quantification of the rate of mitochondrial Ca2+ uptake in control human fibroblasts, ESYT1 KO fibroblasts, ESYT1 KO fibroblasts expressing ESYT1–Myc or an artificial mitochondria–ER tether. Results are expressed as mean ± SD from >50 cells per condition; n = 3 independent experiments. ns: not significant; *P < 0.05; **P < 0.01; ***P < 0.001 (Turkey’s multiple comparisons test). (F) Representative trace of cytosolic-aequorin measurements of mitochondrial Ca2+ levels upon ATP (10 μM) stimulation in control human fibroblasts, ESYT1 KO fibroblasts, ESYT1 KO fibroblasts expressing ESYT1–Myc or an artificial mitochondria–ER tether. Results are expressed as mean ± SD from >50 cells per condition; n = 3 independent experiments. ns: not significant; *P < 0.05; **P < 0.01; ***P < 0.001 (Turkey’s multiple comparisons test). (G) Quantification of maximal cytosolic Ca2+ levels in control human fibroblasts, ESYT1 KO fibroblasts, ESYT1 KO fibroblasts expressing ESYT1–Myc or an artificial mitochondria–ER tether. Results are expressed as mean ± SD from >50 cells per condition; n = 3 independent experiments. ns: not significant; *P < 0.05; **P < 0.01; ***P < 0.001 (Turkey’s multiple comparisons test). (H) Quantification of the rate of cytosolic Ca2+ uptake in control human fibroblasts, ESYT1 KO fibroblasts, ESYT1 KO fibroblasts expressing ESYT1–Myc or an artificial mitochondria–ER tether. Results are expressed as mean ± SD from >50 cells per condition; n = 3 independent experiments. ns: not significant; *P < 0.05; **P < 0.01; ***P < 0.001 (Turkey’s multiple comparisons test). (I) Trace of ER Ca2+ in control human fibroblasts, ESYT1 knock-out fibroblasts, ESYT1 knock-out fibroblasts expressing either ESYT1–Myc or an artificial mitochondria–ER tether. All cell lines express the ER-targeted GECI (ER-G-CEPIA1er) fluorescent probe. ER-Ca2+ release was stimulated with 100 μM histamine after 10 s of baseline (F/F0 ER-G-CEPIA1er). (J) Quantification of the fold-change in fluorescence intensity (ΔF/F0) of CEPIA-1er at the initial peak induced by histamine. Results are expressed as mean ± SD; from >50 cells per condition; n = 4 independent experiments. ns: not significant; *P < 0.05 (Turkey’s multiple comparisons test). (K) Traces of cytosolic Ca2+ in control human fibroblasts, ESYT1–KO fibroblasts, and ESYT1–KO fibroblasts expressing either ESYT1–Myc or an artificial mitochondria–ER tether. All cell lines express the cytosolic fluorescent probe FluoForte. ER-Ca2+ release was stimulated with 10 μM thapsigargin after 10 s of baseline (F/F0; FluoForte). (L) Quantification of the maximal fold change in fluorescence intensity (ΔF/F0) of FluoForte upon thapsigargin stimulation (max F/F0; FluoForte). Mean ± SD, n = 4 independent experiments. ns = not significant (Turkey’s multiple comparisons test). (M) Whole-cell lysates of control human fibroblasts, ESYT1-KO fibroblasts and ESYT1-KO fibroblasts expressing either ESYT1-Myc or an artificial mitochondria–ER tether were analyzed by SDS–PAGE and immunoblotting. Vinculin was used as a loading control. (M, N) Quantification of three independent experiments as in panel (M). The graphs show the signal normalized to vinculin relative to control. Results are expressed as means ± S.D. Two-way ANOVA with a Dunnett correction for multiple comparisons was performed. ns: not significant. (O) Heavy membrane fractions were isolated from control human fibroblasts, ESYT1 knock-out fibroblasts, ESYT1 knock-out fibroblasts expressing ESYT1–Myc or an artificial mitochondria–ER tether, solubilized and analyzed by blue native PAGE. SDHA was used as a loading control.
Figure S3.
Figure S3.. ESYT1 is required for ER to mitochondria Ca2+ transfer.
(A) Trace of mitochondrial–aequorin measurements of mitochondrial Ca2+ upon histamine stimulation (100 μM) in control human fibroblasts, ESYT1 knock-out fibroblasts, ESYT1 knock-out fibroblasts expressing either ESYT1–Myc or an artificial mitochondria–ER tether. (B) Quantification of maximal mitochondrial Ca2+. Results are expressed as mean ± SD. From >50 cells per condition; n = 4 independent experiments. ns: not significant; **P < 0.01 (Turkey’s multiple comparisons test). (C) Quantification of the rate of mitochondrial Ca2+ uptake. Results are expressed as mean ± SD. From >50 cells per condition; n = 4 independent experiments. ns: not significant; *P < 0.05; **P < 0.01; ***P < 0.001 (Turkey’s multiple comparisons test). (D) Trace of cytosolic–aequorin measurements of cytosolic Ca2+ upon histamine stimulation (100 μM) in control human fibroblasts, ESYT1 knock-out fibroblasts, ESYT1 knock-out fibroblasts expressing either ESYT1–Myc or an mitochondria–ER artificial tether. (E) Quantification of maximal cytosolic Ca2+. Results are expressed as mean ± SD. From >50 cells per condition; n = 4 independent experiments. ns: not significant; *P < 0.05 (Turkey’s multiple comparisons test). (F) Quantification of the rate of cytosolic Ca2+ uptake. Results are expressed as mean ± SD. From >50 cells per condition; n = 4 independent experiments. ns: not significant; *P < 0.05; ***P < 0.001 (Turkey’s multiple comparisons test).
Figure 7.
Figure 7.. SYNJ2BP is required for ER to mitochondria Ca2+ transfer.
(A) Trace of mitochondrial–aequorin measurements of mitochondrial Ca2+ upon histamine stimulation (100 μM) in control human fibroblasts, SYNJ2BP knock-out fibroblasts (clone 1 and 2), and fibroblasts overexpressing SYNJ2BP (clone and bulk). (B) Quantification of maximal mitochondrial Ca2+. Results are expressed as mean ± SD. From >50 cells per condition; n = 4 independent experiments. ns: not significant; *P < 0.05; **P < 0.01; ****P < 0.0001 (Turkey’s multiple comparisons test). (C) Quantification of the rate of mitochondrial Ca2+ uptake. Results are expressed as mean ± SD. From >50 cells per condition; n = 4 independent experiments. ns: not significant; *P < 0.05; ****P < 0.0001 (Turkey’s multiple comparisons test). (D) Trace of cytosolic–aequorin measurements of cytosolic Ca2+ upon histamine stimulation (100 μM) in control human fibroblasts, SYNJ2BP knock-out fibroblasts (clone 1 and 2), and fibroblasts overexpressing SYNJ2BP (clone and bulk). (E) Quantification of maximal cytosolic Ca2+. Results are expressed as mean ± SD. From >50 cells per condition; n = 4 independent experiments. ns: not significant (Turkey’s multiple comparisons test). (F) Quantification of the rate of cytosolic Ca2+ uptake. Results are expressed as mean ± SD. From >50 cells per condition; n = 4 independent experiments. ns: not significant (Turkey’s multiple comparisons test). (G) Whole-cell lysates of control human fibroblasts, SYNJ2BP knock-out fibroblasts (clone 1 and 2), and fibroblasts overexpressing SYNJ2BP (clone and bulk) were analyzed by SDS–PAGE and immunoblotting. Vinculin was used as a loading control. (G, H) Quantification of three independent experiments as in panel (G). The graphs show the signal normalized to vinculin relative to control. Results are expressed as means ± S.D. Two-way ANOVA with a Dunnett correction for multiple comparisons was performed. ns: not significant. (I) Representative confocal images of PLA experiment in control human fibroblasts, SYNJ2BP knock-out fibroblasts (clone 1 and 2), and fibroblasts overexpressing SYNJ2BP (clone and bulk). Anti-VDAC1 and anti-IP3R1 were used as primary antibodies in the assay. Scale bars represent 20 μm. (H, J) Quantification of average number of PLA foci per cell corresponding to (H). At least 20 cells were quantified per condition per independent experiment, n = 3 independent experiments. Error bars represent mean ± SD. *P < 0.05, **P < 0.01, ***P < 0.001.
Figure 8.
Figure 8.. ESYT1 regulates mitochondrial lipid homeostasis.
Sucrose bilayer purified mitochondria from control human fibroblasts (control, n = 3), ESYT1 KO fibroblasts (KO, n = 4) and ESYT1 KO fibroblasts expressing either ESYT1–Myc (Rescue, n = 6) or an mitochondria–ER artificial tether (Tether, n = 6) were analyzed for absolute quantification of lipid content using shotgun mass spectrometry lipidomics. (A) PCA analysis of individual samples. Lipid species mol% were used as input data. (B) Lipid class profile of cardiolipins (CL), phosphatidylethanolamines (PE), phosphatidylinositols (PI), and phosphatidylcholines (PC). Data are presented as molar % of the total lipid amount (mol%). One-way ANOVA with multiple comparisons analysis was applied. Error bars represent mean ± SEM. ns: not significant, *P < 0.05, **P < 0.01, ***P < 0.001, ****P < 0.0001.
Figure S4.
Figure S4.. Mitochondrial lipids analysis.
Sucrose bilayer purified mitochondria from control human fibroblasts (control, n = 3), ESYT1 KO fibroblasts (KO, n = 4), and ESYT1 KO fibroblasts expressing either ESYT1–Myc (Rescue, n = 6) or an ER–mitochondria artificial tether (Tether, n = 6) were analyzed for absolute quantification of lipid content using shotgun mass spectrometry lipidomics. (A) Hierarchical clustering with heatmap analysis of samples (rows) and lipids (columns). (B) Lipid class profile of analyzed samples. Data are presented as molar % of the total lipid amount (mol%). TAG, triacylglycerol; DAG, diacylglycerol; CL, cardiolipin; PA, phosphatidate; PC, phosphatidylcholine; PC-O, phosphatidylcholine ether; PE, phosphatidylethanolamine; PE-O, phosphatidylethanolamine ether; PG, phosphatidylglycerol; PI, phosphatidylinositol; PS, phosphatidylserine; LPC, lyso-phosphatidylcholine; LPE, lyso-phosphatidylethanolamine; SM, sphingomyelin; HexCer, hexosylceramide. (C) WB analysis of ER stress and cell death pathway proteins in control fibroblasts, KO ESYT1 fibroblasts, KO ESYT1 fibroblasts overexpressing ESYT1–Myc or the artificial tether. Whole-cell lysates were analyzed by SDS–PAGE and immunoblotting. Actin was used as a loading control.

References

    1. Aaltonen MJ, Alecu I, König T, Bennett SA, Shoubridge EA (2022) Serine palmitoyltransferase assembles at ER-mitochondria contact sites. Life Sci Alliance 5: e202101278. 10.26508/lsa.202101278 - DOI - PMC - PubMed
    1. Acín-Pérez R, Fernández-Silva P, Peleato ML, Pérez-Martos A, Enriquez JA (2008) Respiratory active mitochondrial supercomplexes. Mol Cell 32: 529–539. 10.1016/j.molcel.2008.10.021 - DOI - PubMed
    1. Acoba MG, Senoo N, Claypool SM (2020) Phospholipid ebb and flow makes mitochondria go. J Cell Biol 219: e202003131. 10.1083/jcb.202003131 - DOI - PMC - PubMed
    1. Ahmad M, Narayanasamy S, Ong HL, Ambudkar I (2022) STIM proteins and regulation of SOCE in ER-PM junctions. Biomolecules 12: 1152. 10.3390/biom12081152 - DOI - PMC - PubMed
    1. AhYoung AP, Jiang J, Zhang J, Khoi Dang X, Loo JA, Zhou ZH, Egea PF (2015) Conserved SMP domains of the ERMES complex bind phospholipids and mediate tether assembly. Proc Natl Acad Sci U S A 112: E3179–E3188. 10.1073/pnas.1422363112 - DOI - PMC - PubMed

Publication types

LinkOut - more resources