. 2023 Nov 6;14(1):7138.
doi: 10.1038/s41467-023-42901-3.

Realizing a deep reinforcement learning agent for real-time quantum feedback

Affiliations

Realizing a deep reinforcement learning agent for real-time quantum feedback

Kevin Reuer et al. Nat Commun. .

Abstract

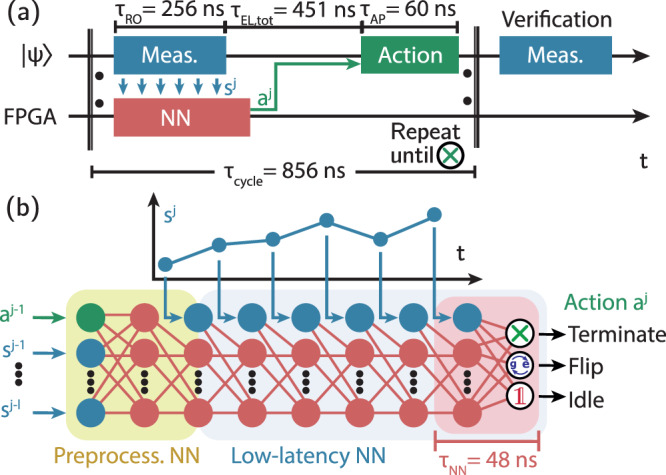
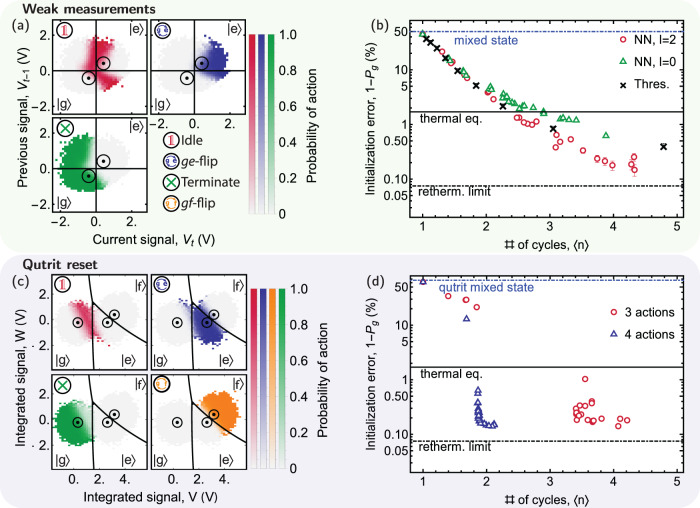
Realizing the full potential of quantum technologies requires precise real-time control on time scales much shorter than the coherence time. Model-free reinforcement learning promises to discover efficient feedback strategies from scratch without relying on a description of the quantum system. However, developing and training a reinforcement learning agent able to operate in real-time using feedback has been an open challenge. Here, we have implemented such an agent for a single qubit as a sub-microsecond-latency neural network on a field-programmable gate array (FPGA). We demonstrate its use to efficiently initialize a superconducting qubit and train the agent based solely on measurements. Our work is a first step towards adoption of reinforcement learning for the control of quantum devices and more generally any physical device requiring low-latency feedback.


Conflict of interest statement

The authors declare no competing interests.

Figures

Fig. 1
Fig. 1. Concept of the experiment.
A reinforcement learning (RL) agent, realized as a neural network (NN, red) on a field-programmable gate array (FPGA), receives observations s (Observ., blue trace) from a quantum system, which constitutes the reinforcement learning environment. Here, the quantum system is realized as a transmon qubit coupled to a readout resonator fabricated on a chip (see photograph). The agent processes observations on sub-microsecond timescales to decide in real time on the next action a applied to the quantum system. The update of the agent’s parameters is performed by processing experimentally obtained batches of observations and actions on a PC.
Fig. 2
Fig. 2. Schematic of neural-network-based real-time feedback control.
a Timing diagram of an experimentally realized reinforcement learning episode. In each cycle j, the observation sj resulting from a measurement (Meas., blue) is continuously fed into a neural network (NN, red) which determines the next action aj (green). The process is terminated after a number of cycles determined by the agent. Then, a verification measurement is performed. b Schematic of the neural network implemented on an FPGA. The neural network consists of fully connected (red lines) layers of feed-forward neurons (red dots) and input neurons (blue dots for observations, green dots for actions). The first layers form the preprocessing network (yellow background). During the evaluation of the low-latency network (blue background), new data points from the signal trace sj are fed into the network as they become available. The network outputs the action probabilities for the three actions. Only the execution of the last layer (red background) contributes to the overall latency.
Fig. 3
Fig. 3. Experimental data for reinforcement learning with a network-based real-time agent.
a Initialization error 1 − Pg and b average number of cycles 〈n〉 until termination vs. number of training episodes NTrain, when preparing an equilibrium state (red squares) and when inverting the population with a π-pulse (dark blue circles) for three independent training runs (solid and transparent points). Each datapoint is obtained from an independent validation data set with ~180,000 episodes. c Probability of choosing an action P(a) vs. the integrated measurement signal V. Actions chosen by the threshold-based strategy are shown as background colors (also for (e)). d Initialization error 1 − Pg vs. average number of cycles 〈n〉 until termination for an equilibrium state for the reinforcement learning agent (red circles) and the threshold-based strategy (black crosses). Stars indicate the strategies used for the experiments in (c) and (e). The dot-dashed black indicates the thermal equilibrium (thermal eq.). Error bars indicate the standard deviation of the fitted initialization error 1 − Pg. e Histogram of the integrated measurement signal V for the initial equilibrium state (blue circles), for the verification measurement (red triangles) and for the measurement in which the agent terminates (green diamonds). Lines are bimodal Gaussian fits, from which we extract ground state populations as shown in the inset. The dashed black line in (d) and (e) indicates the rethermalization (retherm.) limit (see main text).
Fig. 4
Fig. 4. Reinforcement learning results for weak measurements and three-level systems.
a Probability P(a) of selecting the action indicated in the top left corner vs. the signal of the current Vt and the previous Vt−1 cycle if the agent is permitted to access information from l = 2 previous cycles. The radii of the black circles indicate the standard deviation around the means (black dots) of the fitted bi-modal Gaussian distribution. Black lines are the state discrimination thresholds (normalized to 0, see Supplementary Note 2). P(a) is shown for each bin with at least a single count. Empty bins are colored white (also for (d)). b Initialization error 1 − Pg vs. 〈n〉 for weak measurements for an initially mixed state for l = 2 (red circles), l = 0 (green triangles) of the neural network (NN) and a thresholding strategy (black crosses). c Probability P(a) of choosing the indicated action vs. V and W. Black circles indicate the standard deviation ellipse around the means (black dots) of the fitted tri-modal Gaussian distribution. Black lines are state discrimination thresholds (see Supplementary Note 2). d Initialization error 1 − Pg for a completely mixed qutrit state vs. 〈n〉 when the agent can select to idle, ge-flip and terminate (red circles), and when the agent can in addition perform a gf-flip (blue triangles). The dashed black line in (b) and (d) indicates the rethermalization (retherm.) limit (see main text), the solid black line indicates the thermal equilibrium (thermal eq.). Error bars indicate the standard deviation of the fitted initialization error 1 − Pg.

References

    1. Wiseman, H. & Milburn, G. Quantum Measurement and Control (Cambridge University Press, 2009).
    1. Zhang J, Liu Y-X, Wu R-B, Jacobs K, Nori F. Quantum feedback: Theory, experiments, and applications. Phys. Rep. 2017;679:1. doi: 10.1016/j.physrep.2017.02.003. - DOI
    1. Ristè D, Bultink CC, Lehnert KW, DiCarlo L. Feedback control of a solid-state qubit using high-fidelity projective measurement. Phys. Rev. Lett. 2012;109:240502. doi: 10.1103/PhysRevLett.109.240502. - DOI - PubMed
    1. Campagne-Ibarcq P, et al. Persistent control of a superconducting qubit by stroboscopic measurement feedback. Phys. Rev. X. 2013;3:021008.
    1. Salathé Y, et al. Low-latency digital signal processing for feedback and feedforward in quantum computing and communication. Phys. Rev. Appl. 2018;9:034011. doi: 10.1103/PhysRevApplied.9.034011. - DOI