. 2023 Nov 6;14(1):7111.
doi: 10.1038/s41467-023-42651-2.

Tracing cancer evolution and heterogeneity using Hi-C

Affiliations

Tracing cancer evolution and heterogeneity using Hi-C

Dan Daniel Erdmann-Pham et al. Nat Commun. .

Abstract

Chromosomal rearrangements can initiate and drive cancer progression, yet it has been challenging to evaluate their impact, especially in genetically heterogeneous solid cancers. To address this problem we developed HiDENSEC, a new computational framework for analyzing chromatin conformation capture in heterogeneous samples that can infer somatic copy number alterations, characterize large-scale chromosomal rearrangements, and estimate cancer cell fractions. After validating HiDENSEC with in silico and in vitro controls, we used it to characterize chromosome-scale evolution during melanoma progression in formalin-fixed tumor samples from three patients. The resulting comprehensive annotation of the genomic events includes copy number neutral translocations that disrupt tumor suppressor genes such as NF1, whole chromosome arm exchanges that result in loss of CDKN2A, and whole-arm copy-number neutral loss of homozygosity involving PTEN. These findings show that large-scale chromosomal rearrangements occur throughout cancer evolution and that characterizing these events yields insights into drivers of melanoma progression.


Conflict of interest statement

D.S.R. is a paid consultant and equity holder in Dovetail Genomics. J.D. and M.B. are employees of Dovetail Genomics. The other authors declare no competing interests.

Figures

Fig. 1
Fig. 1. Schematic of HiDENSEC pipeline.
Pipeline (left to right) begins from formalin-fixed paraffin-embedded tumor samples subjected to Hi-C. FFPE samples may be microdissected; the green outline in the example outlines the nevus and the red curve the melanoma area. When aligned to the human reference genome Hi-C reveals large-scale structural variants as off-diagonal enrichments in contact maps. HiDENSEC first corrects the on-diagonal intensities of contact maps for covariates such as chromatin compartments, mappability, GC content, and restriction site density. These corrected intensities provide absolute copy numbers for every genomic region. Copy numbers for large-scale structural variants inferred from the Hi-C contact maps can also be assigned. Hi-C reads can also be used to compute the regional allele frequency spectrum of germline mutations, which aid in providing higher resolution inference. Combining the output of HiDENSEC on multiple samples from a single patient allows inferences on the temporal order in which structural and copy number alterations during tumor evolution.
Fig. 2
Fig. 2. Validation of HiDENSEC using mixtures of samples.
a The HiDENSEC absolute copy number inferences for the cancer cell line HCC1187 are overlaid with copy numbers inferred using dSKY. The horizontal axis represents genomic position, with the alternating gray and white bands representing odd and even chromosomes, respectively. The i-th chromosome is denoted by χi. A histogram of absolute copy numbers is aligned on the right, illustrating the resulting spacings between inferred copy number levels and their relation to the fraction of cancer cells within a given sample. b The HiDENSEC absolute copy number inferences for the purely diploid GM12878 cell line. The histogram of the absolute copy number values on the right indicates that this control sample contains no detectable subpopulation of cells with DNA copy number changes. c Using in silico mixtures of Hi-C data from the HCC1187 cancer cell line, and the purely diploid GM12878 lymphoblastoid cell line, HiDENSEC simultaneously accurately infers tumor purity and genome-wide absolute copy number (ploidy). The blue, orange, and green lines correspond to mixtures of 76%, 48%, and 28% reads coming from HCC1187. The resulting inferred tumor purities of 75%, 48% and 27% within 2% of their true fraction in the mixture. d Using in vitro Fix-C samples from mixtures of the HCC1187 cancer and GM12878 wild type cell lines, HiDENSEC successfully infers tumor purity and genome-wide absolute copy number. The blue, orange, and green lines correspond to 50%, 33%, and 20% HCC1187 cells. The resulting HiDENSEC tumor purities are 49%, 34%, and 18%, respectively, which are all again within 2% of the ground truth tumor purities. Supplementary Fig. 3a depicts the 95% confidence intervals associated with these HiDENSEC tumor purity inferences. e, f After covariate correction and rescaling (Supplementary Note 1), Hi-C intensities are proportional to tumor purity for three different large structural variants in in vitro mixtures of HCC1187 cancer cells and karyotypically diploid GM12878 cells at varying proportions, confirming that HiC data provides a reliable signal for inferring tumor purity.
Fig. 3
Fig. 3. Benchmarking HiDENSEC’s identification of genome rearrangements.
a Comparison of HiDENSEC’s performance relative to HiNT-TL, EagleC and hic_breakfinder on the same in vitro mixtures as in Fig. 2 (the second row comprises technical replicates of the first row). Each graph measures top-k recall; that is, for each value of k (horizontal axis), it indicates the proportion of true large-scale genome rearrangements (as assessed by manual annotation of the Hi-C map or reported in the literature) contained within the k most significant calls returned by the respective algorithm (vertical axis). This visualization differs from typical ROC plots, and allows one to read off both recall (vertical axis) and precision (as the fraction of step-increases up to a fixed number of calls). Black and red points on the graphs and their corresponding vertical lines characterize algorithm-specific significance thresholds, while solid and dashed lines distinguish performance relative to the full set of rearrangements (solid) and relative to the set of only those events classified as either type-1 or type-2 (see main text for definitions). b Illustration of detection thresholds and localization accuracy on a specific type-1 rearrangement (as described in the main text) involving a fusion of a region of chromosome 14q with a region of 20p. Hi-C sub-matrices corresponding to the region of interest (in row-wise arrangement mirroring part (a)) are annotated by HiDENSEC’s, HiNT’s, EagleC’s and hic_breakfinder’s relevant calls (coloring as in (a)). Absence of certain colored squares indicates cases where the associated method does not localize any breakpoints within 2.5 Mb of the true fusion event. c Same comparison as in (a) performed on a sample from Patient 4.
Fig. 4
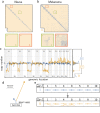
Fig. 4. HiDENSEC analysis of Patient 1.
a, b Hi-C maps from the nevus area (Sample 1 - I) and the adjacent melanoma area (Sample 1 - II) are shown along with insets zooming into two different structural variants exclusive to the melanoma area. c HiDENSEC absolute copy numbers inferred for both samples (Sample 1 - I in blue and Sample 1 - II in orange) are shown in the same format as Fig. 2a–d. d Somatic mutation analysis from exome sequencing yields a phylogenetic tree with BRAF V600E as the driver mutation found in both the nevus and the melanoma, but not in the normal control tissue. The length of the branches and the trunk in this phylogenetic tree are scaled based on the number of somatic variants, as described in Supplementary Fig. 6a. e Schematics of the inferred karyotypes of the nevus (Sample 1 - I in blue) and melanoma (Sample 1 - II in orange) from Patient 1. Each column represents a chromosome, with the column header denoting the chromosome number. The dashed lines indicate lost fragments, while curved lines connect parts involved in rearrangements. White dots indicate uncertainty about the centromere involved in a rearrangement.
Fig. 5
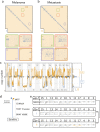
Fig. 5. HiDENSEC analysis of Patient 2.
a, b show the Hi-C maps from the primary melanoma (Sample 2 - I) and the corresponding metastasis (Sample 2 - II), respectively. The insets zoom into large-scale structural variants that are observed in the two samples. c HiDENSEC inferred absolute copy number for the two tumors along with the inferred tumor purities. d Somatic mutations from UCSF500 cancer gene panel sequencing yield a phylogenetic tree with BRAF V600E, a TERT promoter mutation and a CDKN2A mutation as some of the driver mutations. The length of the branches and the trunk in this phylogenetic tree are inferred using the somatic allele frequencies of all somatic variants, as described in Supplementary Fig. 6b. There is a metastasis-specific somatic mutation in MITF which is known to be associated with melanoma progression, and the loss of the p-arm of chromosome 3 and the wild-type allele in the metastasis. e Schematic of the various structural variants observed in the two samples and the inferred genome of their most recent common ancestor (MRCA), with a phylogeny shown to the right. Notation mirrors that of Fig. 4e, with additional triangles indicating inversion events. *The translocations between chromosomes 2, 5, and 10 are elaborated upon in Supplementary Fig. 7a.
Fig. 6
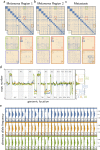
Fig. 6. HiDENSEC analysis of Patient 3.
ac Hi-C maps derived from two areas of the primary melanoma (Sample 3 - I and Sample 3 - II) and a corresponding metastasis (Sample 3 - III) are shown along with insets zooming into large-scale structural variants that are observed in the three samples. d HiDENSEC inferred absolute copy number for the three samples along with the inferred tumor purities. Sample I in blue, II in orange, III in green. e Regional allele frequency spectra of common SNPs (1000 Genomes Project data (Online Methods) for I (top) II (middle), and III (bottom), colors as in (d), were used to track haplotypes. The allele frequency spectrum serves as an independent confirmation of the absolute copy numbers inferred in (d).
Fig. 7
Fig. 7. Evolution of the melanoma genome in Patient 3.
a Structural variants in the three cell populations inferred to be present in the two areas of the primary melanoma (Sample 3 - I and Sample 3 - II) and a corresponding metastasis (Sample 3 - III) (Supplementary Data 5). Notation as in Figs. 4e and 5e. Curved dashed connectors represent translocations present in the ancestor but not in the sample itself. Brown (purple) color indicates maternal (paternal) haplotype. Assignments of chromosomes to maternal (paternal) haplotypes may change across columns. b Inferred evolutionary changes of the three observed cancer genomes. Genetic tree of the three samples, with annotation indicating rearrangement events following standard cytogenetic nomenclature, with t(;) representing reciprocal translocations, der() indicating derivative chromosomes of such events, and plus and minus signs indicate gains and deletions. For chromosome 1, the “+1,−1” refers to gain and loss of distinct haplotypes. The patient 3 sample admits three distinct phylogenetic trees consistent with HiDENSEC’s inferred copy number profile, large-scale rearrangements, and subsequent immunostaining and FISH analyses. The tree featuring the least number of independent duplicate events is depicted, with the remaining two alternatives given in Supplementary Fig. 8. *A schematic of the translocation between chromosomes 5 and 7 is depicted in Supplementary Fig. 7b, with detailed Hi-C insets of chromosomes 5, 7, 17, and 19 provided in Supplementary Fig. 9. **The precise origination of the chromosome 10q event cannot be determined from the data, and may occur anywhere prior to its current placement in the tree. c A phylogenetic tree derived from somatic mutations. d Immunostaining NF1 protein in an FFPE section (single replicate) of Sample 3 - I. Circled with a black dashed line is a region of the tumor that is not immunoreactive. The inset shows a magnification of the margin between the NF1 positive and NF1 negative region. e Quantification of FISH analysis of FFPE section of Sample 3 - I, II and III for probes hybridizing to chromosome 6p, 6q, 11p13 and the centromere of 6. Numbers indicate signals detected per nucleus (obtained via a single replicate) and the total number of signals within the analyzed area are plotted.

References

    1. Nowell PC. The clonal evolution of tumor cell populations. Science. 1976;194:23–28. doi: 10.1126/science.959840. - DOI - PubMed
    1. Ding L, et al. Clonal evolution in relapsed acute myeloid leukaemia revealed by whole-genome sequencing. Nature. 2012;481:506–510. doi: 10.1038/nature10738. - DOI - PMC - PubMed
    1. Aparicio S, Caldas C. The implications of clonal genome evolution for cancer medicine. N. Engl. J. Med. 2013;368:842–851. doi: 10.1056/NEJMra1204892. - DOI - PubMed
    1. Beroukhim R, et al. The landscape of somatic copy-number alteration across human cancers. Nature. 2010;463:899–905. doi: 10.1038/nature08822. - DOI - PMC - PubMed
    1. Roy DM, et al. Integrated genomics for pinpointing survival loci within arm-level somatic copy number alterations. Cancer Cell. 2016;29:737–750. doi: 10.1016/j.ccell.2016.03.025. - DOI - PMC - PubMed

Publication types