. 2023 Nov 6;14(1):7136.
doi: 10.1038/s41467-023-42690-9.

FNIP1 abrogation promotes functional revascularization of ischemic skeletal muscle by driving macrophage recruitment

Affiliations

FNIP1 abrogation promotes functional revascularization of ischemic skeletal muscle by driving macrophage recruitment

Zongchao Sun et al. Nat Commun. .

Abstract

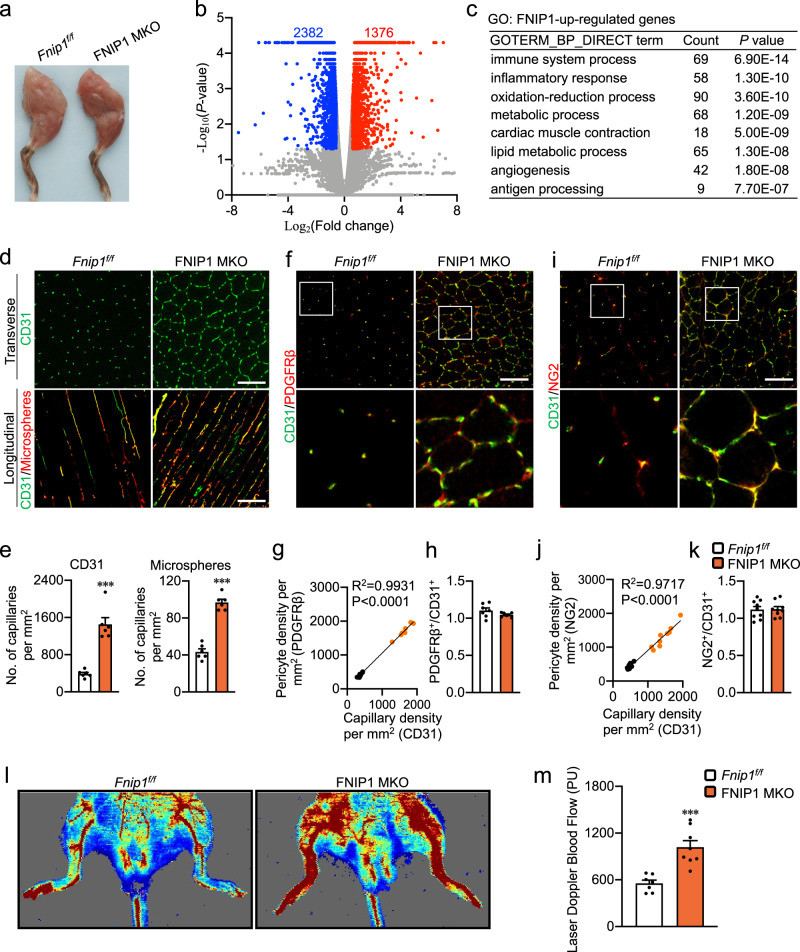
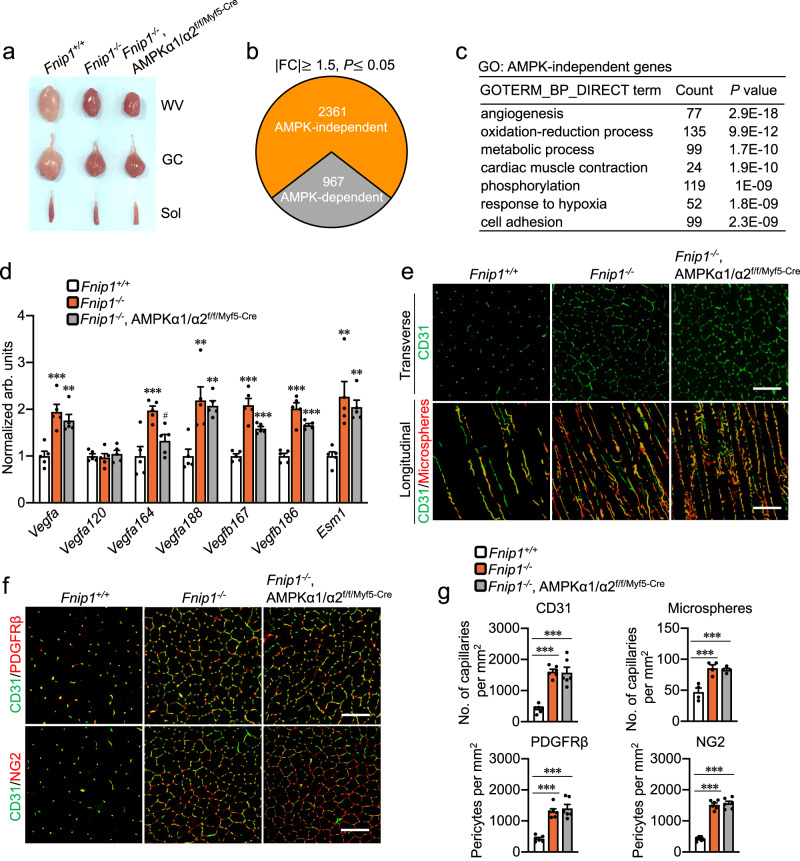
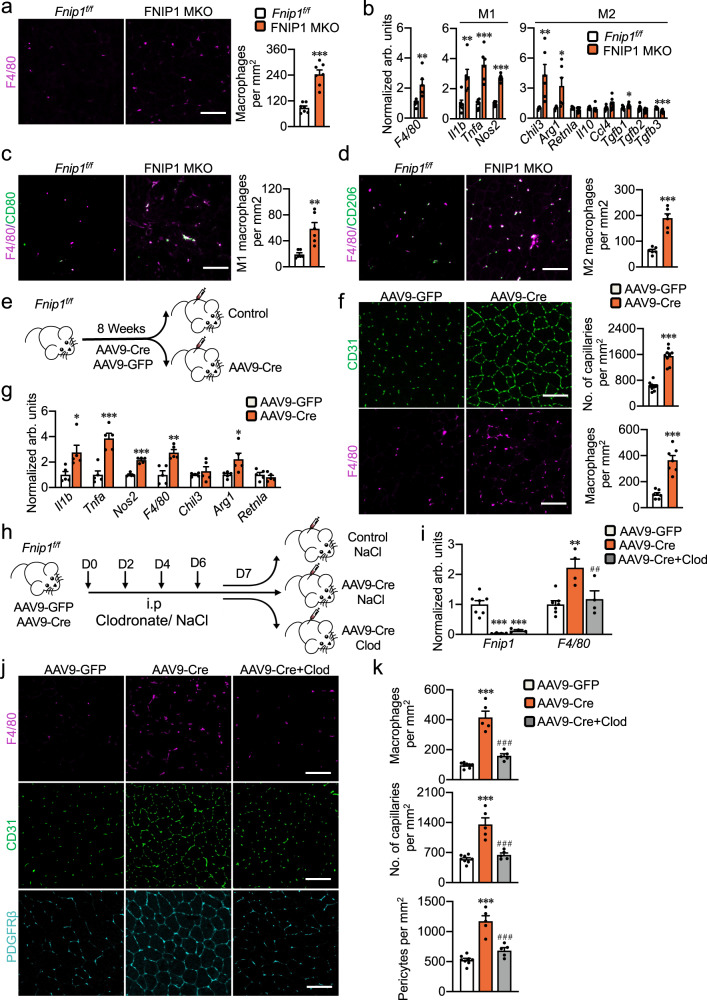
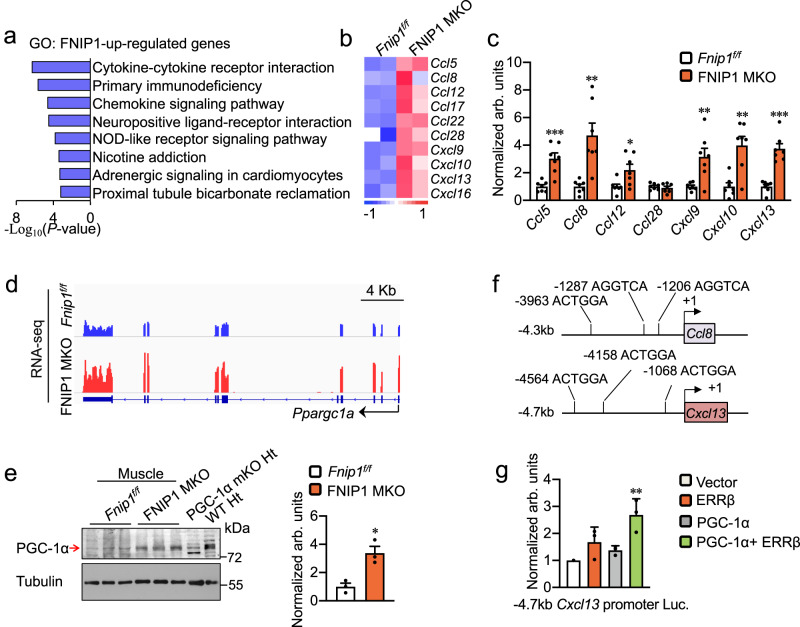
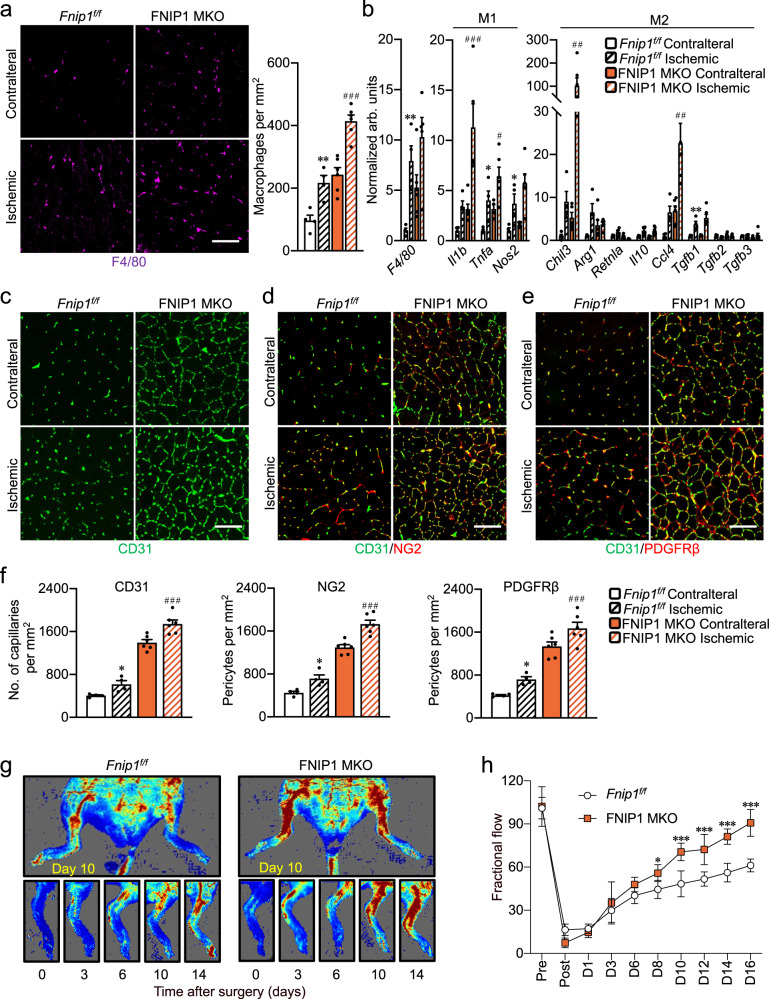
Ischaemia of the heart and limbs attributable to compromised blood supply is a major cause of mortality and morbidity. The mechanisms of functional angiogenesis remain poorly understood, however. Here we show that FNIP1 plays a critical role in controlling skeletal muscle functional angiogenesis, a process pivotal for muscle revascularization during ischemia. Muscle FNIP1 expression is down-regulated by exercise. Genetic overexpression of FNIP1 in myofiber causes limited angiogenesis in mice, whereas its myofiber-specific ablation markedly promotes the formation of functional blood vessels. Interestingly, the increased muscle angiogenesis is independent of AMPK but due to enhanced macrophage recruitment in FNIP1-depleted muscles. Mechanistically, myofiber FNIP1 deficiency induces PGC-1α to activate chemokine gene transcription, thereby driving macrophage recruitment and muscle angiogenesis program. Furthermore, in a mouse hindlimb ischemia model of peripheral artery disease, the loss of myofiber FNIP1 significantly improved the recovery of blood flow. Thus, these results reveal a pivotal role of FNIP1 as a negative regulator of functional angiogenesis in muscle, offering insight into potential therapeutic strategies for ischemic diseases.


Conflict of interest statement

The authors declare no competing interests.

Figures

Fig. 1
Fig. 1. FNIP1-dependent regulation of skeletal muscle angiogenesis.
a Gene expression of Fnip1 (qRT-PCR) in gastrocnemius (GC) muscles from indicated mice. n = 6 biologically independent mice. P value: 0.0005. Western blot analysis of FNIP1 from 14-week-old indicated mice. Quantification of FNIP1/Tubulin signal ratios were normalized (= 1.0) to controls and presented below the corresponding bands. n = 4 biologically independent mice. b, c Representative images (b) and quantification (c) of CD31 immunofluorescent in GC muscles of 8-week-old mice. Scale bar, 100 µm. n = 9 biologically independent mice. P value: <0.0001. d Representative hindlimbs from 8-week-old mice. e Gene ontology (GO) enrichment analysis of gene transcripts regulated only in FNIP1 KO but not in FNIP1 TgKO muscles. The regulated pathways were reviewed using “Biological Process_Direct” term defined by GO, which is ranked by P value (one-sided Fisher’s exact test). f Expression of genes (qRT-PCR) associated with angiogenesis in GC muscles from 8-week-old mice. n = 5 biologically independent mice. *P value: <0.0001, <0.0001, 0.0026, <0.0001, 0.0026, <0.0001, 0.0006. #P value: < 0.0001, <0.0001, 0.0002, <0.0001, 0.0002, <0.0001, 0.0458, 0.001. g, h Representative images (g) and quantification (h) of CD31 immunofluorescent and microsphere perfused images in GC muscles of 8-week-old mice. Scale bar, 100 µm. CD31, n = 7 biologically independent mice; microsphere, n = 4 biologically independent mice. *P value: < 0.0001, 0.0012. #P value: < 0.0001, 0.0009. i Representative confocal images of CD31 (green) and PDGFRβ (red) co-staining, CD31 (green) and NG2 (red) co-staining in GC muscles. Scale bar, 100 µm. n = 6 biologically independent mice. j Quantification of pericytes per mm2 in (i). n = 6 biologically independent mice. *P value: <0.0001, <0.0001. #P value: <0.0001, <0.0001. All data are shown as the mean ± SEM. **P < 0.01, ***P < 0.001 vs. corresponding controls, ###P < 0.001 vs. FNIP1 KO, determined by two-tailed unpaired Student’s t test (a, c), or one-way ANOVA (f, h, j) coupled to Fisher’s least significant difference (LSD) post hoc test. Source data are provided as a Source Data file.
Fig. 2
Fig. 2. Myofiber-specific ablation of FNIP1 promotes the formation of patent, functional blood vessels.
a Representative hindlimbs from Fnip1f/f and FNIP1 MKO mice at the age of 8 weeks. b Volcano plot showing fold changes versus P values for analyzed RNA-seq data generated from the GC muscles of 8-week-old male FNIP1 MKO mice compared with Fnip1f/f littermate controls. Significantly upregulated genes are represented by red dots, whereas downregulated genes are represented by blue dots. c GO enrichment analysis (“Biological Process_Direct” term) of gene transcripts upregulated in FNIP1 MKO muscle. d Representative images of CD31 immunofluorescent (green) and microsphere perfused (red) images in GC muscles from 14-week-old Fnip1f/f and FNIP1 MKO mice. Scale bar, 100 µm. e Quantification of capillaries per mm2 in (d). n = 6 biologically independent mice per group. P value: 0.0001, <0.0001. f Representative confocal images of immunostainings of CD31 (green) and PDGFRβ (red) co-staining in Fnip1f/f and FNIP1 MKO GC muscles. Scale bar, 100 µm. g Pearson’s correlation of pericyte density (PDGFRβ) and Capillary density (CD31). P value: <0.0001. h The ratio of PDGFRβ+/CD31+ in Fnip1f/f and FNIP1 MKO GC muscles. n = 7 biologically independent mice per group. i Representative confocal images of immunostainings of CD31 (green) and NG2 (red) co-staining in Fnip1f/f and FNIP1 MKO GC muscles. Scale bar, 100 µm. j Pearson’s correlation of pericyte density (NG2) and Capillary density (CD31). P value: <0.0001. k The ratio of NG2+/CD31+ in Fnip1f/f and FNIP1 MKO GC muscles. n = 9 biologically independent mice per group. l Representative laser Doppler images of 14-week-old Fnip1f/f and FNIP1 MKO mice. m Quantification of hindlimb microcirculation blood perfusion, in perfusion unit (PU). Fnip1f/f, n = 7; FNIP1 MKO, n = 8 biologically independent mice. P value: 0.0004. All data are shown as the mean ± SEM. ***P < 0.001 vs. corresponding Fnip1f/f controls, determined by two-tailed unpaired Student’s t test, except in (g, j) where two-tailed Pearson correlation was used. Source data are provided as a Source Data file.
Fig. 3
Fig. 3. AMPK-independent regulation of muscle angiogenesis by FNIP1.
a Representative white vastus lateralis (WV), GC and soleus muscles from indicated mice at the age of 8 weeks. b Schematic of identification of AMPK-dependent and -independent genes regulated by FNIP1 with the cutoff criteria of a fold change greater than 1.5 (either direction) and a cutoff significant level of P < 0.05. c GO enrichment analysis (“Biological Process_Direct” term) of AMPK-independent gene transcripts regulated by FNIP1. d Expression of genes (qRT-PCR) associated with angiogenesis in GC muscles from the indicated genotypes. n = 5 biologically independent mice per group. *P value: 0.0003, 0.0016, 0.0007, 0.0012, 0.0024, <0.0001, 0.0007, <0.0001, 0.0001, 0.0011, 0.0043. #P value: 0.0106. e Representative images of CD31 immunofluorescent (green) and microsphere perfused (red) images in GC muscles from 8-week-old Fnip1+/+, Fnip1−/− and Fnip1−/−, AMPKα1/α2f/f/Myf5-Cre mice. Scale bar, 100 µm. n = 6 (CD31) and n = 4 (microsphere) biologically independent mice per group. f Representative images of immunostainings of CD31 (green) and PDGFRβ (red) co-staining, CD31 (green) and NG2 (red) co-staining in GC muscles from indicated mice. Scale bar, 100 µm. n = 6 biologically independent mice per group. g Quantification of capillaries and pericytes per mm2 in (e, f). n = 6 biologically independent mice per group, P value: <0.0001, <0.0001, 0.0004, 0.0007, <0.0001, <0.0001, <0.0001, <0.0001. All data are shown as the mean ± SEM. **P < 0.01, ***P < 0.001 vs. corresponding Fnip1+/+ controls, #P < 0.05 vs. Fnip1−/−, determined by one-way ANOVA coupled to Fisher’s least significant difference (LSD) post hoc test. Source data are provided as a Source Data file.
Fig. 4
Fig. 4. Myofiber FNIP1 regulates muscle angiogenesis through macrophage recruitment.
a Representative images and quantification of F4/80 immunofluorescent staining in GC muscles from 14-week-old mice. Scale bar, 100 µm. n = 7 biologically independent mice. P value: <0.0001. b Expression of macrophage activation genes (qRT-PCR) in GC muscles. n = 8 biologically independent mice. P value: 0.0049, 0.0047, 0.0001, <0.0001, 0.008, 0.026, 0.0165, 0.0002. c Representative images and quantification of M1 macrophage (CD80) (green) and F4/80 (magenta) co-staining in 8-week-old mice GC muscles. n = 6 biologically independent mice. Scale bar, 100 µm. P value: 0.0024. d Representative images and quantification of M2 macrophage (CD206) (green) and F4/80 (magenta) co-staining in GC muscles. n = 6 biologically independent mice. Scale bar, 100 µm. P value: <0.0001. e Schematic showing adeno-associated virus (AAV9) Cre-mediated FNIP1 deletion in muscle. f Representative images and quantification of F4/80 and CD31 immunofluorescent staining in muscles from Fnip1f/f mice injected with AAV9-Cre or control viruses. Scale bar, 100 µm. n = 7 (F4/80) and n = 9 (CD31) biologically independent mice. P value: <0.0001, <0.0001. g Expression of macrophage activation genes in muscles. n = 5 biologically independent mice. P value: 0.0214, 0.0005, <0.0001, 0.0021, 0.0342. h Schematic illustrating the liposome-encapsulated clodronate treatment in the presence of AAV9-Cre-mediated FNIP1 ablation in 8-week-old mice. i qRT-PCR analysis of mRNA levels in muscles. AAV-GFP, n = 7, AAV-Cre and AAV-Cre+Clod, n = 4 biologically independent mice. P value: <0.0001, <0.0001, 0.0011. #P value: 0.007. j, k Representative images ( j) and quantification (k) of F4/80, CD31 and PDGFRβ immunofluorescent staining in muscles. Scale bar, 100 µm. AAV-GFP, n = 8, AAV-Cre and AAV-Cre+Clod, n = 5 biologically independent mice. *P value: <0.0001, <0.0001, <0.0001. #P value: <0.0001, <0.0001, <0.0001. All data are shown as the mean ± SEM. *P < 0.05, **P < 0.01, ***P < 0.001 vs. corresponding controls, ##P < 0.01, ###P < 0.001 vs. AAV9-Cre, determined by two-tailed unpaired Student’s t test (ad, f, g) or one-way ANOVA (i, k) coupled to Fisher’s least significant difference (LSD) post hoc test. Source data are provided as a Source Data file.
Fig. 5
Fig. 5. Muscle FNIP1 deficiency induces PGC-1α to activate chemokine gene expression and macrophage recruitment.
a GO enrichment analysis (KEGG pathway) of gene transcripts upregulated in FNIP1 MKO muscle, with the top eight terms shown, which is ranked by P value (one-sided Fisher’s exact test). b Heatmap analysis of chemokine genes regulated in FNIP1 MKO muscle compared with Fnip1f/f controls. n = 2 independent samples per group. Color scheme for fold change is provided. c Expression of genes (qRT-PCR) involved in Chemokine signaling pathway in GC muscles from the 14-week-old indicated genotypes. n = 7 biologically independent mice per group. P value: 0.0004, 0.0015, 0.0215, 0.0052, 0.0012, <0.0001. d Genome browser tracks of RNA-seq data were visualized in IGV. e Western blot analysis of PGC-1α from the indicated mice. Quantification of the PGC-1α/Tubulin signal ratios were normalized (=1.0) to Fnip1f/f controls. n = 3 biologically independent mice per group. P value: 0.0117. f The schematics show the location of the putative conserved nuclear receptor recognition half site (AGGTCA) relative to the Ccl8 and Cxcl13 gene transcription start site (+1). g PGC-1α and ERRβ synergistically activate Cxcl13 gene promoter. The mouse Cxcl13.Luc.4.7k promoter reporter was used in co-transfection studies in HEK293 cells in the presence of expression vectors indicated. Values represent mean (± SEM) firefly/renilla luciferase activity shown as arbitrary units (arb. units) normalized (=1.0) to vector control. n = 3 independent experiments. P value: 0.0012. All data are shown as the mean ± SEM. *P < 0.05, **P < 0.01, ***P < 0.001 vs. corresponding Fnip1f/f or Vector controls, determined by two-tailed unpaired Student’s t test (c, e), or one-way ANOVA (g) coupled to Fisher’s least significant difference (LSD) post hoc test. Source data are provided as a Source Data file.
Fig. 6
Fig. 6. FNIP1-dependent regulation of macrophage recruitment and muscle angiogenesis by PGC-1α.
a Genome browser tracks of RNA-seq data were visualized in IGV. b Representative images and quantification of F4/80 immunofluorescent staining in TA muscles from 10-week-old mice. Scale bar, 100 µm. n = 6 biologically independent mice. P value: <0.0001. c, d Expression of genes (qRT-PCR) involved in macrophage activation (c) and chemokine signaling pathway (d) in GC muscles from 10-week-old mice. n = 5 biologically independent mice. c *P value: 0.0006, 0.0004, <0.0001, <0.0001, <0.0001, 0.0001, 0.0004; #P value: 0.0052, 0.0009, <0.0001, <0.0001, 0.0003. d *P value: 0.0005, <0.0001, 0.0063, 0.006, 0.0005, 0.0043, 0.0058. #P value: 0.0088, 0.0071, 0.0067, 0.0165, 0.0095. e Representative WV, GC and soleus muscles from 8-week-old mice. n = 3 biologically independent mice. f Identification of PGC-1α-dependent and -independent genes regulated by FNIP1 with the cutoff fold change greater than 1.5 and a cutoff significant level of P < 0.05. g GO enrichment analysis (“Biological Process_Direct” term) of PGC-1α-dependent gene transcripts regulated by FNIP1. h, i Representative images (h) and quantification (i) of CD31 immunofluorescent (green) and microsphere perfused (red) images in GC muscles of 8-week-old mice. Scale bar, 100 µm. CD31, Fnip1+/+, n = 7; Fnip1−/−, n = 8; Fnip1−/−,PGC-1αf/f/MCK-Cre, n = 7 biologically independent mice; microsphere, n = 4 biologically independent mice. *P value: <0.0001. #P value: <0.0001. j, k Representative confocal images (j) and quantification (k) of CD31 (green) and PDGFRβ (red), CD31 (green) and NG2 (red) co-staining in GC muscles from 8-week-old mice. Scale bar, 100 µm. n = 6 biologically independent mice. *P value: <0.0001. #P < 0.0001. All data are shown as the mean ± SEM. **P < 0.01, ***P < 0.001 vs. corresponding Fnip1+/+ controls, #P < 0.05, ##P < 0.01, ###P < 0.001 versus FNIP1 KO, determined by one-way ANOVA coupled to Fisher’s least significant difference (LSD) post hoc test. Source data are provided as a Source Data file.
Fig. 7
Fig. 7. Deletion of myofiber FNIP1 enhances hindlimb ischemia (HLI)-induced revascularization.
af Unilateral hindlimb ischemia was applied to both FNIP1 MKO and Fnip1f/f littermate mice at the age of 14 weeks, and macrophage recruitment and neoangiogenesis were assessed on day 16 after the induction of hindlimb ischemia in both the contralateral and ischemic muscles. a Representative images of F4/80 immunofluorescent staining in GC muscles from indicated mice. Scale bar, 100 µm. Quantification of F4/80-positive macrophages per mm2. Fnip1f/f, n = 4; FNIP1 MKO, n = 6 biologically independent mice per group. *P value: 0.0027. #P value: <0.0001. b Expression of macrophage activation genes (qRT-PCR) in GC muscles from the indicated mice. Fnip1f/f, n = 4; FNIP1 MKO, n = 6 biologically independent mice per group. *P value: 0.0074, 0.0195, 0.0252, 0.0092. #P value: 0.0009, 0.0379, 0.0089, 0.0017. ce Representative confocal images of CD31 (green) and NG2 (red), CD31 (green) and PDGFRβ (red) co-staining in GC muscles from the 14-week-old indicated mice. Fnip1f/f, n = 4; FNIP1 MKO, n = 6 biologically independent mice per group. f Quantification of capillaries and pericytes per mm2. Fnip1f/f, n = 4; FNIP1 MKO, n = 6 biologically independent mice per group. *P value: 0.049, 0.046, 0.0162. #P value: <0.0001, <0.0001, <0.0001. g Representative laser Doppler images of 14-week-old Fnip1f/f and FNIP1 MKO mice at the indicated times after hindlimb ischemia surgery. Fnip1f/f, n = 4; FNIP1 MKO, n = 5 biologically independent mice. h Quantification of blood flow in the ischemic limbs of Fnip1f/f and FNIP1 MKO mice at the indicated times. Fnip1f/f, n = 4; FNIP1 MKO, n = 5 biologically independent mice. *P value: 0.0346, 0.0003, 0.0007, <0.0001, <0.0001. All data are shown as the mean ± SEM. *P < 0.05, **P < 0.01, ***P < 0.001 vs. contralateral, #P < 0.05, ##P < 0.01, ###P < 0.001 vs. corresponding Fnip1f/f controls, determined by one-way (a, b, f) or two-way (h) ANOVA coupled to Fisher’s least significant difference (LSD) post hoc test. Source data are provided as a Source Data file.
Fig. 8
Fig. 8. Model of FNIP1-dependent regulation of skeletal muscle functional revascularization from ischemia.
The schematic depicts the proposed model for the orchestration of skeletal muscle functional revascularization by myofiber FNIP1.

References

    1. Hirsch AT, et al. ACC/AHA 2005 practice guidelines for the management of patients with peripheral arterial disease (lower extremity, renal, mesenteric, and abdominal aortic) Circulation. 2006;113:e463–e654. doi: 10.1161/CIRCULATIONAHA.106.174526. - DOI - PubMed
    1. Gregg EW, et al. Changes in diabetes-related complications in the United States, 1990–2010. New Engl. J. Med. 2014;370:1514–1523. doi: 10.1056/NEJMoa1310799. - DOI - PubMed
    1. Schanzer A, Conte MS. Critical limb ischemia. Curr. Treat. Options Cardiovasc. Med. 2010;12:214–229. doi: 10.1007/s11936-010-0076-7. - DOI - PMC - PubMed
    1. Bonaca MP, Hamburg NM, Creager MA. Contemporary medical management of peripheral artery disease. Circ. Res. 2021;128:1868–1884. doi: 10.1161/CIRCRESAHA.121.318258. - DOI - PubMed
    1. Le Couteur DG, Lakatta EG. A vascular theory of aging. J. Gerontol. Ser. A. 2010;65A:1025–1027. doi: 10.1093/gerona/glq135. - DOI - PubMed

Publication types

LinkOut - more resources