. 2023 Nov 6;14(1):7113.
doi: 10.1038/s41467-023-42737-x.

30×30 biodiversity gains rely on national coordination

Affiliations

30×30 biodiversity gains rely on national coordination

Isaac Eckert et al. Nat Commun. .

Erratum in

Abstract

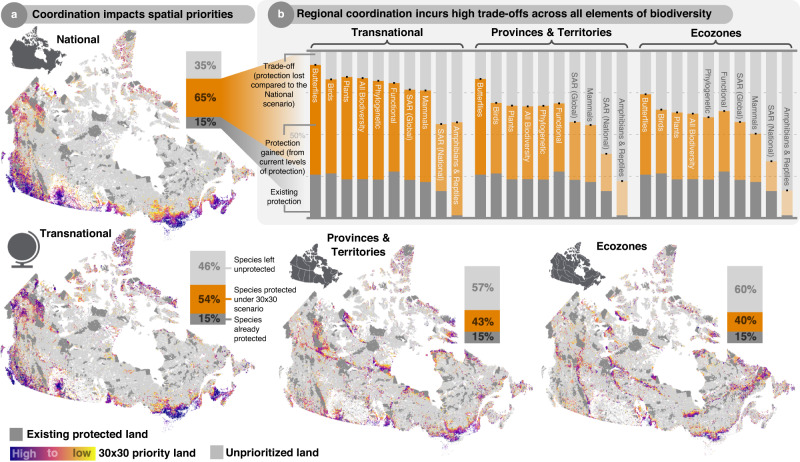
Global commitments to protect 30% of land by 2030 present an opportunity to combat the biodiversity crisis, but reducing extinction risk will depend on where countries expand protection. Here, we explore a range of 30×30 conservation scenarios that vary what dimension of biodiversity is prioritized (taxonomic groups, species-at-risk, biodiversity facets) and how protection is coordinated (transnational, national, or regional approaches) to test which decisions influence our ability to capture biodiversity in spatial planning. Using Canada as a model nation, we evaluate how well each scenario captures biodiversity using scalable indicators while accounting for climate change, data bias, and uncertainty. We find that only 15% of all terrestrial vertebrates, plants, and butterflies (representing only 6.6% of species-at-risk) are adequately represented in existing protected land. However, a nationally coordinated approach to 30×30 could protect 65% of all species representing 40% of all species-at-risk. How protection is coordinated has the largest impact, with regional approaches protecting up to 38% fewer species and 65% fewer species-at-risk, while the choice of biodiversity incurs much smaller trade-offs. These results demonstrate the potential of 30×30 while highlighting the critical importance of biodiversity-informed national strategies.


Conflict of interest statement

The authors declare no competing interests.

Figures

Fig. 1
Fig. 1. Conceptual workflow of methods.
We used spatial prioritization to test whether prioritizing different dimensions of biodiversity versus prioritizing at different spatial scales matters more for 30×30 biodiversity outcomes. First, we build species distribution models to project the current and future ranges of all Canadian terrestrial vertebrates, plants, and butterflies. To incorporate climate change, we down-weighted future projections to account for uncertainty and to prioritize “win-win” areas of overlap between current and future ranges. Next, we designed 30×30 expansion scenarios that vary what dimension of biodiversity (i.e., taxa, species at-risk, facets) is prioritized as well as how protection is coordinated spatially. Finally, to evaluate spatial prioritization scenarios, we quantify both the amount of biodiversity captured using weighted endemism as well as the number of species protected based on a modified Species Protection Index (SPI), where a species is considered protected when it reaches or exceeds its species-specific conservation target.
Fig. 2
Fig. 2. Changing the spatial scale at which protection is coordinated impacts spatial priorities and biodiversity gains.
a Spatial priorities for the optimal National scenario as well as the Transnational, Provinces & Territories, and Ecozones scenarios are highlighted in color based on their priority rank. b These shifting spatial priorities incurred high trade-offs across all elements of biodiversity. Trade-offs represent the loss of potential protection from the optimal national scenario. Trade-offs are calculated as the percentage difference between the amount of protection achieved by the alternative scenario and the amount of protection possible under the National scenario. For example, if the National scenario protects 80 species but the alternative scenario only protects 40 species, then the trade-off is −50% since the alternative scenario protects half as many species.
Fig. 3
Fig. 3. Unbalanced regional responsibilities for protecting national biodiversity.
National coordination optimally protects Canadian biodiversity at large but relies on highly uneven regional commitment across Provinces and Territories (a) and Ecozones (b). Provinces and Territories and Ecozones are colored based on the portion of land included in the national 30 × 30 high priorities.
Fig. 4
Fig. 4. Variation in spatial priorities across scenarios.
a Areas important for single or multiple priorities. Cells are colored based on their representation in the top 30% of cells across scenarios (All = present in all 13 scenarios, Most = present in at least seven scenarios, Some = present in less than 7, No = present in no scenarios). Bars represent the corresponding percent of land area, percent of total biodiversity, and percent of nationally listed at-risk biodiversity that is protected based on weighted endemism with each grouping of scenarios. b Correlations of the spatial overlap of each scenario where scenario pairs are colored based on the strength of Pearson correlation. For all cases, Pearson correlation tests produced significant p values (<0.05).
Fig. 5
Fig. 5. Regional scenarios identify unique and dissimilar spatial priorities.
Comparison of scenarios that vary what taxa is prioritized versus how protection is coordinated across space by visualizing differences in: a nonmetric multidimensional space (k = 2, stress = 0.09) and b spatial overlap. In both panels, scenarios are represented by symbols indicating what was prioritized or how protection was coordinated. Colors represent land present in both taxa (i.e., Birds, Mammals, etc.) and coordination (i.e., National, Global, etc.) scenarios, only taxa, only coordination, or no scenarios. NMDS axes are visualized in Supplementary Fig. 2.

References

    1. Carroll C, Noss RF. How percentage‐protected targets can support positive biodiversity outcomes. Conserv. Biol. 2022;36:e13869. doi: 10.1111/cobi.13869. - DOI - PMC - PubMed
    1. Maxwell SL, et al. Area-based conservation in the twenty-first century. Nature. 2020;586:217–227. doi: 10.1038/s41586-020-2773-z. - DOI - PubMed
    1. Dobrowski SZ, et al. Protected-area targets could be undermined by climate change-driven shifts in ecoregions and biomes. Commun. Earth Environ. 2021;2:198. doi: 10.1038/s43247-021-00270-z. - DOI
    1. Jenkins CN, Van Houtan KS, Pimm SL, Sexton JO. US protected lands mismatch biodiversity priorities. Proc. Natl Acad. Sci. USA. 2015;112:5081–5086. doi: 10.1073/pnas.1418034112. - DOI - PMC - PubMed
    1. Jenkins CN, Pimm SL, Joppa LN. Global patterns of terrestrial vertebrate diversity and conservation. Proc. Natl Acad. Sci. USA. 2013;110:E2602–10. doi: 10.1073/pnas.1302251110. - DOI - PMC - PubMed

Publication types