. 2023 Dec;20(12):1900-1908.
doi: 10.1038/s41592-023-02053-0. Epub 2023 Nov 6.

Genetically encoded multimeric tags for subcellular protein localization in cryo-EM

Affiliations

Genetically encoded multimeric tags for subcellular protein localization in cryo-EM

Herman K H Fung et al. Nat Methods. 2023 Dec.

Abstract

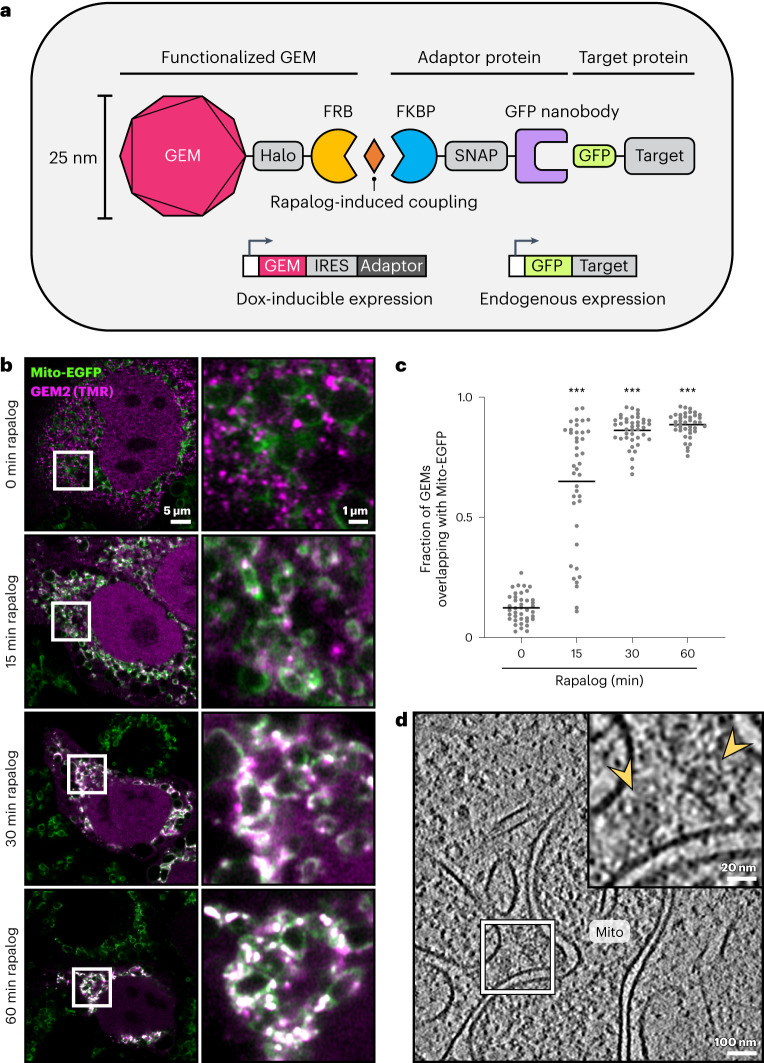
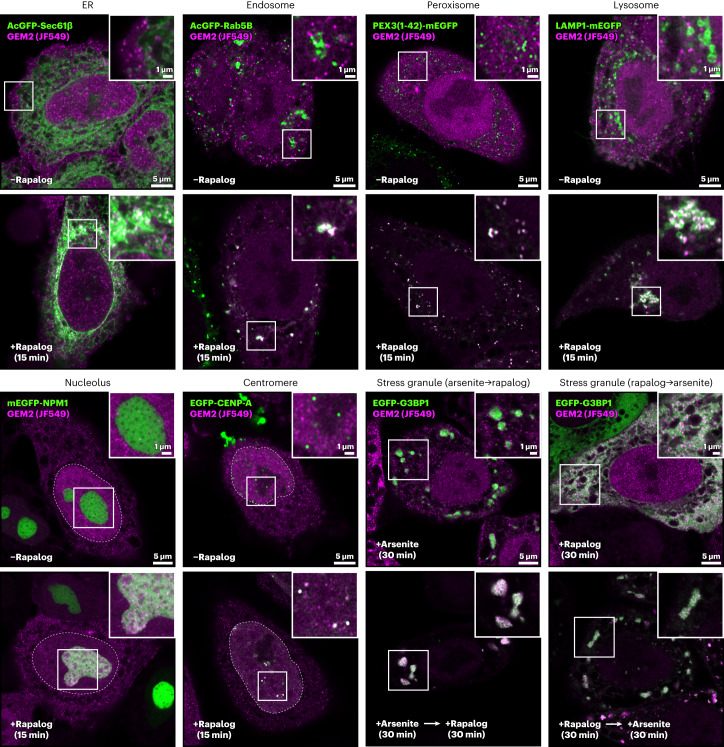
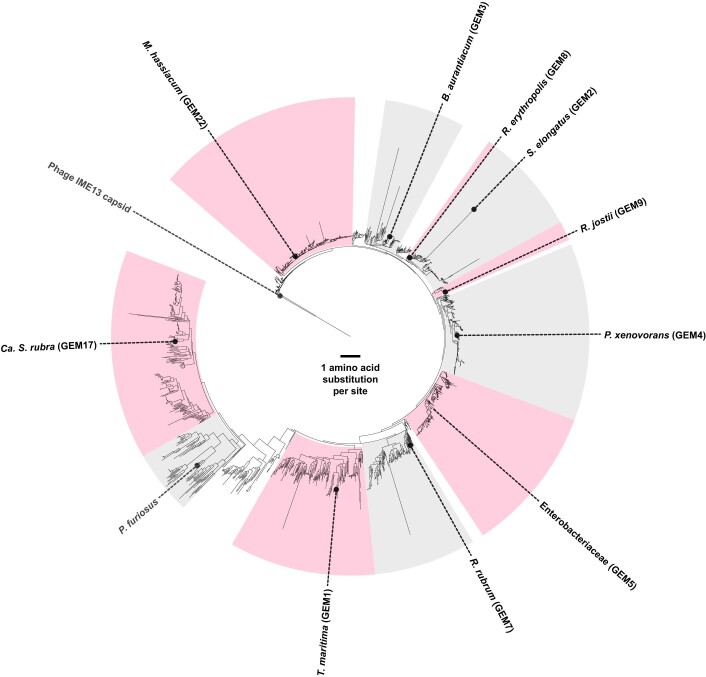
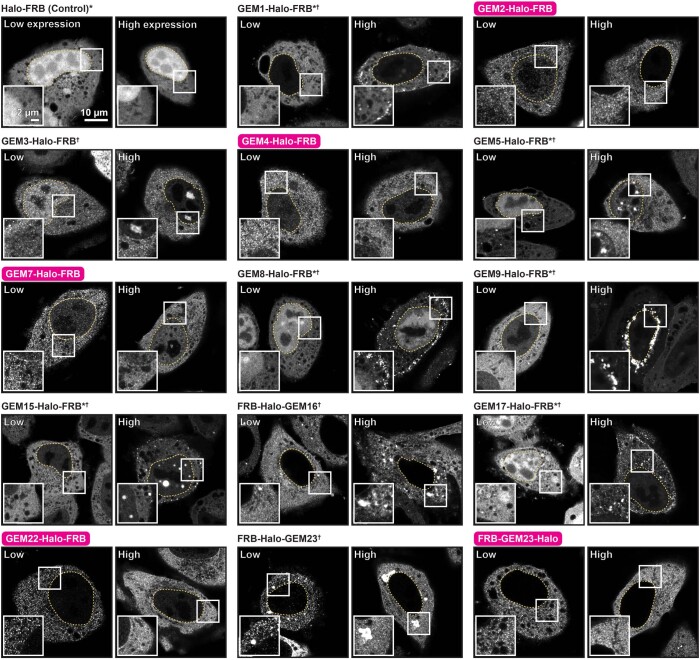
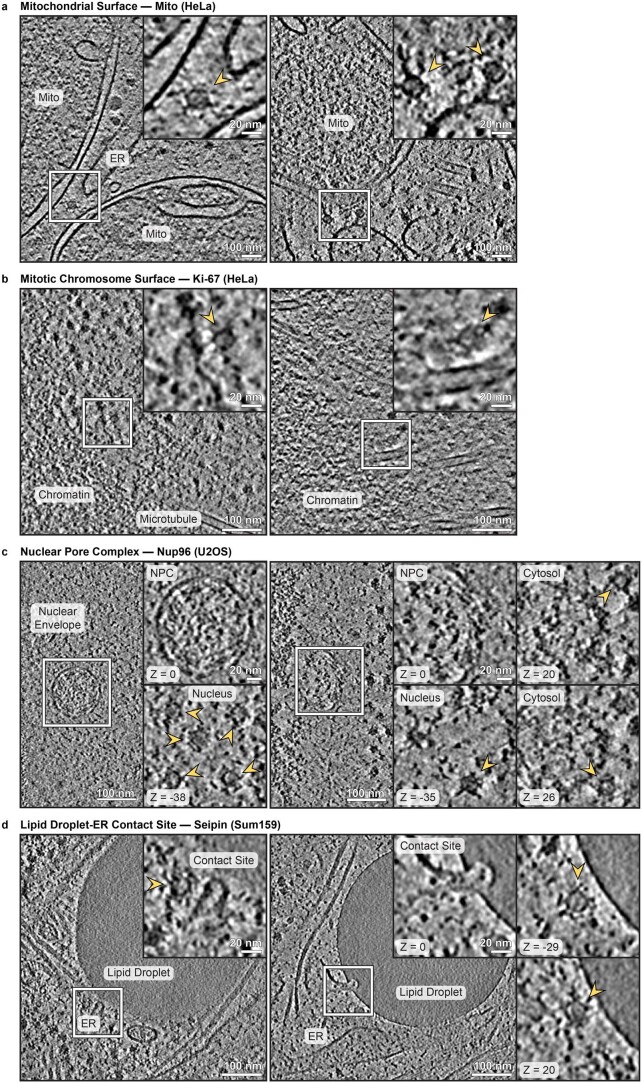
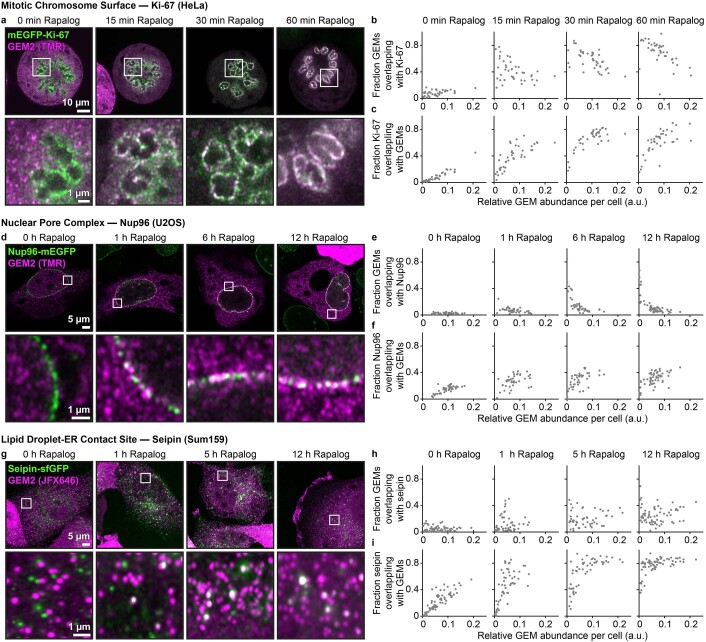
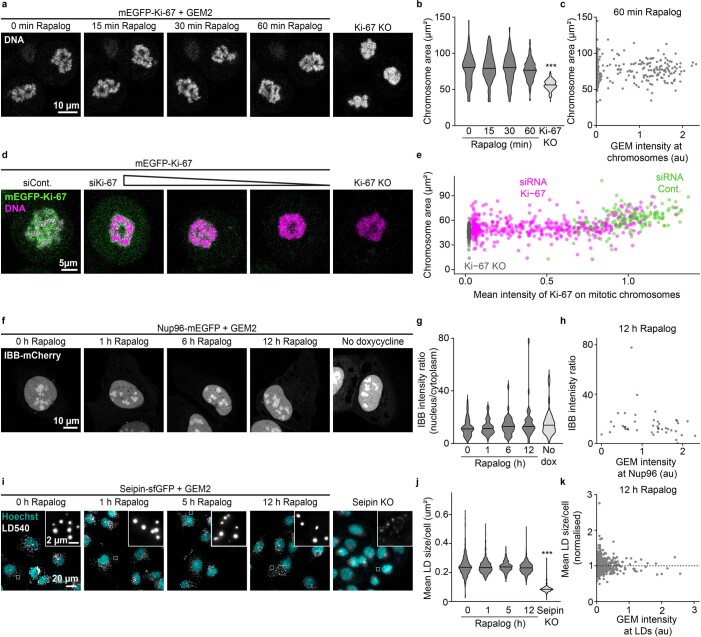
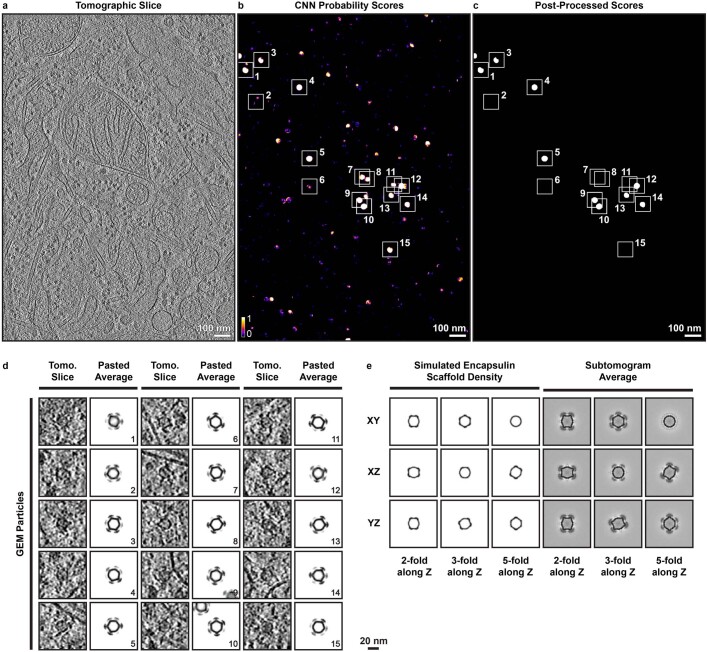
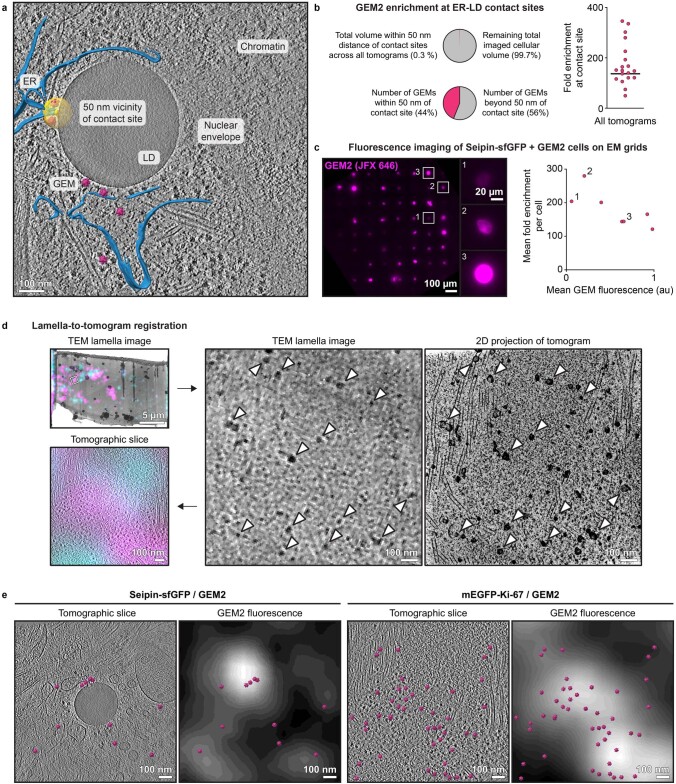
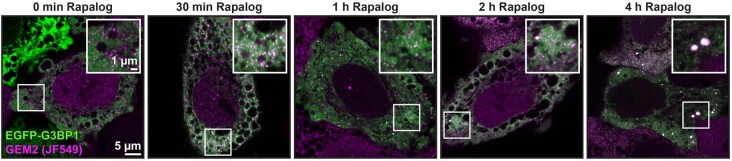
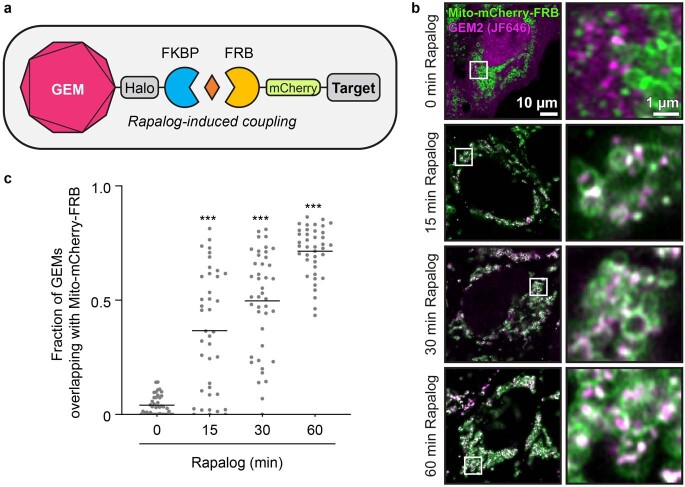
Cryo-electron tomography (cryo-ET) allows for label-free high-resolution imaging of macromolecular assemblies in their native cellular context. However, the localization of macromolecules of interest in tomographic volumes can be challenging. Here we present a ligand-inducible labeling strategy for intracellular proteins based on fluorescent, 25-nm-sized, genetically encoded multimeric particles (GEMs). The particles exhibit recognizable structural signatures, enabling their automated detection in cryo-ET data by convolutional neural networks. The coupling of GEMs to green fluorescent protein-tagged macromolecules of interest is triggered by addition of a small-molecule ligand, allowing for time-controlled labeling to minimize disturbance to native protein function. We demonstrate the applicability of GEMs for subcellular-level localization of endogenous and overexpressed proteins across different organelles in human cells using cryo-correlative fluorescence and cryo-ET imaging. We describe means for quantifying labeling specificity and efficiency, and for systematic optimization for rare and abundant protein targets, with emphasis on assessing the potential effects of labeling on protein function.


Conflict of interest statement

The authors declare no competing interests.

Figures

Fig. 1
Fig. 1. GEM2 labeling of mitochondrial surface-displayed EGFP in human cells.
a, Schematic of the labeling system. b, Time course of GEM2 (fluorescently labeled with TMR, magenta) recruitment to Mito-EGFP (green) upon rapalog treatment by fluorescence microscopy in HeLa cells. GEM2 and adaptor protein were expressed from the AAVS1 locus (stable knock-in) with 24–48 h doxycycline induction before rapalog treatment. c, Quantification of b, showing the fraction of GEMs overlapping with Mito-EGFP per cell. Lines indicate mean, n (left to right) = 40, 40, 41, 40 cells, two experiments. ***P < 0.0001, Kruskall–Wallis test followed by Dunn’s test, compared to 0 min. d, Tomographic slice showing a GEM2-labeled mitochondrion after 30 min rapalog treatment. Arrowheads in the inset indicate GEM2 particles. Source data
Fig. 2
Fig. 2. GEM2 labels endogenously GFP-tagged proteins in human cells.
ad, Ki-67. eh, Nup96. il, seipin. Left to right: fluorescence images (a,e,i), arrowheads in enlarged insets indicate examples of colocalization between GEM2 and the target protein. Tomographic slices (b,f,j), arrowheads in enlarged insets indicate GEM particles. The corresponding rapalog treatment time is indicated for each image. GEM2 and adaptor protein were expressed from the AAVS1 locus for Ki-67 and seipin, and transiently expressed for Nup96, by doxycycline treatment for 24–48 h before rapalog treatment. Plotted are the fractions of GEMs overlapping with the target proteins (c,g,k), and target proteins overlapping with GEMs for the same cells (d,h,l), evaluated by light microscopy. Lines indicate the mean. Number of cells analyzed per group: n = 41, 41, 40, 39 (Ki-67; c,d), n = 41, 41, 44, 58 (Nup96; g,h) and n = 76, 56, 53, 64 (seipin; k,l), two experiments. **P = 0.0005. ***P < 0.0001, Kruskall–Wallis test followed by Dunn’s test, compared to 0 h rapalog treatment. m, Target protein abundance by FCS-calibrated imaging. Representative image slices colored by calibrated protein numbers. Dashed lines indicate cell boundaries. n, Analysis of total cellular protein abundances as determined by FCS-calibrated imaging (m) combined with 3D segmentation. Number of cells analyzed per target protein: n = 92 (mito-EGFP), 148 (Ki-67), 86 (Nup96), 118 (seipin), two experiments. Lines indicate mean. o, Fraction of GEMs overlapping with the target at 1 h rapalog treatment as a function of target protein abundance (median and interquartile range) for each target. Analysis of c, g, k and n, number of cells and experiments as indicated above. Source data
Fig. 3
Fig. 3. CNN-based detection of GEM-labeled proteins.
a, Tomographic slices of GEM2-labeled Mito-EGFP on mitochondria (top, also Supplementary Video 3) and seipin-sfGFP near an ER-LD contact site (bottom). Magenta, GEM2 subtomogram averages pasted into the tomogram for visualization; green, mitochondria; blue, ER; yellow, ER-LD contact site. Insets show individual GEMs or ribosomes and corresponding CNN probability scores for each particle. b, GEM2 subtomogram average superposed with the structure of the encapsulin scaffold (bottom, PDB 6X8M), with one pentamer represented in magenta. c, Spatial distributions of GEMs relative to the outer mitochondrial membrane (top) and ER-LD contact site (bottom) per tomogram, n = 123 and 91 GEMs from 17 and 19 tomograms, respectively. Lines indicate mean and s.d. in the right panels. Pie charts indicate the proportion of GEMs within 50 nm of the target subcellular structure (magenta). Source data
Fig. 4
Fig. 4. On-lamella CLEM-assisted localization of GEM2 labeling.
a, Localization of GEM2-labeled seipin. The left shows a TEM image of an FIB lamella superposed with cryo-Airyscan fluorescence, registered via LD signals in the reflected light image of the lamella, in the same view as the tomographic slice and segmentation shown on the right. Colocalizing GEM2 (magenta) and seipin-sfGFP (green) fluorescence signals indicate the location of GEM2-labeled seipin. In the inset, a white box indicates the area of cryo-ET data acquisition. The middle shows a tomographic slice from the indicated area. The right shows the segmentation of mitochondria (green), ER (blue) and LD (yellow). Ribosomes (gray) and GEMs (magenta) are represented by subtomogram averages pasted into the tomogram according to their refined poses. Insets show a closer view of the GEM-decorated ER-LD contact site (arrowheads in middle inset indicate GEMs), and viewed from a different orientation in the right inset. b, Localization of GEM2 on the EGFP-Ki-67-coated mitotic chromosome periphery. The left shows the TEM lamella image, superposed with cryo-Airyscan fluorescence, in the same view as the tomographic slice and segmentation shown on the right. In the middle, the inset shows a closer view of two GEM particles (arrowheads) close to the chromatin periphery. The right shows segmentations of microtubules (blue). Ribosomes (gray) and GEMs (magenta) are represented by subtomogram averages pasted into the tomogram.
Fig. 5
Fig. 5. GEM2 labeling of GFP-tagged proteins specific to different compartments in human cells.
GFP-tagged proteins were overexpressed in HeLa cells with a GEM2/adaptor AAVS1 knock-in. Cells were cultured for 48 h after transfection of GFP-tagged protein plasmids. Rapalog treatment times are indicated for each target. For G3BP1, GEM2 labeling was induced before or after induction of stress granule formation via arsenite treatment. These are representative images, and the experiment was performed twice with similar results.
Extended Data Fig. 1
Extended Data Fig. 1. Phylogenetic diversity of selected encapsulins.
Maximum likelihood tree of Family 1 encapsulins as identified and constructed by Andreas et al., with Family 2 A encapsulin Synechococcus elongatus SrpI (GEM2) and Stenotrophomonas phage IME13 capsid protein (outgroup). Scale bar represents amino acid substitution per site. Indicated encapsulins, with GEM IDs in brackets, have been shown to form 25-nm-sized T = 1 particles, detailed in Supplementary Table 1. GEM1 has been engineered with heavy-metal-chelating elements and surface nanobodies (EMcapsulin) for room-temperature EM localization. Also indicated is the T = 3 particle-forming encapsulin of Pyrococcus furiosus, previously used in budding yeast and HEK293 cells as a rheology probe. Clades are shaded in alternating colours up to the most recent common ancestor between annotated sequences.
Extended Data Fig. 2
Extended Data Fig. 2. GEM-Halo-FRB fusion expression screen.
Constructs were transiently expressed in HeLa cells under a cytomegalovirus (CMV) promoter and labeled with Halo-TMR. The transfections resulted in a range of GEM expression levels. Boxed labels in pink indicate constructs that give rise to predominantly uniformly sized fluorescent puncta. Asterisks indicate constructs with soluble protein localisation. Daggers indicate aggregation, which was more prominent at high expression levels for some constructs. Dashed lines mark the cell nucleus based on Hoechst staining imaged in a separate channel. Low expression examples are displayed with identical contrast settings with respect to one another. High expression examples from the same experiment, defined here as cells with five times brighter fluorescence, are displayed with identical contrast settings. Representative images, experiment performed twice with similar results.
Extended Data Fig. 3
Extended Data Fig. 3. Mito-EGFP GEM coupling screen.
HeLa cells stably expressing Mito-EGFP were transiently transfected with a, GEM2/adaptor; b, GEM4/adaptor; c, GEM7/adaptor; d, GEM22/adaptor; or e, GEM23/adaptor. Upon 24 h doxycycline induction, GEMs and adaptor proteins were labelled with Halo-TMR and SNAP-SiR, respectively. Cells were treated with rapalog for indicated time points. f, Fraction of GEMs overlapping with Mito-EGFP per cell. Lines indicate mean. Number of cells analysed per group (left to right): n = 52, 42, 46, 38, 41, 42, 32, 37, 41, 39, 46, 41, 33, 40, 40, 3 experiments. ***P < 0.0001, Kruskall-Wallis test followed by Dunn’s test, compared to 0 min treatment. g, GEM2 fluorescence recovery after photobleaching (FRAP) assay. Fluorescence images of GEMs in HeLa cells stably expressing Mito-EGFP with GEM2/adaptor knock-in before and after photobleaching, in the absence of rapalog. GEMs were labelled with TMR. Dashed circle indicates the photobleached region. h, GEM2 fluorescence recovery curves. Magenta indicates mean (solid line) ± s.d. (shaded area). Single-exponential curves were fitted to individual recovery curves with t1/2, I0, and I1 representing the recovery half-life, normalised intensity immediately post-bleach, and the dynamic range of recovery, respectively. Analysis of g, n = 90 cells, 3 experiments. Source data
Extended Data Fig. 4
Extended Data Fig. 4. Additional examples of GEM2 localisation at the subcellular targets by cryo-ET.
a, Overexpressed Mito-EGFP. b, Endogenous Ki-67. c, Endogenous Nup96. d, Endogenous seipin. Each example is taken from a different cell. Arrowheads indicate GEM particles in enlarged insets. Particles labelling the same structure on different z-slices are shown for Nup96 and seipin. Slice numbers indicated are in steps of 1.37 nm for Nup96 and 1.35 nm for seipin, respectively. At some nuclear pore complexes (NPCs), GEMs are observed near both cytoplasmic and nuclear rings, where Nup96 localises.
Extended Data Fig. 5
Extended Data Fig. 5. GEM2 recruitment dynamics is dependent on its abundance.
a, d, g, Time course of GEM2 recruitment to endogenous Ki-67, Nup96 and seipin. GEM2 and adaptor expression from the AAVS1 locus was induced with 24–48 h doxycycline treatment prior to rapalog treatment for the indicated durations. Image for seipin at 5 h is the same as in Fig. 2i, but rotated and with a larger field of view shown. b, Fractions of GEMs overlapping with the target as a function of relative GEM abundance, defined as the number of GEM-positive pixels divided by total cellular area per cell. Replotting of data presented in Fig. 2c. Lower GEM abundance gave rise to a higher fraction of GEMs at the target protein. c, Fractions of the target overlapping with GEMs as a function of relative GEM abundance per cell. Replotting of data presented in Fig. 2d. Longer rapalog treatment times increased labelling of Ki-67 by GEMs. Higher GEM abundance led to more complete coverage of Ki-67. These results demonstrate the importance of tuning GEM expression levels in the labelling experiment. e, Replotting of data in Fig. 2g. f, Replotting of data in Fig. 2h. h, Replotting of data in Fig. 2k. i, Replotting of data in Fig. 2l. Source data
Extended Data Fig. 6
Extended Data Fig. 6. GEM2 recruitment to endogenous Ki-67, Nup96 and seipin has little effect on cellular phenotype.
a, Mitotic chromosomes (stained with SiR-DNA) after induction of Ki-67 GEM-labelling with rapalog treatment for the indicated time. Ki-67 knock-out (KO) cells serve as a control for aberrant mitotic chromosome coalescence upon Ki-67 impairment. b, Mitotic chromosome area measurements in GEM-expressing cells, n = 139, 154, 158, 165, 188 cells per treatment (left to right), 2 experiments. Lines indicate median. ***P < 0.0001, Kruskall-Wallis test followed by Dunn’s test, compared to 0 h treatment. c, Chromosome area at 60 min treatment as a function of mean GEM fluorescence intensity at chromosomes, n = 255 cells, 2 experiments. d, Mitotic chromosomes (DNA, magenta) and endogenous mEGFP-Ki-67 signal (green) upon transfection with control siRNA (siCont.) and Ki-67 siRNA (siKi-67) in comparison with Ki-67 KO cells. Cells were transfected with 0.05–5 pmol siRNAs for partial knockdown. e, Chromosome area as a function of mean mEGFP-Ki-67 fluorescence intensity on chromosomes. n = 156 (siRNA Cont.), 459 (siRNA Ki-67), 150 (Ki-67 KO) cells, 2 experiments. f, Importin β binding domain (IBB)-mCherry localization after induction of Nup96 GEM-labelling for the indicated time. Non-doxycycline-induced cells, thus not expressing GEM or adaptor protein, were included as a control. Impairment of nuclear pore integrity results in redistribution of IBB to the cytoplasm. g, IBB-mCherry intensity ratio (nucleus/cytoplasm), n = 41, 40, 42, 42, 39 cells per treatment (left to right), 2 experiments. Lines indicate median. h, IBB-mCherry intensity ratio at 12 h rapalog treatment time as a function of total GEM intensity on Nup96 in the same cells. i, Lipid droplets (LDs, stained with LD540) after induction of seipin GEM-labelling for the indicated time. Cells were treated with oleic acid during the final hour of rapalog treatment to induce LD biogenesis. Seipin KO cells serve as a control for mean LD size reduction upon seipin impairment. Contrast is adjusted in insets for comparison with small LDs of seipin KO cells. j, Mean LD size per cell, n = 594, 610, 639, 738, 335 cells per treatment (left to right), 2 experiments. Lines indicate median. ***P < 0.0001, Kruskall-Wallis test followed by Dunn’s test, compared to 0 h treatment. k, Mean LD size at 12 h rapalog treatment time as a function of mean GEM intensity at LDs in the same cells. Dashed line indicates the mean LD size of control cells. Source data
Extended Data Fig. 7
Extended Data Fig. 7. CNN detection and validation of GEM2 particles.
a, Full view of the tomographic slice from Fig. 3a. b, Maximum projection of raw CNN probability scores. c, Maximum projection of post-processed CNN probability scores. Scores were thresholded at 0.5, filtered by size (connected-component size cluster of 5000–50000 pixels at 13.7 Å/pixel), and masked with a lamella mask to exclude false positives. This tomogram was not used for CNN training. Numbered boxes correspond to curated particles, shown in d. d, Left columns, tomographic slices at the indicated positions in b and c, 6.74 nm in thickness. Right columns, slices through the thresholded subtomogram average pasted in the tomogram based on the refined position and orientation. Of the 15 particles, 9 corresponded to peaks in the post-processed scores, and 6 more (2, 6, 7, 8, 11, 15) were annotated based on visual inspection of lower scoring peaks. e, Left, cross-sections of simulated densities at 30 Å resolution based on the in vitro structure of the encapsulin scaffold (PDB 6X8M). Right, cross-sections of the GEM2 subtomogram average presented in Fig. 3b.
Extended Data Fig. 8
Extended Data Fig. 8. CLEM-based assessment and optimization of GEM2 labelling.
a, Full view of the tomographic slice from Fig. 3a. Yellow region indicates an ER-LD contact site dilated in all directions by 50 nm and masked with the lamella mask. Lamella masks were defined geometrically based on cross-sections at the front and back of the lamella per tomogram. b, Volumetric analysis of GEM enrichment at ER-LD contact sites by cryo-ET. Scatter plot shows the fold enrichment of GEMs at contact sites per tomogram. Bar represents the overall enrichment calculated from summed volumes. Corresponding numerical data are provided in Supplementary Table 2. n = 19 tomograms from 7 cells, 5 experiments. c, Selection of cells for cryo-ET based on GEM2 fluorescence. Maximum intensity projection image of seipin-sfGFP cells expressing GEM2 on a grid, treated with rapalog for 10 h, oleic acid for 1 h, and imaged by widefield microscopy before freezing. Insets show three cells with varying GEM2 levels, from which cryo-ET data were collected. Right, mean fold enrichment of GEMs at ER-LD contact sites per cell as a function of total GEM fluorescence as imaged before freezing. Each dot represents a cell. Numbers indicate cells highlighted in fluorescence image on the left. d, Registration of tomogram with lamella image via surface ice contaminants (arrowheads). On-lamella fluorescence signals are transformed based on the calculated affine transform. e, Annotated GEM2 particles compared with registered fluorescence in tomograms of seipin-sfGFP and mEGFP-Ki-67 cells. Poorly colocalising GEM fluorescence could arise from a combination of low objective numerical aperture, optical aberrations, image drift during acquisition, artefacts in Airyscan processing, sample distortion during handling or imaging, and registration errors. Source data
Extended Data Fig. 9
Extended Data Fig. 9. Clustering of cytosolic G3BP1 during prolonged GEM labelling.
HeLa cells with GEM2/adaptor AAVS1 knock-in were cultured 48 h after transfection of EGFP-G3BP1 plasmid. GEM2 and adaptor expression from the AAVS1 locus was induced by 24 h doxycycline treatment. Cells were treated with rapalog for the indicated times under non-stress conditions. Formation of GEM2-EGFP-G3BP1 clusters in the cytoplasm are apparent at 4 h. Two experiments were performed with similar results.
Extended Data Fig. 10
Extended Data Fig. 10. Nanobody-free GEM2 labelling system.
a, Schematic of the system. b, HeLa cells with doxycycline-inducible GEM2-Halo-FKBP and Mito-mCherry-FRB AAVS1 knock-in were treated with rapalog for the indicated times. c, Analysis of b. Lines indicate mean, n = 41, 40, 42, 40 cells per treatment (left to right), 2 experiments. ***P < 0.0001, Kruskall-Wallis test followed by Dunn’s test, compared to 0 h rapalog treatment. Source data

References

    1. van den Hoek H, et al. In situ architecture of the ciliary base reveals the stepwise assembly of intraflagellar transport trains. Science. 2022;377:543–548. - PubMed
    1. Wozny MR, et al. In situ architecture of the ER–mitochondria encounter structure. Nature. 2023;618:188–192. - PMC - PubMed
    1. Zhang X, et al. Molecular mechanisms of stress-induced reactivation in mumps virus condensates. Cell. 2023;186:1877–1894.e27. - PMC - PubMed
    1. Zimmerli CE, et al. Nuclear pores dilate and constrict in cellulo. Science. 2021;374:eabd9776. - PubMed
    1. O’Reilly FJ, et al. In-cell architecture of an actively transcribing-translating expressome. Science. 2020;369:554–557. - PMC - PubMed