. 2023 Nov 6;13(1):19191.
doi: 10.1038/s41598-023-46760-2.

Accurate exclusion of kidney regions affected by susceptibility artifact in blood oxygenation level-dependent (BOLD) images using deep-learning-based segmentation

Affiliations

Accurate exclusion of kidney regions affected by susceptibility artifact in blood oxygenation level-dependent (BOLD) images using deep-learning-based segmentation

Chang Ni et al. Sci Rep. .

Abstract

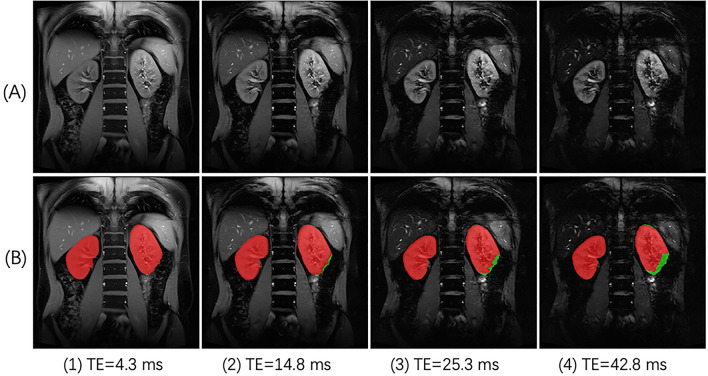
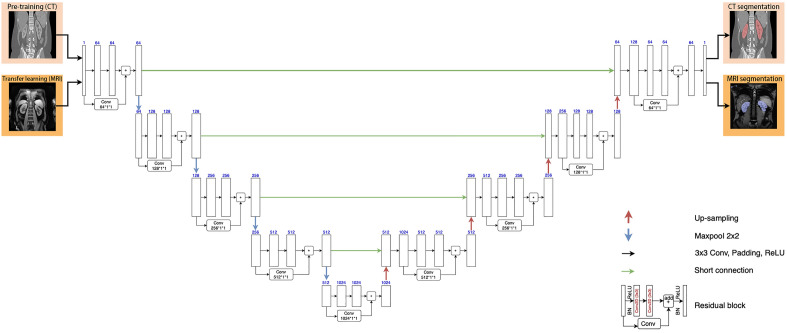
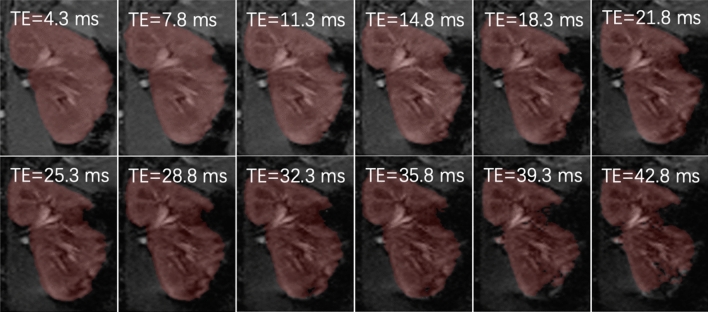
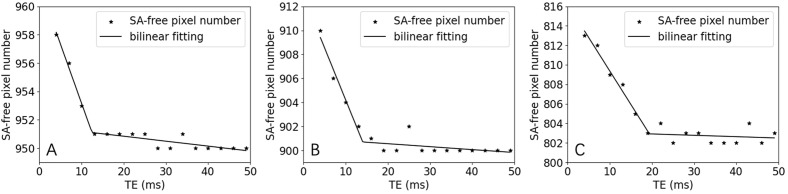
Susceptibility artifact (SA) is common in renal blood oxygenation level-dependent (BOLD) images, and including the SA-affected region could induce much error in renal oxygenation quantification. In this paper, we propose to exclude kidney regions affected by SA in gradient echo images with different echo times (TE), based on a deep-learning segmentation approach. For kidney segmentation, a ResUNet was trained with 4000 CT images and then tuned with 60 BOLD images. Verified by a Monte Carlo simulation, the presence of SA leads to a bilinear pattern for the segmented area of kidney as function of TE, and the segmented kidney in the image of turning point's TE would exclude SA-affected regions. To evaluate the accuracy of excluding SA-affected regions, we compared the SA-free segmentations by the proposed method against manual segmentation by an experienced user for BOLD images of 35 subjects, and found DICE of 93.9% ± 3.4%. For 10 kidneys with severe SA, the DICE was 94.5% ± 1.7%, for 14 with moderate SA, 92.8% ± 4.7%, and for 46 with mild or no SA, 94.3% ± 3.8%. For the three sub-groups of kidneys, correction of SA led to a decrease of R2* of 8.5 ± 2.8, 4.7 ± 1.8, and 1.6 ± 0.9 s-1, respectively. In conclusion, the proposed method is capable of segmenting kidneys in BOLD images and at the same time excluding SA-affected region in a fully automatic way, therefore can potentially improve both speed and accuracy of the quantification procedure of renal BOLD data.


Conflict of interest statement

The authors declare no competing interests.

Figures

Figure 1
Figure 1
An example of renal BOLD images affected by susceptibility artifact (SA). (A) BOLD images acquired with TE of different values. The dimming region expanded from the lower lobe of the left kidney. (B) ROIs of the kidneys for further analysis were manually delineated as red masks, and SA-affected regions were also determined and shown as green masks.
Figure 2
Figure 2
The ResUNet model architecture consisted of an encoder pathway (the left side) and a decoder pathway (the right side), each containing 4 blocks of down-sampling or up-sampling coupled with residual learning. Pre-training was done with CT data (top row of images), followed by fine-tuning all the layers with a small set of MRI images (second row of images).
Figure 3
Figure 3
An example of segmenting multi-gradient-echo images of kidney using the proposed method of ResUNet and transfer learning. The segmented mask in red captured the kidney region as its signal decayed with TE and excluded the expanding SA-affected region.
Figure 4
Figure 4
Representative examples of simulated classified number of SA-free pixels versus TE curves for different fractions of SA-affected pixels, and their bilinear fitting. (A) SA-affected fraction of 5%, or 950 SA-free pixels; (B) SA-affected fraction of 10%, or 900 SA-free pixels; (C) SA-affected fraction of 10%, or 800 SA-free pixels.
Figure 5
Figure 5
A representative example of application of the proposed method to a human kidney BOLD data. (A) The segmented kidney area versus TE curve with bilinear fitting; area affected by SA was 17.6%, and the relative RMS of the bilinear fitting was 0.42%. (B) The image with TE of 25.3 ms (estimated turning point), with overlayed mask (in red). (C) The image with TE of 43.8 ms (the longest TE for the acquired set of images), with overlayed mask (in red). In the lower-right lobe, signal decay made the kidney tissue non-differentiable from the background.

References

    1. Prasad PV, Edelman RR, Epstein FH. Noninvasive evaluation of intrarenal oxygenation with BOLD MRI. Circulation. 1996;94:3271–3275. doi: 10.1161/01.CIR.94.12.3271. - DOI - PubMed
    1. Prasad PV, Chen Q, Goldfarb JW, Epstein FH, Edelman RR. Breath-hold R2* mapping with a multiple gradient-recalled echo sequence: Application to the evaluation of intrarenal oxygenation. J. Magn. Reson. Imaging. 1997;7:1163–1165. doi: 10.1002/jmri.1880070633. - DOI - PubMed
    1. Friedrich MG, Niendorf T, Schulz-Menger J, Gross CM, Dietz R. Blood oxygen level-dependent magnetic resonance imaging in patients with stress-induced angina. Circulation. 2003;108:2219–2223. doi: 10.1161/01.CIR.0000095271.08248.EA. - DOI - PubMed
    1. Prasad PV. Functional MRI of the kidney: Tools for translational studies of pathophysiology of renal disease. Am. J. Physiol. Renal Physiol. 2006;290:F958–F974. doi: 10.1152/ajprenal.00114.2005. - DOI - PMC - PubMed
    1. Yin W-J, et al. Noninvasive evaluation of renal oxygenation in diabetic nephropathy by BOLD-MRI. Eur. J. Radiol. 2012;81:1426–1431. doi: 10.1016/j.ejrad.2011.03.045. - DOI - PubMed

Publication types