. 2023 Dec;30(12):1878-1892.
doi: 10.1038/s41594-023-01117-1. Epub 2023 Nov 6.

CRISPR-Cas9-based functional interrogation of unconventional translatome reveals human cancer dependency on cryptic non-canonical open reading frames

Affiliations

CRISPR-Cas9-based functional interrogation of unconventional translatome reveals human cancer dependency on cryptic non-canonical open reading frames

Caishang Zheng et al. Nat Struct Mol Biol. 2023 Dec.

Abstract

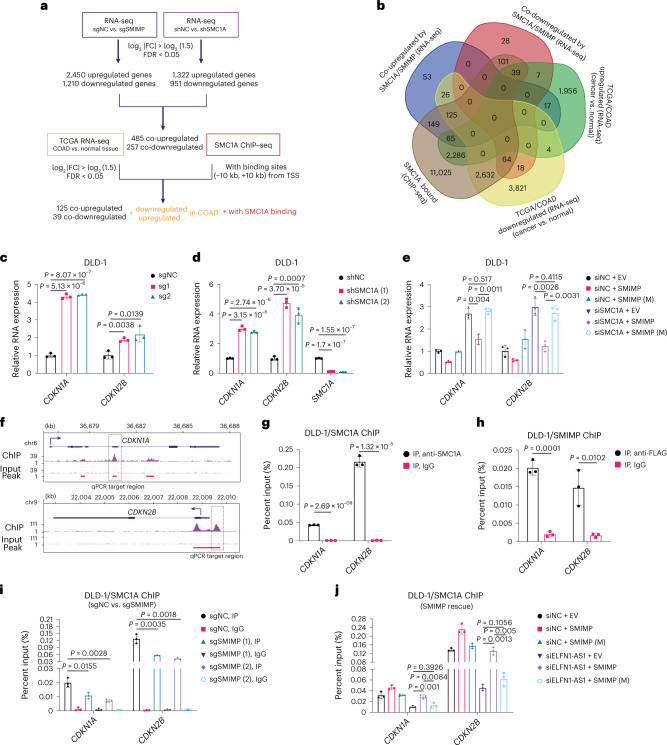
Emerging evidence suggests that cryptic translation beyond the annotated translatome produces proteins with developmental or physiological functions. However, functions of cryptic non-canonical open reading frames (ORFs) in cancer remain largely unknown. To fill this gap and systematically identify colorectal cancer (CRC) dependency on non-canonical ORFs, we apply an integrative multiomic strategy, combining ribosome profiling and a CRISPR-Cas9 knockout screen with large-scale analysis of molecular and clinical data. Many such ORFs are upregulated in CRC compared to normal tissues and are associated with clinically relevant molecular subtypes. We confirm the in vivo tumor-promoting function of the microprotein SMIMP, encoded by a primate-specific, long noncoding RNA, the expression of which is associated with poor prognosis in CRC, is low in normal tissues and is specifically elevated in CRC and several other cancer types. Mechanistically, SMIMP interacts with the ATPase-forming domains of SMC1A, the core subunit of the cohesin complex, and facilitates SMC1A binding to cis-regulatory elements to promote epigenetic repression of the tumor-suppressive cell cycle regulators encoded by CDKN1A and CDKN2B. Thus, our study reveals a cryptic microprotein as an important component of cohesin-mediated gene regulation and suggests that the 'dark' proteome, encoded by cryptic non-canonical ORFs, may contain potential therapeutic or diagnostic targets.


Conflict of interest statement

The authors declare no competing interests.

Figures

Fig. 1
Fig. 1. Identification of CRC dependency on cryptic ORFs.
a, Schema depicting the integrative strategy for identifying CRC dependency on cryptic ORFs. MOI, multiplicity of infection; puro, puromycin. b, Scatterplot showing the statistical significance (−log10 (P value)) and the magnitude of change (log2 (fold change)) between day 21 and day 0 for the representative negatively selected sgRNA of the corresponding ORFs. P values were determined by the Wald test implemented in DESeq2 (Methods). ORFs with zero, at least one and at least two significantly depleted sgRNA species are colored in gray (no depletion), blue (depletion) and red (significant depletion), respectively. After controlling for the potential effect on neighboring genes (Methods), ORFs that had at least two significantly depleted sgRNA species and that were upregulated in COAD compared with normal colon tissue were selected as the final hits. c, Heatmap showing row-wise Z-score-normalized average expression of the identified cryptic non-canonical ORFs in four major CRC molecular subtypes (CMS1–CMS4) and the CRC tumors that do not fall into CMS1–CMS4 (other), based on TCGA data. d, The expression of ELFN1-AS1 and AC012363.4 in CRC adenocarcinoma (TCGA-COAD), READ (TCGA-READ), the corresponding normal tissues of COAD and READ in TCGA and different types of normal tissues in GTEx. The first and third quartiles are depicted by the bottom and top edges of the box, respectively. The median is indicated by the line that divides the box into two sections. Extending from the box, the whiskers illustrate the range between the bottom 5% and 25%, as well as the top 25% and 5%. Any outliers are displayed as individual points. The sample size is indicated after each tumor or normal tissue type. TPM, transcripts per million.
Fig. 2
Fig. 2. Validation of two ORF hits encoded by ELFN1-AS1 and AC012363.4.
a, Ribo-seq count profiles across the transcripts encoding ORFs of ELFN1-AS1 and AC012363.4. b, ORFs of ELFN1-AS1 and AC012363.4 were ectopically expressed with FLAG tag in 293FT and HCT-116 cells, and their expression was detected by western blot with an anti-FLAG antibody. EV, empty vector. c, Comparison between expression of the ORFs of ELFN1-AS1 and AC012363.4 expressed with FLAG tag in the presence of the native 5′ UTR, with the wild-type (ATG) start codon versus the mutant one (AGG) in HCT-116 cells, by western blot. df, Growth of HCT-116 cells transduced with the negative-control EV, the complementary DNA (cDNA) overexpression vectors of the ORFs of ELFN1-AS1 and AC012363.4 (d) or the negative-control sgRNA (sgNC) or gene-specific sgRNA species (sg1 and sg2) targeting the ORFs of ELFN1-AS1 (e) and AC012363.4 (f) was monitored with the Cell Counting Kit-8 (CCK-8) assay. The absorbance at 450 nm (A450) of WST-8 formazan was measured each day for 4 d. gi, Representative pictures of clonogenic growth and bar graphs quantifying the colonies formed by HCT-116 cells that were transduced with the EV control, the cDNA overexpression vector of individual ORFs (g) or the sgNC or sgRNA species targeting individual ORFs (h,i). Western blot data and pictures of clonogenic growth are representative of at least three independent experiments. Data in di are shown as mean ± s.d. (n = 3). P values were determined by an unpaired two-tailed Student’s t-test. Source data
Fig. 3
Fig. 3. ELFN1-AS1 encodes a microprotein upregulated in CRC tumors.
a, In the presence or absence of the native 5′ UTR, FLAG-tagged SMIMP or the mutant one (AGG mutation in the start codon) was stably expressed in HCT-116, DLD-1 and HT-29 cells, and protein expression was determined by western blot with anti-FLAG and anti-SMIMP antibodies. b, Endogenous SMIMP expression was determined by western blot in the indicated CRC cancer cell lines transduced with negative-control sgRNA or sgRNA species targeting SMIMP; β-tubulin was used as a loading control. c, All constituent peptides of SMIMP that were identified by MS from IP of FLAG-tagged proteins in HCT-116 cells stably expressing FLAG-tagged SMIMP in the presence of the native 5′ UTR and MS2 spectral evidence for two of these peptides, LGSSLLSFTPR and NLHQPPLR. d, MS2 spectra of the SMIMP-derived tryptic peptide LGSSLLSFTPR (top) and the corresponding heavy isotope-labeled peptide (bottom) detected by PRM-MS in a mixture of heavy isotope-labeled synthetic peptide and immunoprecipitated endogenously expressed SMIMP from the HCT-116 cell lysate. e,f, The top three ranked PRM-MS transition ion spectra of the SMIMP-derived tryptic peptide LGSSLLSFTPR (top) and the corresponding spike-in heavy isotope-labeled peptide (bottom) detected in a mixture of spike-in heavy isotope-labeled peptide and immunoprecipitated endogenously expressed SMIMP from HCT-116 cell (e) and CRC tumor tissue (f) (Supplementary Table 3) lysate. [R], heavy isotope-labeled arginine. g, Western blot showing endogenous SMIMP expression in CRL-1831 and seven different CRC cell lines with an anti-SMIMP antibody; β-tubulin was used as a loading control. h, Western blot showing SMIMP expression in CRC tumor tissues and matched normal tissues (n = 5; Supplementary Table 3) with an anti-SMIMP antibody; β-actin was used as a loading control. Western blot data are representative of at least three independent experiments. Source data
Fig. 4
Fig. 4. SMIMP exerts a tumor-promoting function.
a,b, Rescue experiments for the cell growth defect caused by siRNA-mediated ELFN1-AS1 depletion in HCT-116 (a) and DLD-1 (b) cells. HCT-116/DLD-1 cells stably transduced to express SMIMP with a wild-type (ATG) or mutant (AGG) start codon or transduced with the empty vector (EV) control were transfected with negative-control siRNA (siNC) or siRNA species targeting ELFN1-AS1 (siELFN1-AS1) outside the CDS region and were cultured for 4 d. Cell growth was monitored each day with the CCK-8 assay. c,d, Rescue experiments for the clonogenic growth defect caused by siRNA-mediated ELFN1-AS1 depletion in HCT-116 (c) and DLD-1 (d) cells. Representative pictures of clonogenic growth and bar graphs quantifying the colonies formed by HCT-116 and DLD-1 cells transduced to express SMIMP with a wild-type or mutant (AGG) start codon or transduced with the EV control that were transfected with siNC or siELFN1-AS1. e, Endogenous expression of SMIMP in xenograft tumors derived from HCT-116 and DLD-1 cells transduced with negative-control sgRNA (sgNC) or SMIMP-targeting sgRNA species (sg1 and sg2) was determined by western blot. f, Volumes of the xenograft tumors derived from HCT-116 cells stably expressing the indicated sgRNA species (n = 7 for each group) were monitored every 3 d for a total of 30 d. Tumor volumes were calculated as indicated in the Methods. g,h, On day 30, the tumors were removed. Tumor weights (g) were measured, and images (h) were obtained. ik, Volumes (i), weights (j) and images (k) were similarly obtained or measured for the xenograft tumors derived from DLD-1 cells stably expressing the indicated sgRNA species (n = 7 for each group). Except for the xenograft experiments (n = 7), when applicable, data are shown as mean ± s.d. (n = 3). P values were determined by an unpaired two-tailed Student’s t-test. Source data
Fig. 5
Fig. 5. SMIMP interacts with SMC1A.
a, The proteins interacting with SMIMP were identified using AP–MS. Silver staining showing proteins enriched by co-IP of FLAG-tagged SMIMP (SMIMP–FLAG) compared with the negative control of FLAG-tagged GFP (GFP–FLAG) in HCT-116 cells stably expressing SMIMP–FLAG or GFP–FLAG, respectively. Lane M represents molecular weight marker. b, Whole-cell lysates of HCT-116 and DLD-1 cells stably expressing SMIMP–FLAG or the negative control GFP–FLAG were immunoprecipitated with an anti-FLAG antibody. Co-immunoprecipitated SMC1A was then detected with an anti-SMC1A antibody. c, Whole-cell lysates of HCT-116 and DLD-1 cells stably expressing SMIMP–FLAG were immunoprecipitated with an anti-SMC1A antibody; mouse immunoglobulin G (IgG) was used as a negative control. Co-immunoprecipitated SMIMP–FLAG was then detected with an anti-FLAG antibody. d, Chromatin-bound protein extracts of HCT-116 and DLD-1 cells stably expressing SMIMP–FLAG were immunoprecipitated with an anti-FLAG antibody. Co-immunoprecipitated SMC1A was then detected with an anti-SMC1A antibody. e, Diagram illustrating different domains of full-length SMC1A and a series of truncation mutants generated based on this diagram (S1–S5). f, DNA for hemagglutinin (HA)-tagged wild-type (WT) SMC1A or individual truncation mutants was cotransfected with that for FLAG-tagged SMIMP into HEK293FT cells. Cell lysates were immunoprecipitated with an anti-FLAG antibody and then subjected to immunoblotting analysis. g, Diagram illustrating full-length SMIMP and a series of deletion mutants generated based on this diagram (M1–M12). h, DNA for FLAG-tagged wild-type SMIMP or individual deletion mutants was cotransfected with that for HA-tagged SMC1A into HEK293FT cells. Cell lysates were immunoprecipitated with an anti-FLAG antibody and then subjected to immunoblotting analysis. Western blot data are representative of at least three independent experiments. Source data
Fig. 6
Fig. 6. SMC1A is important for mediating SMIMP function.
a, Box plot showing significantly elevated expression of SMC1A in CRC adenocarcinoma compared with the corresponding normal tissues based on TCGA-COAD (tumors, n = 290; normal tissues, n = 41) and GTEx (n = 287) RNA-seq data. The bottom and top edges of the box represent the first and third quartiles. The median is indicated by the line dividing the box into two parts. The whiskers illustrate the range between the bottom 5% and 25% as well as the top 25% and 5%. Outliers are shown as points. P values were determined by an unpaired two-sample Wilcoxon test. b, SMC1A protein levels in HCT-116 and DLD-1 cells transfected with negative-control siRNA (siNC) or SMC1A-targeting siRNA species (siSMC1A) were determined by western blot. c,d, Growth of HCT-116 (c) and DLD-1 (d) cells transfected with siNC or siSMC1A was monitored with the CCK-8 assay. e,f, Representative pictures of clonogenic growth and bar graphs quantifying the colonies formed by HCT-116 (e) and DLD-1 (f) cells transfected with the siNC or siSMC1A. gj, The rescue effect of ectopic expression of SMC1A or the empty vector (EV) control on the growth defect (g,h) or the colony-formation defect (i,j) caused by sgRNA-mediated SMIMP depletion in HCT-116 and DLD-1 cells. HCT-116 and DLD-1 cells with the EV control or stably expressing SMC1A were transduced with the negative-control sgRNA (sgNC) or individual SMIMP-targeting sgRNA (sgSMIMP). Cell growth was monitored with the CCK-8 assay. Representative pictures of clonogenic growth and bar graphs quantifying the colonies formed by these cells are shown. Western blot data and pictures of clonogenic growth are representative of at least three independent experiments. When applicable, data are shown as mean ± s.d. (n = 3). P values were determined by an unpaired two-tailed Student’s t-test. Source data
Fig. 7
Fig. 7. SMIMP and SMC1A repress tumor-suppressive gene expression.
a, Workflow for identifying the protein-coding genes co-regulated by SMIMP and SMC1A that were potentially important for mediating the function of the SMIMP–SMC1A axis in CRC. FC, fold change. b, Venn diagrams showing overlaps between the protein-coding genes co-regulated by SMIMP and SMC1A based on RNA-seq data, the genes with at least one SMC1A ChIP–seq peak near their TSS (±10 kb) and the genes differentially expressed between cancer and normal tissues based on TCGA-COAD RNA-seq data. c,d, RT–qPCR analysis of CDKN1A and CDKN2B expression in DLD-1 cells following sgRNA-mediated SMIMP knockout (c) or shRNA-mediated SMC1A depletion (d). e, Rescue of CDKN1A and CDKN2B expression following SMC1A knockdown by ectopically expressing wild-type SMIMP or deletion mutant SMIMP (M) (deletion M4) with respect to the empty vector (EV) control. f, Visualization of the SMC1A ChIP–seq signal and peaks includes the signal track of SMC1A ChIP–seq (ChIP), the corresponding input (input) and significant peaks (peak). chr, chromosome. g, ChIP–qPCR analysis was performed with anti-SMC1A or anti-IgG antibodies in DLD-1 cells to validate the binding of SMC1A to the ChIP–seq peaks. h, ChIP–qPCR analysis was performed with anti-FLAG or anti-IgG antibodies in DLD-1 cells stably expressing FLAG-tagged SMIMP to examine the binding of SMIMP to the SMC1A ChIP–seq peaks. i, The occupancy difference of SMC1A on its ChIP–seq peaks was assessed by ChIP–qPCR analysis between DLD-1 cells transduced with SMIMP-targeting sgRNA species (sgSMIMP) and DLD-1 cells transduced with the negative-control sgRNA (sgNC). j, Upon ELFN1-AS1 knockdown, ChIP–qPCR analysis was performed to assess the rescue effect of ectopic expression of wild-type SMIMP or mutant SMIMP (deletion M4), with respect to the EV control, on SMC1A binding to cis-regulatory elements. When applicable, data are shown as mean ± s.d. (n = 3). P values were determined by an unpaired two-tailed Student’s t-test. Source data
Fig. 8
Fig. 8. A tumor-promoting role of SMIMP in esophageal, gastric and ovarian cancer.
a, Bar graph showing expression of ELFN1-AS1 across 33 cancer types in TCGA. Adrenocortical carcinoma (ACC), bladder urothelial carcinoma (BLCA), breast invasive carcinoma (BRCA), cervical squamous cell carcinoma and endocervical adenocarcinoma (CESC), cholangiocarcinoma (CHOL), lymphoid neoplasm diffuse large B-cell lymphoma (DLBC), esophageal carcinoma (ESCA), glioblastoma multiforme (GBM), head and neck squamous cell carcinoma (HNSC), kidney chromophobe (KICH), kidney renal clear cell carcinoma (KIRC), kidney renal papillary cell carcinoma (KIRP), acute myeloid leukemia (LAML), brain lower grade glioma (LGG), liver hepatocellular carcinoma (LIHC), lung adenocarcinoma (LUAD), lung squamous cell carcinoma (LUSC), mesothelioma (MESO), ovarian serous cystadenocarcinoma (OV), pancreatic adenocarcinoma (PAAD), pheochromocytoma and paraganglioma (PCPG), prostate adenocarcinoma (PRAD), rectum adenocarcinoma (READ), sarcoma (SARC), skin cutaneous melanoma (SKCM), stomach adenocarcinoma (STAD), testicular germ cell tumors (TGCT), thymoma (THYM), thyroid carcinoma (THCA), uterine carcinosarcoma (UCS), uterine corpus endometrial carcinoma (UCEC), uveal melanoma (UVM). bd, Box plots showing expression of ELFN1-AS1 in ESCA (b) (tumors, n = 159; normal tissues, n = 11; GTEx samples, n = 591), STAD (c) (tumors, n = 373; normal tissues, n = 31; GTEx samples, n = 163) and OV (d) (tumors, n = 378; GTEx samples, n = 82) based on TCGA and GTEx RNA-seq data. The first and third quartiles are depicted by the bottom and top edges of the box, respectively. The median is indicated by the line that divides the box into two sections. Extending from the box, the whiskers illustrate the range between the bottom 5% and 25% as well as the top 25% and 5%. Any outliers are displayed as individual points. P values were determined by an unpaired two-sample Wilcoxon test. em, The effects of sgRNA-mediated knockout of SMIMP on SMIMP protein expression, the growth phenotype and the colony-forming capability were assessed for esophageal cancer OE33 cells (eg), ovarian cancer SKOV-3 cells (hj) and stomach adenocarcinoma AGS cells (km) that were transduced with individual sgRNA species targeting SMIMP or negative-control sgRNA. Western blot data and pictures of clonogenic growth are representative of at least three independent experiments. When applicable, data are shown as mean ± s.d. (n = 3). P values were determined by an unpaired two-tailed Student’s t-test. Source data
Extended Data Fig. 1
Extended Data Fig. 1. CRISPR/Cas9 screens for identifying CRC dependency on cryptic ORFs.
a, Ribo-seq data quality control. Upper panel: length distribution of the RPFs uniquely mapped to the annotated protein-coding regions. Lower panel: different quality profiles/metrics for RPFs uniquely mapped to the annotated protein-coding regions. Each row shows the RPFs with indicated length. Column 1: RPF count distribution across 3 reading frames across the annotated codons; Column 2: RPF count distribution near the annotated TISs; Column 3: RPF count distribution near the annotated stop codons. b, Scatter plot showing the correlation between ribo-seq replicates. c, Bar graph showing the number of sgRNAs targeting the cryptic ORFs identified from ribo-seq data, and the positive/negative control sgRNAs. d, Bar graph showing the distribution of the number of ORFs in HCT-116 cells over the number of targeting sgRNAs. e, The histograms showing the distribution of log2(Fold-Change) between day 21 and day 0 for sgRNAs targeting the cryptic ORFs (orange) and the positive control genes (blue) in the CRISPR/Cas9 screen. f, The box plot showing the log2(Fold-Change) between day 21 and day 0 for sgRNAs targeting the cryptic ORFs (red) (n = 5,077), the negative controls (green) (n = 1,064) and the positive control genes (blue)(n = 636). The bottom and top edges of the box represent the first and third quartiles. The median is indicated by the line dividing the box into 2 parts. The whiskers illustrate the values between the bottom 5% and 25% or between the top 25% and 5%. Any outliers are displayed as individual points. g, The expression of ELFN1-AS1 and AC012363.4 in the CRC adenocarcinoma (TCGA-COAD), the rectum adenocarcinoma (TCGA-READ), the corresponding normal tissues of COAD and READ in TCGA, and normal tissues with refined tissue types in GTEx. The sample size was indicated after each tumor/normal tissue type.
Extended Data Fig. 2
Extended Data Fig. 2. Characterization of ELFN1-AS1/AC012363.4 encoded ORFs.
a, The FLAG-tagged ORF-ELFN1-AS1/-AC012363 was ectopically expressed in DLD-1 and HT-29 cells and their expressions were detected by western blot with an anti-FLAG antibody. b-d, The comparison of the FLAG-tagged ORF-ELFN1-AS1/-AC012363 expression in the presence/absence of the native 5’UTR, between wild-type and the mutant (AGG start codon) by western blot in (b) HCT-116, (c) DLD-1 and (d) HT-29 cells. e-g, The growth of the DLD-1 cells transduced with (e) the negative control empty vector (EV), the cDNA overexpression vector of ORF-ELFN1-AS1/ORF-AC012363.4, the negative control sgRNA (sgNC), or sgRNAs targeting (f) ORF-ELFN1-AS1 and (g) ORF-AC012363.4, was monitored with CCK-8 assay. The OD450 absorbance for WST-8 formazan was measured each day for 4 days. h-j, The representative pictures of clonogenic growth and the bar graph quantifying the colonies formed by the DLD- 1 cells that were transduced with (h) the EV control, the cDNA overexpression vector of individual ORFs, or (i-j) the sgNC/sgRNAs targeting the individual ORFs, after the cells were cultured for two weeks. k, l, The expression of (k) ELFN1 and (l) EPB41L5 was detected by western blot in the indicated CRC cancer cell lines that were transduced with the sgNC or sgRNAs targeting SMIMP, where β-tubulin was used as a loading control. Western blot data and the pictures of clonogenic growth are representative of at least three independent experiments. When applicable, data are shown as mean + /−standard deviation (SD), n = 3. P-values were determined by an unpaired two-tailed Student’s t-test. Source data
Extended Data Fig. 3
Extended Data Fig. 3. ELFN1-AS1 encodes a microprotein.
a, The gene structure, genomic location of ELFN1-AS1 and the length and sequence of its encoded microprotein. The transcript of ELFN1-AS1 (ENST00000453348.1) encoding SMIMP has two exons and the CDS is in the exon 2. b, Higher ELFN1-AS1 expression was associated with worse COAD patient overall survival based on TCGA data. The Kaplan-Meier survival curves are plotted for three patient groups with high (top 1/3, n = 92), medium (middle 1/3, n = 91), and low (bottom 1/3, n = 92) ELFN1-AS1 expression in COAD tumors. The P-value was calculated based on log-rank test. c, A schematic of PRM-MS validation of the unique peptides derived from SMIMP with the spike-in heavy isotope labeled synthetic peptides. d, The top three ranked PRM-MS transition ions spectra of the SMIMP-derived tryptic peptide LGSSLLSFTPR (left) and the corresponding spike-in heavy isotope-labeled peptide (right) detected in the mixture of spike-in heavy isotope-labeled peptide and immunoprecipitated endogenously expressed SMIMP from DLD-1 cell lysate. e, The MS2 spectra of the SMIMP-derived tryptic peptide NLHQPPLR (top) and the corresponding heavy isotope-labeled peptide (bottom) detected by PRM-MS in the mixture of heavy isotope-labeled peptide and immunoprecipitated endogenously expressed SMIMP from HCT-116 cell lysate. f-h, The top three ranked PRM-MS transition ions spectra of the SMIMP-derived tryptic peptide NLHQPPLR (top) and the corresponding heavy isotope-labeled peptide (bottom) detected in the mixture of spike-in heavy isotope-labeled peptide and immunoprecipitated endogenously expressed SMIMP from the lysate of (f) CRC tumor tissues (Supplementary Table 3), (g) HCT-116 and (h) DLD-1 cells. [R], heavy isotope-labeled Arginine. Source data
Extended Data Fig. 4
Extended Data Fig. 4. Characterizing SMIMP expression in cell lines and tumors, and its function in different cell lines.
a, qRT-PCR analysis of the endogenous RNA expression of ELFN1-AS1 in immortalized colon epithelial cell line, CRL-1831, and 7 different CRC cancer cell lines, where GAPDH was used as an internal control. b, c, (b) The representative images of hematoxylin-stained tumor tissues and normal adjacent tissue (NAT) with the RNAscope in situ hybridization-based staining of ELFN1-AS1 (scale bar 50 µm), and (c) the quantification of the RNAscope-based ELFN1-AS1 expression in tumors and NATs (paired samples n = 32) with H-Score. Data are shown as mean + /−standard deviation (SD). P-value was determined by a paired two-tailed Student’s t-test. d, The endogenous expression of SMIMP was determined in the indicated CRC cancer cell lines that were transduced with the negative control sgRNA (sgNC) or sgRNAs targeting SMIMP (sgSMIMP), where β-tubulin was used as a loading control. Western blot data are representative of at least three independent experiments. e-j, The growth of the (e) CRL-1831, (f) HT-29, (g) SW-480, (h) RKO, (i) LoVo or (j). Caco-2 cells transduced with sgNC or sgSMIMP was monitored with CCK-8 assay. The OD450 absorbance for WST-8 formazan was measured each day for the indicated days. Data in a (n = 3), e(n = 5), f(n = 3), g(n = 4), h(n = 4), i(n = 4) and j(n = 4) are shown as mean + /−standard deviation (SD). P-values were determined by an unpaired two-tailed Student’s t-test. Source data
Extended Data Fig. 5
Extended Data Fig. 5. A tumor-promoting role of SMIMP in vitro and in vivo.
a, The rescue experiments for the cell growth defect caused by siRNA-mediated ELFN1-AS1 depletion in HT-29 cells. The HT-29 cells stably expressing SMIMP that has a wild-type (ATG)/mutant (AGG) start codon or the empty vector control (EV), were transfected with the negative control siRNA (siNC) or siRNAs targeting ELFN1-AS1 (siELFN1-AS1) and were cultured for 4 days. The cell growth was monitored each day with CCK-8 assay. b, The rescue experiments for the clonogenic growth defect caused by siRNA-mediated ELFN1-AS1 depletion in HT-29 cells. The representative pictures of clonogenic growth and the bar graph quantifying the colonies formed by the HT-29 cells expressing SMIMP that has a wild- type/mutant (AGG) start codon or EV, were transfected with siNC or siELFN1-AS1. Pictures of clonogenic growth are representative of at least three independent experiments. Data in a and b are shown as mean + /−standard deviation (SD), n = 3. P-values were determined by an unpaired two-tailed Student’s t-test. c, The volumes of the xenograft tumors derived from HCT-116 cells stably transduced with the indicated shRNAs and expression vectors (n = 8 for each group), were monitored every 4 days for a total of 31 days. The tumor volumes were calculated as indicated in the Methods. d, e, On day 31, the tumors were removed. Their images (d) were collected and their weights (e) were measured. Data in c and e are shown as mean + /−standard deviation (SD), n = 8. P-values were determined by an unpaired two-tailed Student’s t-test. Source data
Extended Data Fig. 6
Extended Data Fig. 6. Characterization of SMIMP-SMC1A interaction.
a, SMC1A expression was detected by western blot in the indicated CRC cancer cell lines that were transduced with the negative control sgRNA (sgNC) or SMIMP-targeting sgRNAs (sgSMIMP). b, The ectopically expressed FLAG-tagged wild-type SMIMP or individual deletion mutants (M1-M12) in HEK293FT cells was detected by western blot. c, The HCT-116 cells were treated with cycloheximide (CHX) at a final concentration of 50 ug/mL for the indicated time intervals, followed by detecting the expression of FLAG-tagged wild-type SMIMP/mutant SMIMP (M) (Del-M4) by western blot. d, The western blotting band intensity of FLAG-tagged SMIMP/SMIMP(M) protein was quantified by densitometry and normalized to β-actin control. The ratios between the normalized intensities at different time points with respect to the time zero were plotted. Data are shown as mean + /−standard deviation (SD), n = 3. P-values were determined by an unpaired two-tailed Student’s t-test. e, f, The His6-MBP-TEVsite-SMC1A1013-1233-StrepII and His6-SMIMP/SMIMP(M)-GST were expressed and purified in E. coli (Methods). The purified His6-MBP-TEVsite-SMC1A1013-1233-StrepII (MBP-SMC1A (1033-1233)) and the SMC1A1013-1233-StrepII (SMC1A (1033-1233)) was detected by (e) coomassie staining and by (f) western blot with an anti-MBP or anti-SMC1A antibody, where the purified MBP tag was used as a control. g, h, The purified His6-SMIMP/SMIMP(M)-GST (SMIMP-GST/SMIMP(M)-GST) was detected by (g) coomassie staining and by (h) western blot with an anti-GST, anti-SMIMP or anti-His antibody, where the purified GST tag was used as a control. i, In vitro GST pull-down experiments (Methods) for detecting the interaction between SMIMP-GST/SMIMP(M)-GST and SMC1A (1033-1233), where the purified recombinant GST served as a negative control. j, In vitro co-IP experiments with anti-MBP antibody (Methods) for detecting the interaction between MBP-SMC1A (1033-1233) and the SMIMP-GST/SMIMP(M)-GST, where the purified MBP served as a negative ontrol. Western blot data are representative of at least three independent experiments. Source data
Extended Data Fig. 7
Extended Data Fig. 7. SMIMP-SMC1A interaction mediates SMIMP function.
a, b, The (a) HCT-116 or (b) DLD-1 cells stably transduced with SMIMP/SMIMP(M), SMC1A or the empty vector control (EV), were transfected with siNC or siRNAs targeting ELFN1-AS1 outside the SMIMP-encoding CDS region (siELFN1-AS1) and were cultured for 4 days. The cell growth was monitored each day with CCK-8 assay. c-e, The (c) representative pictures of clonogenic growth and the (d, e) bar graph quantifying the colonies formed by the HCT-116/DLD-1 cells stably transduced with SMIMP/SMIMP(M), SMC1A or the EV, were transfected with siNC or siELFN1-AS1, after cells were cultured for two weeks. f-i, The effect of overexpressing the wild-type SMIMP or the M4 deletion mutant SMIMP (M) (Del-M4) that loses interaction with SMC1A on the (f, g) growth or (h, i) colony formation of HCT-116 and DLD-1 cells in the presence or absence of siRNA-mediated SMC1A knockdown. The HCT-116/DLD-1 cells stably expressing EV or the indicated ORFs were transfected with the negative control siRNA (siNC) or individual siRNA targeting SMC1A (siSMC1A). The cell growth was monitored with CCK-8 assay. The representative pictures of clonogenic growth and the bar graph quantifying the colonies formed by these cells are shown. Pictures of clonogenic growth are representative of at least three independent experiments. Data in a-b (n-3), e-i (n = 3) and d (n = 4) are shown as mean + /−standard deviation (SD). P-values were determined by an unpaired two-tailed Student’s t-test. Source data
Extended Data Fig. 8
Extended Data Fig. 8. SMIMP/SMC1A inhibits the expression of CDKN1A and CDKN2B.
a, The genome-wide distribution of SMC1A ChIP-seq peaks over different types of genomic regions. b, The top enriched GO biological processes of the 125 protein-coding genes with at least one SMC1A binding site within 10 kb from their transcription start sites, co-repressed by SMIMP/SMC1A and significantly down-regulated in COAD compared with normal colon tissues. c, qRT-qPCR analysis of CDKN1A/ CDKN2B expression in HCT-116 cells that were transduced with sgRNAs targeting SMIMP/the negative control (sgNC). d, qRT-qPCR analysis CDKN1A/CDKN2B/SMC1A expression in HCT-116 cells that were transduced with SMC1A-targeting shRNAs or the negative control shNC. e, In the presence of SMC1A knockdown, the rescue effect of ectopic expression of wild-type SMIMP or deletion mutant SMIMP (M) with respect to the empty vector control (EV), on CDKN1A/CDKN2B expression, was assessed by qRT-PCR analysis in HCT-116 cells. f, ChIP-qPCR analysis was performed with anti-SMC1A/anti-IgG in HCT-116 cells to validate the binding of SMC1A to the ChIP-seq peaks. g, ChIP-qPCR analysis was performed with anti-FLAG/anti-IgG in HCT-116 cells stably expressing the FLAG-tagged SMIMP to examine the binding of SMIMP to the SMC1A ChIP-seq peaks. h, The SMC1A occupancy difference on its ChIP-seq peaks associated with CDKN1A and CDKN2B was assessed by ChIP-qPCR analysis, between the HCT-116 cells transduced with sgRNAs targeting SMIMP and the ones transduced with the negative control sgNC. i, In the presence of ELFN1-AS1 knockdown, ChIP-PCR analysis was performed to assess the rescue effect of ectopic expression of wild-type SMIMP/mutant SMIMP (M) (Del-M4) with respect to the EV control, on the SMC1A binding to the cis-regulatory elements. When applicable, data are shown as mean + /−standard deviation (SD), n = 3. P-values were determined by an unpaired two-tailed Student’s t-test. Source data
Extended Data Fig. 9
Extended Data Fig. 9. SMIMP/SMC1A promotes epigenetic repression.
a, b, ChIP-qPCR analysis was performed in DLD-1 cells with an anti-H3K27me3/anti-IgG antibody to assess the effect of (a) sgRNA-mediated SMIMP knockout or (b) shRNA-mediated SMC1A knockdown on the H3K27me3 signal within the SMC1A binding sites associated with CDKN1A and CDKN2B. c, d, ChIP-qPCR analysis was performed in HCT-116 cells with an anti-H3K27me3/anti-IgG antibody to assess the effect of (c) sgRNA-mediated SMIMP knockout or (d) shRNA-mediated SMC1A knockdown on the H3K27me3 signal within the SMC1A binding sites around CDKN1A and CDKN2B. e, f, ChIP-qPCR analysis was performed in DLD-1 cells with an anti-H3K27ac/anti-IgG antibody to assess the effect of (e) sgRNA-mediated SMIMP knockout or (f) shRNA-mediated SMC1A knockdown on the H3K27ac signal within the SMC1A binding sites associated with CDKN1A and CDKN2B. g, h, ChIP-qPCR analysis was performed in HCT-116 cells with an anti-H3K27ac/anti-IgG antibody to assess the effect of (g) sgRNA-mediated SMIMP knockout or (h) shRNA-mediated SMC1A knockdown on the H3K27ac signal within the SMC1A binding sites associated with CDKN1A and CDKN2B. When applicable, data are shown as mean + /−standard deviation (SD), n = 3. P-values were determined by an unpaired two-tailed Student’s t-test. Source data
Extended Data Fig. 10
Extended Data Fig. 10. SMIMP exerts a growth-promoting function in esophageal, gastric, and ovarian cancer cells.
The effects of sgRNA-mediated knockout of SMIMP on total SMIMP protein expression as well as on cell growth and colony-forming capability, were assessed in the ESCA TE9 cells (a-c), STAD NCI-N87 cells (d-f), and OV OVCAR-4 cells (g-i) that were transduced with individual sgRNAs targeting SMIMP (sgSMIMP) or the negative control sgRNA (sgNC). Western blot data and the pictures of clonogenic growth are representative of at least three independent experiments. Data in b, c, e, f, h (n = 3) and i (n = 4) are shown as mean + /−standard deviation (SD). P-values were determined by an unpaired two-tailed Student’s t-test. Source data

References

    1. The ENCODE Project Consortium An integrated encyclopedia of DNA elements in the human genome. Nature. 2012;489:57–74. doi: 10.1038/nature11247. - DOI - PMC - PubMed
    1. Djebali S, et al. Landscape of transcription in human cells. Nature. 2012;489:101–108. doi: 10.1038/nature11233. - DOI - PMC - PubMed
    1. Ingolia NT, Ghaemmaghami S, Newman JR, Weissman JS. Genome-wide analysis in vivo of translation with nucleotide resolution using ribosome profiling. Science. 2009;324:218–223. doi: 10.1126/science.1168978. - DOI - PMC - PubMed
    1. Lee S, et al. Global mapping of translation initiation sites in mammalian cells at single-nucleotide resolution. Proc. Natl Acad. Sci. USA. 2012;109:E2424–E2432. doi: 10.1073/pnas.1207846109. - DOI - PMC - PubMed
    1. Ingolia NT, et al. Ribosome profiling reveals pervasive translation outside of annotated protein-coding genes. Cell Rep. 2014;8:1365–1379. doi: 10.1016/j.celrep.2014.07.045. - DOI - PMC - PubMed