. 2023 Nov;25(11):1704-1715.
doi: 10.1038/s41556-023-01266-x. Epub 2023 Nov 6.

GATA transcription factors drive initial Xist upregulation after fertilization through direct activation of long-range enhancers

Affiliations

GATA transcription factors drive initial Xist upregulation after fertilization through direct activation of long-range enhancers

Liat Ravid Lustig et al. Nat Cell Biol. 2023 Nov.

Abstract

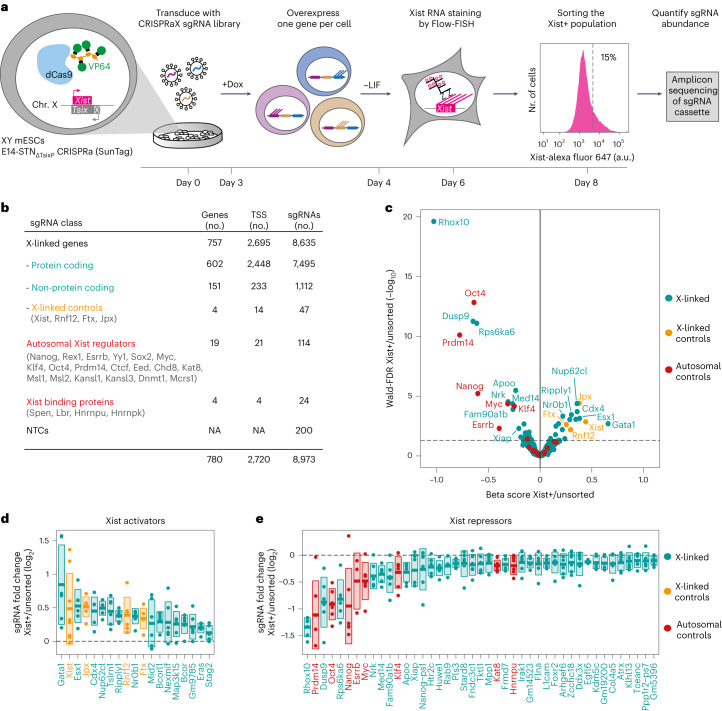
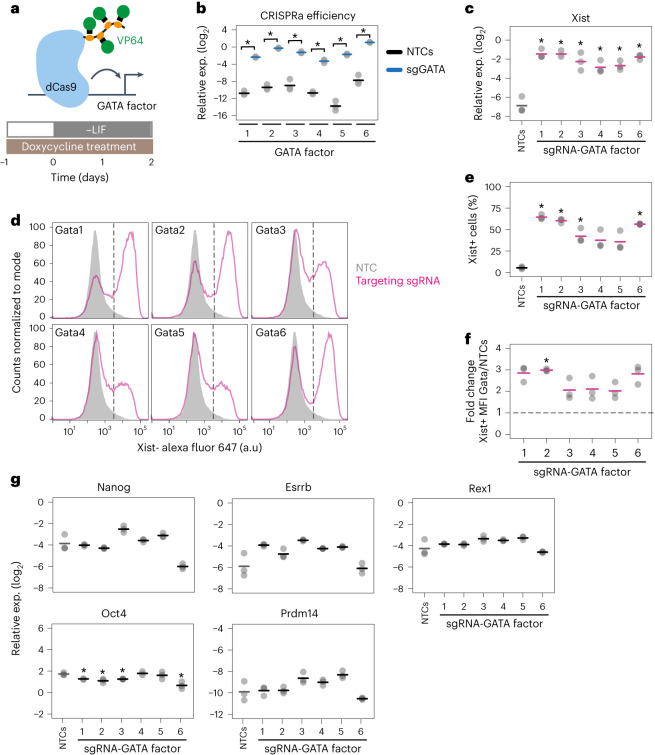
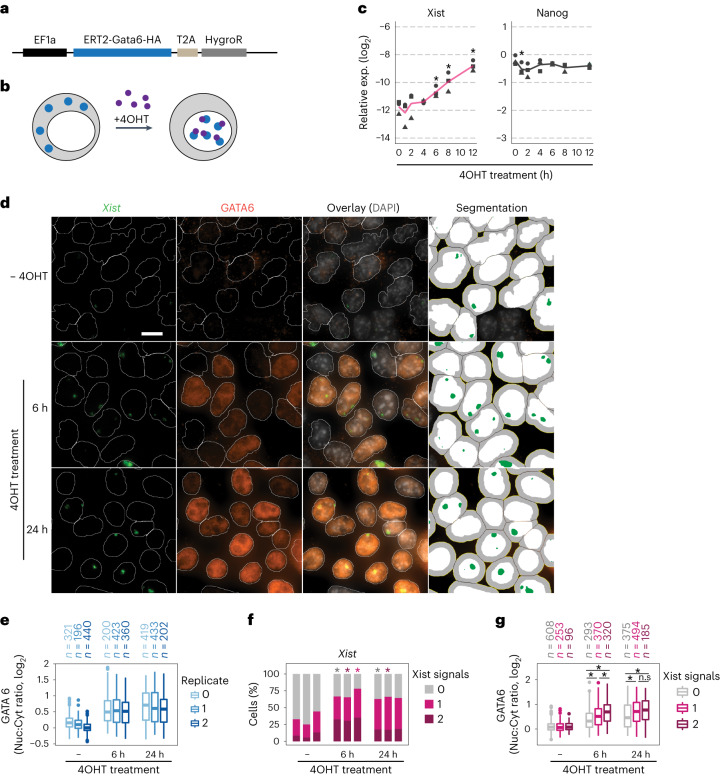
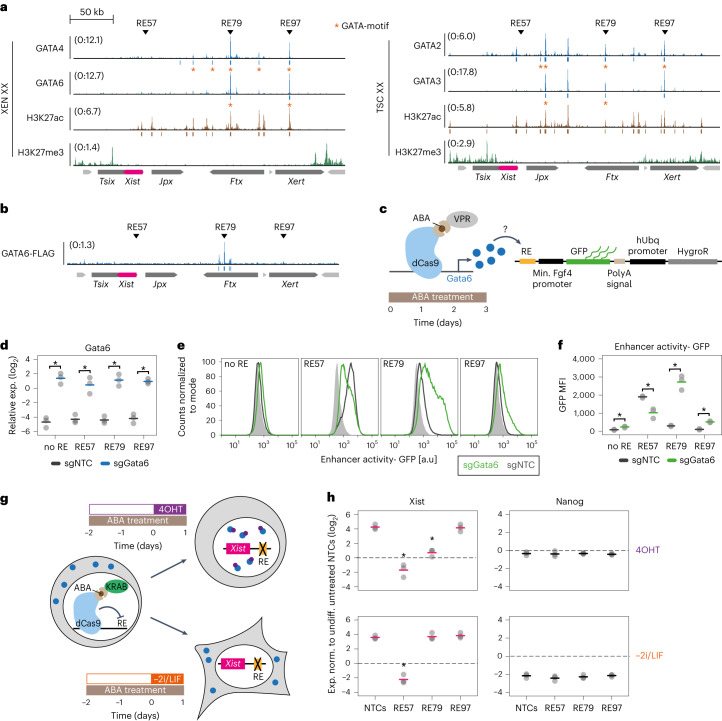
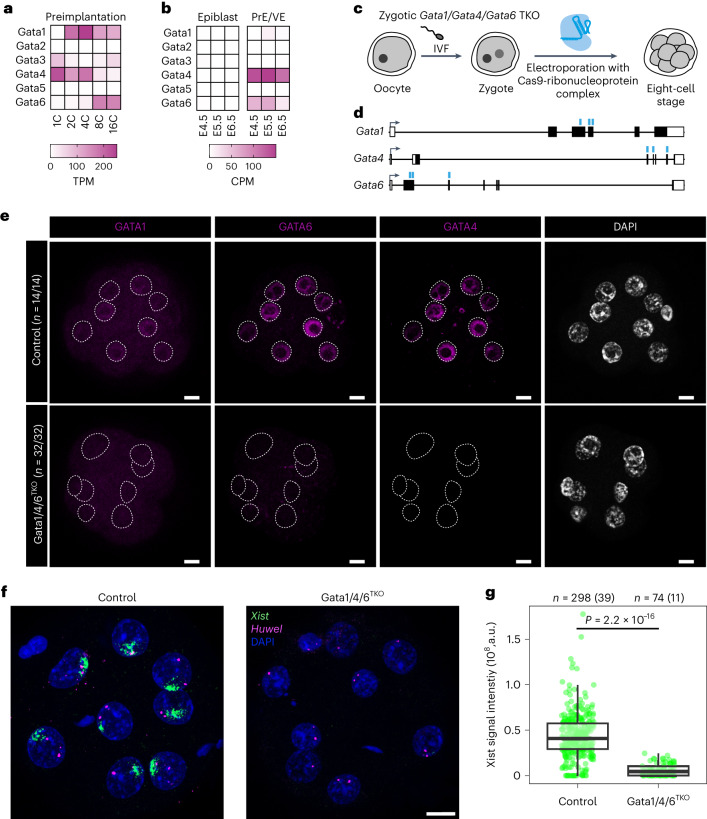
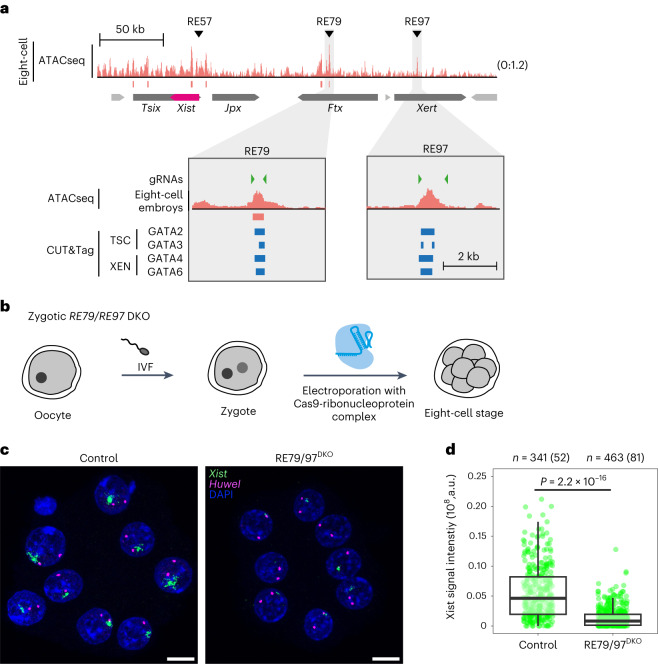
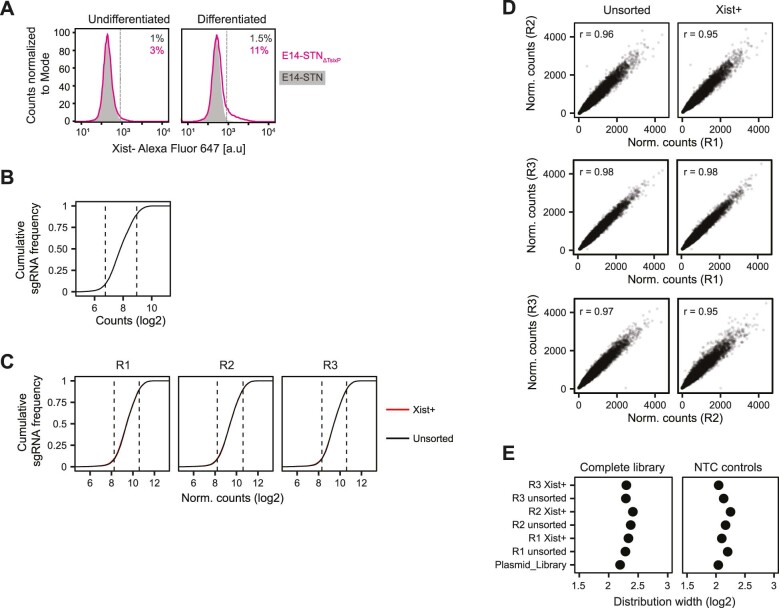
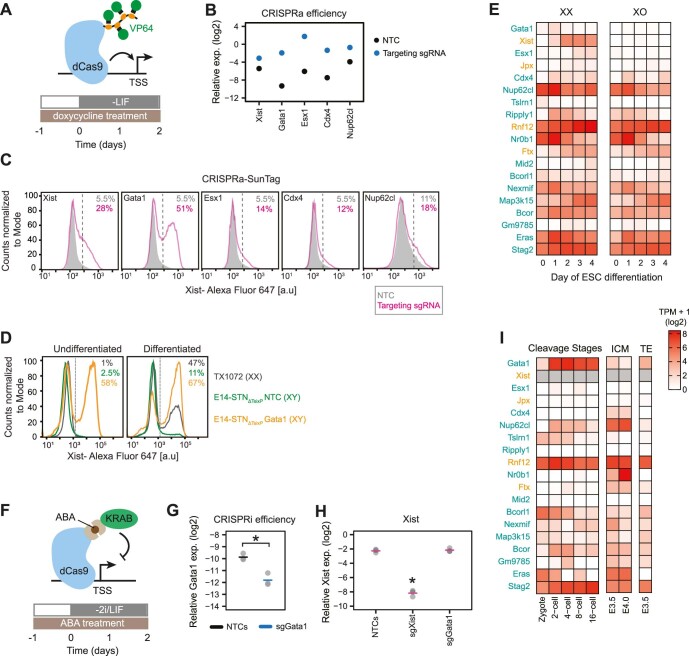
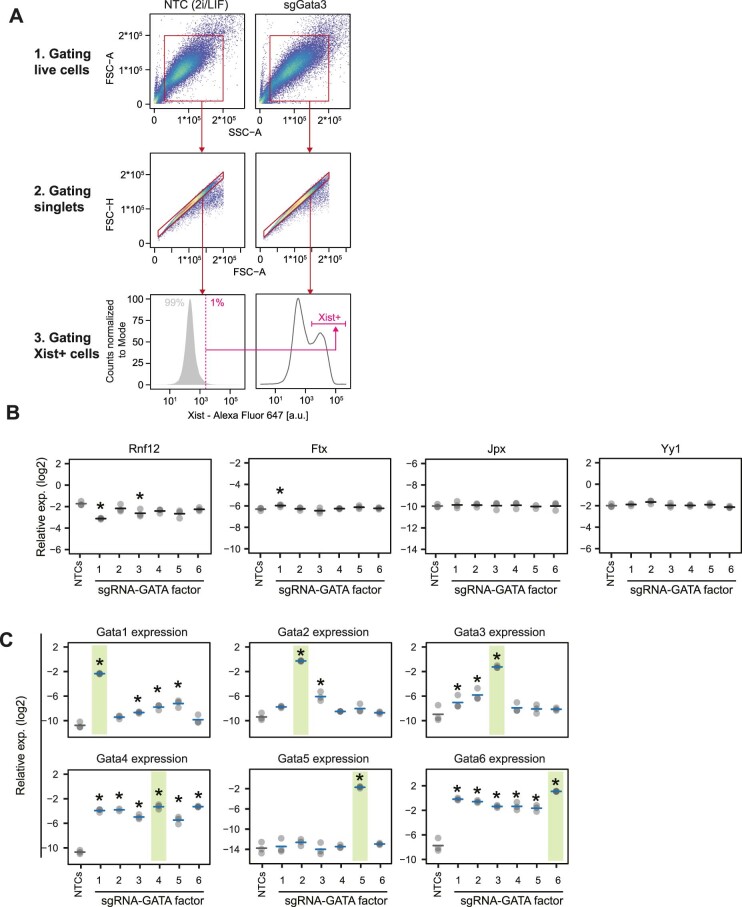
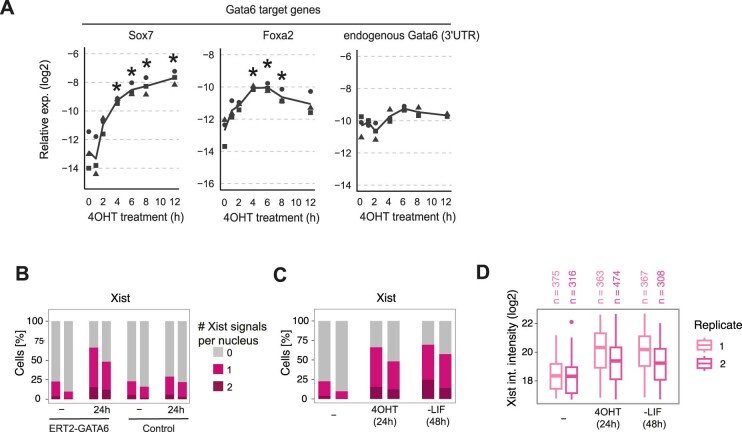
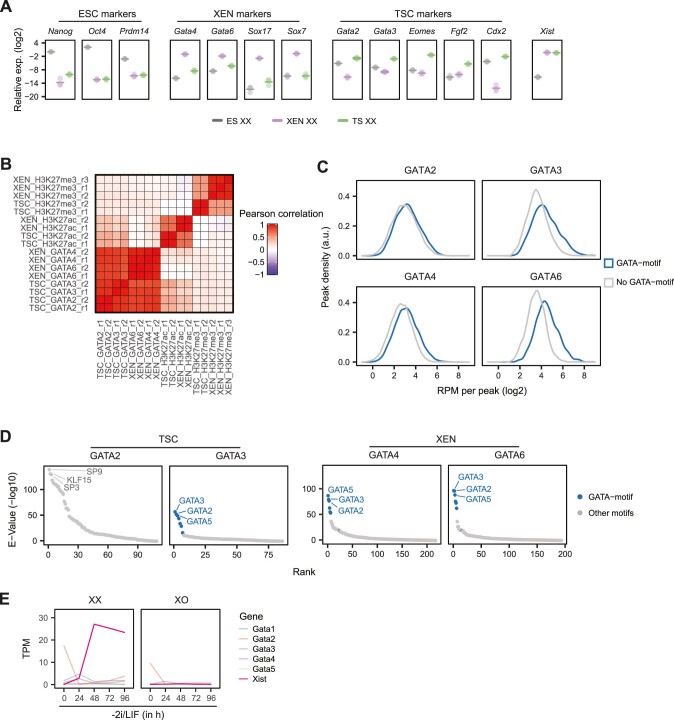
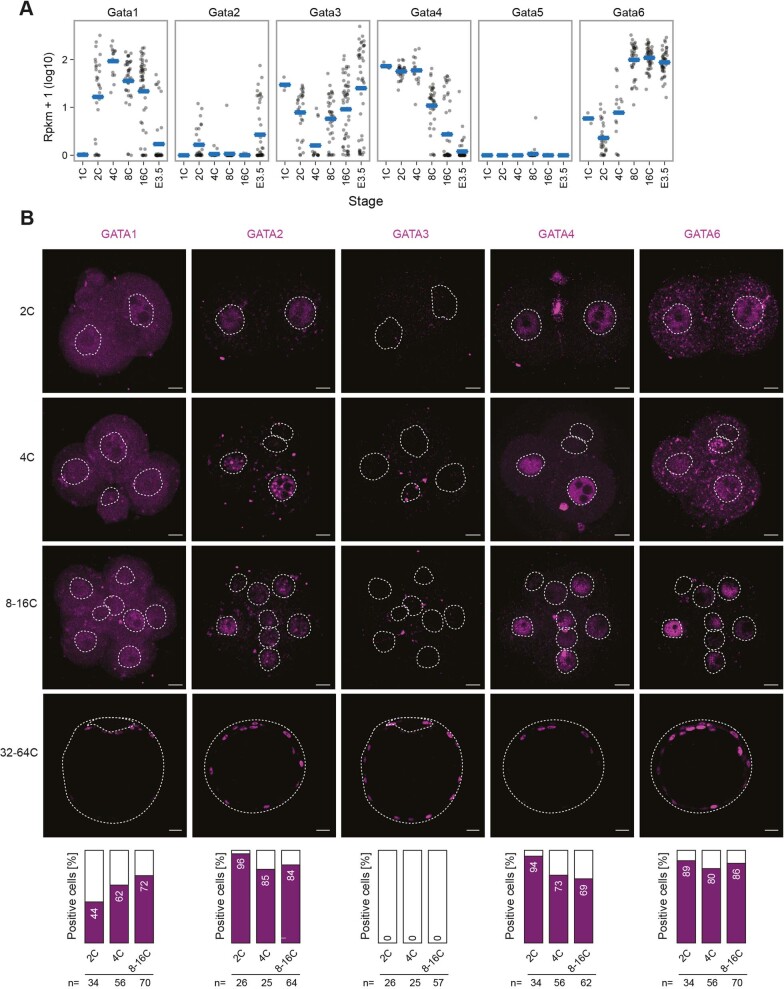
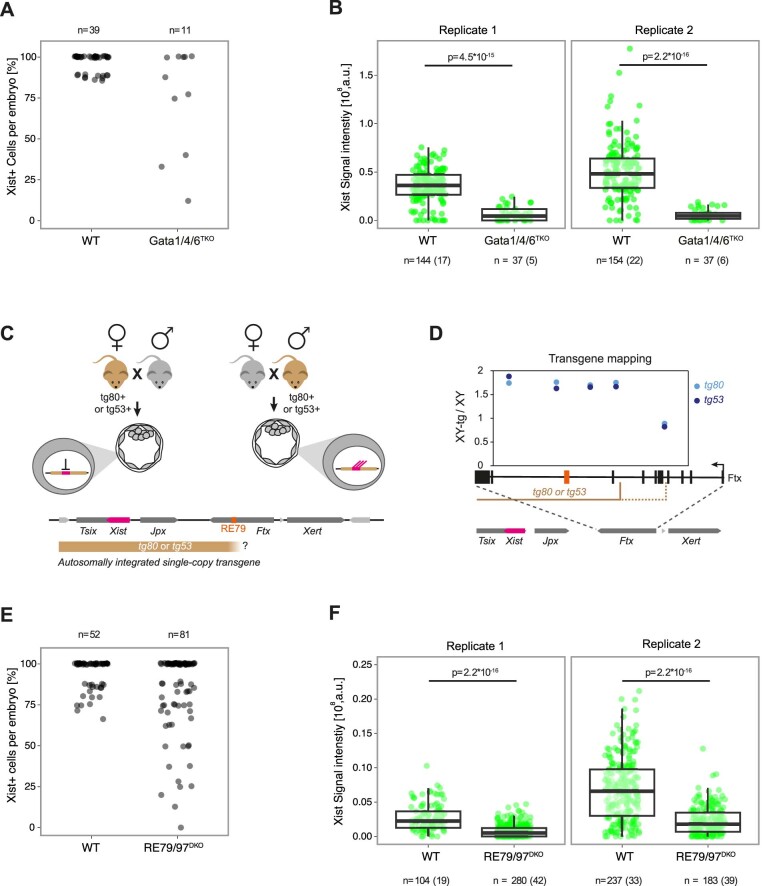
X-chromosome inactivation (XCI) balances gene expression between the sexes in female mammals. Shortly after fertilization, upregulation of Xist RNA from one X chromosome initiates XCI, leading to chromosome-wide gene silencing. XCI is maintained in all cell types, except the germ line and the pluripotent state where XCI is reversed. The mechanisms triggering Xist upregulation have remained elusive. Here we identify GATA transcription factors as potent activators of Xist. Through a pooled CRISPR activation screen in murine embryonic stem cells, we demonstrate that GATA1, as well as other GATA transcription factors can drive ectopic Xist expression. Moreover, we describe GATA-responsive regulatory elements in the Xist locus bound by different GATA factors. Finally, we show that GATA factors are essential for XCI induction in mouse preimplantation embryos. Deletion of GATA1/4/6 or GATA-responsive Xist enhancers in mouse zygotes effectively prevents Xist upregulation. We propose that the activity or complete absence of various GATA family members controls initial Xist upregulation, XCI maintenance in extra-embryonic lineages and XCI reversal in the epiblast.


Conflict of interest statement

The authors declare no competing interests.

Figures

Fig. 1
Fig. 1. Pooled CRISPR activation screen identifies unknown Xist regulators.
a, Schematic depiction of the CRISPRa screen workflow. A male ESC line with a deletion of the major Tsix promoter and a stably integrated doxycycline-inducible CRISPRa SunTag system (E14-STNΔTsix) was transduced with a custom sgRNA library targeting X-chromosomal genes (CRISPRaX). Following puromycin selection, the cells were treated with doxycycline (Dox) to overexpress one gene per cell, and differentiated by LIF withdrawal (–LIF) to induce Xist upregulation. Cells were stained with Xist-specific probes by Flow-FISH and the top 15% Xist+ cells were sorted by flow cytometry. The sgRNA cassette was amplified from genomic DNA and sgRNA abundance in the unsorted and sorted populations was determined by deep sequencing. The screen was performed in three independent replicates. b, Composition of the CRISPRaX sgRNA library, targeting each TSS with six sgRNAs per gene. Because a subset of guides target multiple coding and non-coding transcripts, the total number of sgRNAs is smaller than the sum of sgRNAs across categories. c, Volcano plot of the screen results, showing the beta-score as a measure of effect size versus Wald-FDR (MAGeCK-MLE), coloured according to gene class. The dotted line denotes Wald-FDR < 0.05. d,e, Comparison of individual sgRNA abundance (dots) in the sorted fraction compared with the unsorted population for all significantly enriched (d) or depleted (e) genes in the screen (Wald-FDR < 0.05, MAGeCK-MLE). The mean of three independent replicates is shown. Genes are ordered by their beta-score, a measure for effect size (MAGeCK-MLE). The central line depicts the mean, boxes depict the standard deviation across all sgRNAs targeting the respective gene. Only the highest scoring TSS per gene is depicted. Source numerical data are available as source data. Source Data
Fig. 2
Fig. 2. All GATA factors can induce Xist expression.
a, Schematic representation of the cell line (E14-STNΔTsixP) and experimental setup used in bg for ectopic overexpression of GATA family members. b,c, Expression of GATA factors (b) and Xist (c) measured by qRT-PCR upon targeting each GATA TF by CRISPRa using three sgRNAs per gene. df, Quantification of Xist RNA by Flow-FISH, showing representative flow cytometry profiles for one replicate (d), the fraction of Xist-positive cells (e) and the mean fluorescence intensity within the Xist-positive population of the targeted GATA factors compared to the NTC (f) across all three replicates. In d the sample shaded in grey denotes cells transduced with an NTC vector. Dashed lines divide Xist+ and Xist– cells, based on the 99th percentile of undifferentiated cells, transduced with NTCs, which do not express Xist (see Extended Data Fig. 3a for gating strategy). g, Expression levels of pluripotency factors were assessed by qRT-PCR. In b, c and eg the mean (horizontal dashes) of three biological replicates (dots) is shown; asterisks indicate P < 0.05 of a paired two-sided two-sample Student’s t-test for comparison to the respective NTC control (b, c, e, g) or a one-sample t-test (f) with Benjamini–Hochberg correction. Source numerical data and exact P-values are available as source data. Source Data
Fig. 3
Fig. 3. Xist is rapidly induced by GATA6 in a dose-dependent manner.
a,b, Schematic representation of the ERT2-GATA6 inducible system used in cg. Female TX-SP107 mESCs were transduced with a lentiviral vector expressing Gata6 cDNA N-terminally fused to the ERT2 domain and C-terminally tagged with HA under control of an EF1a promoter. b, Upon 4OHT treatment (purple), ERT2-GATA6-HA protein (blue) translocates into the nucleus. c, Time course of Xist and Nanog expression, assessed by qRT-PCR, upon 4OHT treatment of TX-SP107 ERT2-Gata6-HA cells, cultured in 2i/LIF medium. The black line indicates the mean of three biological replicates (symbols); asterisks indicate P < 0.05 using a two-sided paired Student’s t-test, comparing levels to the untreated control (0 h). dg, TX-SP107 ERT2-Gata6-HA cells were grown on glass coverslips in conventional ESC medium (LIF only) for 48 h and treated with 4OHT for 6 or 24 h, followed by immunofluorescence staining (anti-HA to detect GATA6) combined with RNA-FISH (to detect Xist). 2i removal was required for the cells to flatten out to allow automated image analysis, but led to partial Xist de-repression, such that 25–44% of cells already expressed Xist without 4OHT treatment, which was significantly increased upon 4OHT treatment (f). Nuclei (d, white) and Xist signals (d, green) were detected by automated image segmentation and GATA6-HA staining was quantified in the nucleus and in a 2.64 μm ring around the nucleus as a proxy for the cytoplasm (right column, grey) to quantify nuclear translocation in e and g. In e and f, three biological replicates are shown, which were merged for the analysis in g with excluding nuclei where more than two Xist signals were detected due to segmentation errors (<10% cells). The central mark indicates the median, and the bottom and top edges of the box indicate the first and third quartiles, respectively. The top and bottom whiskers extend the boxes to a maximum of 1.5 times the interquartile range; cell numbers are indicated on top. In f, asterisks indicate P < 0.05 using a two-sided paired Student’s t-test; in g they indicate P < 0.01, Wilcoxon rank-sum test. Scale bar represents 10 µm. Source numerical data and exact P-values are available as source data. Source Data
Fig. 4
Fig. 4. GATA6 regulates Xist by binding to a distal enhancer element.
a, Histone modifications and binding profiles for selected GATA TFs in female XEN (left) and TS cells (right), profiled by CUT&Tag. Peaks containing the respective GATA factor binding motif (P < 0.001, FIMO) are marked with an orange asterisk. Two or three biological replicates were merged. b, Published ChIP-seq data in mESCs overexpressing GATA6. Arrowheads in a and b, denote two regulatory elements (RE), RE79 and RE97, which are bound by all four tested GATA factors and the promoter-proximal RE57, which is not bound by GATA factors. Significant peaks (q < 0.05, MACS2) are indicated below the tracks. cf, Effect of GATA6 overexpression on a GFP reporter under control of different REs. TX-SP106 mESCs carrying a stably integrated ABA-inducible CRISPRa (VPR) system (c), were cultured in conventional ESC conditions and transduced with multiguide expression vectors of three sgRNAs against Gata6 or with NTCs. Cells were transduced with either the empty or RE-containing (RE57, RE79 and RE97) lentiviral FIREWACh enhancer–reporter vector and treated with ABA for 3 days (c). Upregulation of Gata6 was measured by qRT-PCR (d) and GFP levels were assessed by flow cytometry (e and f). In e, light grey represents the cells’ autofluorescence. g,h, Repression of REs through an ABA-inducible CRISPRi system and simultaneous GATA6 overexpression. Female TX-SP107 ERT2-Gata6-HA mESCs were cultured in 2i/LIF conditions and transduced with multiguide expression vectors of three or four sgRNAs against REs or with NTCs. The cells were treated for 3 days with ABA to repress the respective RE and one day before harvesting, the cells were either differentiated (bottom, –2i/LIF, GATA6-independent Xist upregulation) or treated with 4OHT (top, GATA6-dependent Xist upregulation). Xist and Nanog mRNA levels were assessed by qRT-PCR. Samples were normalized to undifferentiated NTC controls not treated with 4OHT. In d, f and h horizontal dashes indicate the mean of three biological replicates (dots); asterisks indicate P < 0.05 using a two-sided paired Student’s t-test for comparison to the respective NTC sample. The exact P-values are 0.009, 0.02, 0.007 and 0.008 (d); 0.03, 0.02, 0.009 and 0.006 (f); 0.003, 0.002 and 0.5 (h, Xist, 4OHT); 0.001, 0.5 and 0.05 (h, Xist, –2i/LIF). Source numerical data are available as source data. Source Data
Fig. 5
Fig. 5. GATA factors are required for initial Xist upregulation in vivo.
a,b, Expression of GATA TFs during early development assessed by scRNA-seq,. C, cell; PrE, primitive endoderm; VE, visceral endoderm. cg, Zygotic TKO of Gata1, Gata4 and Gata6. c, Schematic depiction of the experimental workflow, where zygotes, generated by IVF were electroporated with Alt-R CRISPR/Cas9 ribonucleoprotein complex pre-assembled with three crRNAs targeting the Gata1, Gata4 and Gata6 coding sequences. Embryos were allowed to develop to the eight-cell stage. d, Schematic depiction of Gata1, Gata4 and Gata6 genomic loci with regions targeted by crRNAs shown as blue lines. e, Staining of the indicated GATA TFs. Dashed lines represent the nuclei as detected by DAPI staining. For the numbers indicated, two biological replicates were merged. f,g, RNA-FISH for Xist and the X-linked Huwe1 gene (nascent transcript) at the eight-cell stage. Only female embryos (two Huwe1 signals) were included in the analysis. In g, the summed fluorescence intensity within the automatically detected Xist clouds is shown for individual cells. Embryos from two biological replicates were pooled (individual replicates are shown in Extended Data Fig. 7b). Statistical comparison was performed with a two-sided Wilcoxon ranksum test. The central mark indicates the median, and the bottom and top edges of the box indicate the first and third quartiles, respectively. The top and bottom whiskers extend the boxes to a maximum of 1.5 times the interquartile range; cell (embryo) numbers are indicated on top. The scale bars in e and f represent 10 μm. Source numerical data are available as source data. Source Data
Fig. 6
Fig. 6. GATA-binding elements RE79 and RE97 are required for initial Xist upregulation in vivo.
a, DNA accessibility measured by ATAC-seq in eight-cell stage mouse embryos, showing open chromatin at GATA-bound Xist-regulatory elements RE79 and RE97. Green triangles show location of gRNA sequences used in bd. bd, Zygotic DKO of RE79 and RE97. b, Schematic depiction of the experimental workflow, where zygotes, generated by IVF were electroporated with Alt-R CRISPR/Cas9 ribonucleoprotein complex pre-assembled with four crRNAs targeting RE79 and RE97, as shown in a (green triangles). Embryos were allowed to develop to the eight-cell stage. c, RNA-FISH for Xist and the X-linked Huwe1 gene (nascent transcript) at the eight-cell stage. Only female embryos (two Huwe1 signals) were included in the analysis. In d the summed fluorescence intensity within the automatically detected Xist cloud is shown for individual cells. Embryos from two biological replicates were pooled (individual replicates are shown in Extended Data Fig. 7f). Statistical comparison was performed with a two-sided Wilcoxon rank-sum test. The central mark indicates the median, and the bottom and top edges of the box indicate the first and third quartiles, respectively. The top and bottom whiskers extend the boxes to a maximum of 1.5 times the interquartile range; cell (embryo) numbers are indicated on top. The scale bars in c represent 10 μm. Source numerical data are available as source data. Source Data
Extended Data Fig. 1
Extended Data Fig. 1. Pooled CRISPR activation screen identifies new Xist regulators.
(a) E14-STN (grey) and E14-STNΔTsixP (pink) cells were treated with doxycycline for 3 days and were differentiated for the last 2 days by LIF withdrawal, followed by Flow-FISH with Xist-specific probes. Dashed lines mark the 99th percentile of undifferentiated E14-STN cells to separate Xist+ and Xist- cells. The percentage of Xist+ cells in each sample is indicated. (b-c) Cumulative frequency plot showing the distribution of sgRNA counts in the cloned sgRNA library (b) and in the sorted and unsorted fractions (c). Dashed lines indicate the distribution width (10th and 90th percentile, quantified in e). (d) Scatterplots showing a high correlation between the replicates in the screen for each fraction as indicated. Pearson correlation coefficients between replicates are shown. (e) Log2 distribution width (fold change between the 10th and 90th percentiles) for all sgRNAs (left) and NTC sgRNAs only (right). The NTC distribution width was similar across samples, suggesting that sufficient library coverage was maintained during all steps of the screen. Source numerical data are available in source data. Source Data
Extended Data Fig. 2
Extended Data Fig. 2. GATA1 is a potent Xist activator.
(a-c) Individual overexpression of screen hits with CRISPRa in E14-STNΔTsixP mESCs using a single guide RNA per gene that had performed well in the screen. (a) The cells were treated with doxycycline 24 h before differentiation by LIF withdrawal for 2 days. (b) Expression levels of the targeted genes were measured by qRT-PCR. (c) Xist expression measured by Flow-FISH. Dashed lines mark the 99th percentile of undifferentiated NTC-transduced E14-STNΔTsixP cells (Xist- population). The percentage of Xist+ cells is indicated. (d) Xist expression was measured via Flow-FISH in female TX1072 cell line and in male E14-STNΔTsixP cells transduced with multiguide expression vectors of three sgRNAs against the Gata1 promoter region or with NTCs. TX1072 cells were cultured in naive conditions (2i/LIF) and E14-STNΔTsixP in conventional ESC medium (LIF). The cells were differentiated (2i/LIF or LIF withdrawal) for 2 days. E14-STNΔTsixP were treated with doxycycline 24 h before and during differentiation. Dashed lines mark the 99th percentile of the TX1072 undifferentiated (2i/LIF) sample and the percentage of Xist+ cells in each sample is indicated. (e) Heatmap showing expression levels assessed by RNA-seq (mean of 3 biological replicates) of the most enriched genes in the screen (Fig. 1d) in XX and XO TX1072 mESCs differentiated by 2i/LIF withdrawal. (f-h) Gata1 knock-down by CRISPRi in female mESCs. (f) Schematic representation of an ABA-inducible CRISPRi system in female TX-SP107 mESCs. Gata1 knock-down efficiency (g) and effect on Xist (h) quantified by qRT-PCR after 2 days of differentiation. SgRNAs targeting the Xist TSS and NTCs were included as controls. Horizontal dashes indicate the mean of 3 biological replicates (dots); asterisks indicate p < 0.05 for two-sided paired Student’s T-test. (i) Expression of screen hits during preimplantation development,. Xist could not be quantified (grey) because the employed protocol was not strand-specific, such that Xist could not be distinguished from its antisense transcript Tsix. In (e) and (i) Xist and known Xist regulators are coloured in yellow. Source numerical data and exact p-values are available in source data. Source Data
Extended Data Fig. 3
Extended Data Fig. 3. CRISPRa-mediated overexpression of GATA TFs.
(a-c) Male E14-STN△TsixP cells were transduced with multiguide expression vectors of three sgRNAs targeting the promoter of each GATA factor or with NTCs. Cells were treated with doxycycline for 3 days and differentiated for 2 days (LIF withdrawal). (a) The gating strategy employed for quantification of Xist by Flow-FISH. As an example, cells transduced with sgRNAs targeting Gata3 are shown (right). Undifferentiated cells (+LIF) transduced with a NTC vector (left), which do not express Xist, were used to set the gate to identify Xist+ cells (99th percentile). This gating strategy was applied in Fig. 2d–f, Extended Data Fig. 1a and Extended Data Fig. 2c, d. Steps 1 and 2 were applied in an identical manner in Fig. 1a and Fig. 4e, f. (b-c) Expression levels of known Xist regulators (b) and of GATA factors (c) were assessed by qRT-PCR. Mean (horizontal dashes) of 3 biological replicates (dots) is shown; asterisks indicate p < 0.05 of a two-sided paired Student’s T-test with Benjamini–Hochberg correction for comparison to the respective NTC control. Green areas in (c) indicate the GATA factor that was targeted by CRISPRa. Source numerical data and exact p-values are available in source data. Source Data
Extended Data Fig. 4
Extended Data Fig. 4. Xist is rapidly induced by GATA6 in a dose-dependent manner.
(a) Time course of 4OHT treatment of TX-SP107 ERT2-Gata6-HA cells, cultured in 2i/LIF medium. Expression levels of known GATA6 target genes were measured by qRT-PCR. The black line indicates the mean of 3 biological replicates (symbols); asterisks indicate p < 0.05 using a two-sided paired Student’s T-test, comparing levels to the untreated control (0 h). (b) TX-SP107 ERT2-Gata6-HA cells and the parental TX-SP107 line were treated with 4OHT as described in main Fig. 3, showing that only ERT2-Gata6-HA expressing cells upregulate Xist upon 4OHT treatment. (c, d) ERT2-Gata6-HA cells were treated with 4OHT for 24 h as described in main Fig. 3 or were differentiated for 48 h by 2i/LIF withdrawal. The summed fluorescence intensity within the Xist cloud signals is shown in (d). Both treatments induce a comparable frequency of Xist expression (c) and signal strength (d). In (d) the central mark indicates the median, and the bottom and top edges of the box indicate the first and third quartiles, respectively. The top and bottom whiskers extend the boxes to a maximum of 1.5 times the interquartile range; cell numbers are indicated on top. In (b-d) 2 biological replicates are shown with excluding nuclei with >2 Xist signals due to segmentation errors (<10% of nuclei). Source numerical data are available in source data. Source Data
Extended Data Fig. 5
Extended Data Fig. 5. GATA factor profiling by CUT&Tag in XEN and TSCs and by RNA-seq in mESCs.
(a) Relative expression levels of various marker genes of ESCs, XEN and TS cells as indicated and of Xist, measured via qRT-PCR in female TX1072 ESCs, XEN and TS cells. Mean (dash) of 3 biological replicates (dots) is shown. (b) Pearson correlation coefficient between all CUT&Tag samples. The heatmap is ordered according to hierarchical clustering of the correlations. Correlation between biological replicates was high and the samples showed the expected correlation patterns. (c) Density of RPM values per peak in each condition of the GATA CUT&Tag data. The data is split in peaks containing (blue) or not containing (grey) the respective GATA-motif (p < 0.001, FIMO). While peaks with a motif were clearly stronger for GATA6 and GATA3, and to a slightly lesser extent also for GATA4, no difference was observed for GATA2. (d) Enrichment of TF-binding motifs within peaks identified for the different GATA TFs using AME. Binding motifs were ranked according to their E-values, a measure of the statistical enrichment of the respective motif. All binding motifs with an -log10(E-value) < 10 are shown. All GATA-family binding motifs are coloured in blue. Additionally, the 3 most enriched motifs per sample are labelled. For GATA3, GATA4 and GATA6 all top-ranking motifs were members of the GATA family, while no GATA motifs were found for GATA2. These analyses suggest that GATA3, GATA4 and GATA6 can be profiled reliably by CUT&Tag, while the data for GATA2 should be interpreted with caution. (e) Expression pattern of GATA TFs and Xist in differentiating mESCs (2i/LIF-withdrawal) with one (TX1072 XO H7/A3) or two X-chromosomes (TX1072 XX) measured by RNA-seq. Source numerical data are available in source data. Source Data
Extended Data Fig. 6
Extended Data Fig. 6. Multiple GATA TFs are expressed during mouse preimplantation development.
(a) Expression of GATA TFs assessed by scRNA-seq across different stages of early mouse development. Horizontal dashes indicate the mean of 24 (1C), 180 (2C), 84 (4C), 222 (8C), 300 (16C) and 258 (E3.5) cells. (b) Protein staining of all GATA TFs except GATA5 in preimplantation mouse embryos (stages indicated). Nuclei were detected by DAPI staining and their contour is marked (dashed line). Bar plots show the percentages of positive nuclei for the respective GATA protein. Percentages represent the mean of two biological replicates. The number of nuclei counted is shown below the plots. Scale bars represent 10 μm, scale bars for 32-64 C are 20 μm. Source numerical data are available in source data. Source Data
Extended Data Fig. 7
Extended Data Fig. 7. The role of GATA factors in vivo.
(a, b) Zygotic triple knock-out (TKO) of Gata1, Gata4 and Gata6 as shown in main Fig. 5f. (a) The percentage of cells in each embryo with an Xist signal is shown at the eight-cell stage. Two biological replicates were merged. The efficiency of Xist upregulation is reduced in TKO embryos. (b) The summed fluorescence intensity within the automatically detected Xist clouds is shown for individual cells. Statistical comparison was performed with a two-sided Wilcoxon ranksum test. The number of cells (embryos) included in the analysis is indicated below. (c) The tg80/tg53 transgenes (beige), which contain the Xist gene and ~100 kb of upstream genomic sequence (bottom), can reproduce imprinted Xist expression, when autosomally integrated as a single copy, as they are expressed upon paternal (right), but not upon maternal (left) transmission,. (d) Mapping of the telomeric end of tg80/tg53 by qPCR on genomic DNA from XY-tg80/tg53 ESCs with primer pairs detecting different positions around RE79, as indicated below the plot. Mapping confirms that tg80 and tg53 contain the RE79 region. Results are expressed as relative DNA quantity with respect to XY cells without the transgene (E14-STNΔTsixP). (e, f) Zygotic double knock-out (DKO) of RE79 and RE97 as shown in main Fig. 6c. (e) The percentage of cells in each embryo with an Xist signal is shown at the eight-cell stage. Two biological replicates were merged. The efficiency of Xist upregulation is reduced in DKO embryos. (f) The summed fluorescence intensity within the automatically detected Xist cloud is shown for individual cells. Statistical comparison was performed with a two-sided Wilcoxon ranksum test. The number of cells (embryos) included in the analysis is indicated below. In (b) and (f) the central mark indicates the median, and the bottom and top edges of the box indicate the first and third quartiles, respectively. The top and bottom whiskers extend the boxes to a maximum of 1.5 times the interquartile range. Source numerical data are available in source data. Source Data

References

    1. Lyon MF. Gene action in the X-chromosome of the mouse (Mus musculus L.) Nature. 1961;190:372–373. - PubMed
    1. Penny GD, Kay GF, Sheardown SA, Rastan S, Brockdorff N. Requirement for Xist in X chromosome inactivation. Nature. 1996;379:131–137. - PubMed
    1. Brown CJ, et al. A gene from the region of the human X inactivation centre is expressed exclusively from the inactive X chromosome. Nature. 1991;349:38–44. - PubMed
    1. Mak W, et al. Reactivation of the paternal X chromosome in early mouse embryos. Science. 2004;303:666–669. - PubMed
    1. Okamoto I, Otte AP, Allis CD, Reinberg D, Heard E. Epigenetic dynamics of imprinted X inactivation during early mouse development. Science. 2004;303:644–649. - PubMed

Publication types