. 2023 Dec;24(12):2053-2067.
doi: 10.1038/s41590-023-01669-w. Epub 2023 Nov 6.

A discrete 'early-responder' stromal-cell subtype orchestrates immunocyte recruitment to injured tissue

Affiliations

A discrete 'early-responder' stromal-cell subtype orchestrates immunocyte recruitment to injured tissue

Omar K Yaghi et al. Nat Immunol. 2023 Dec.

Abstract

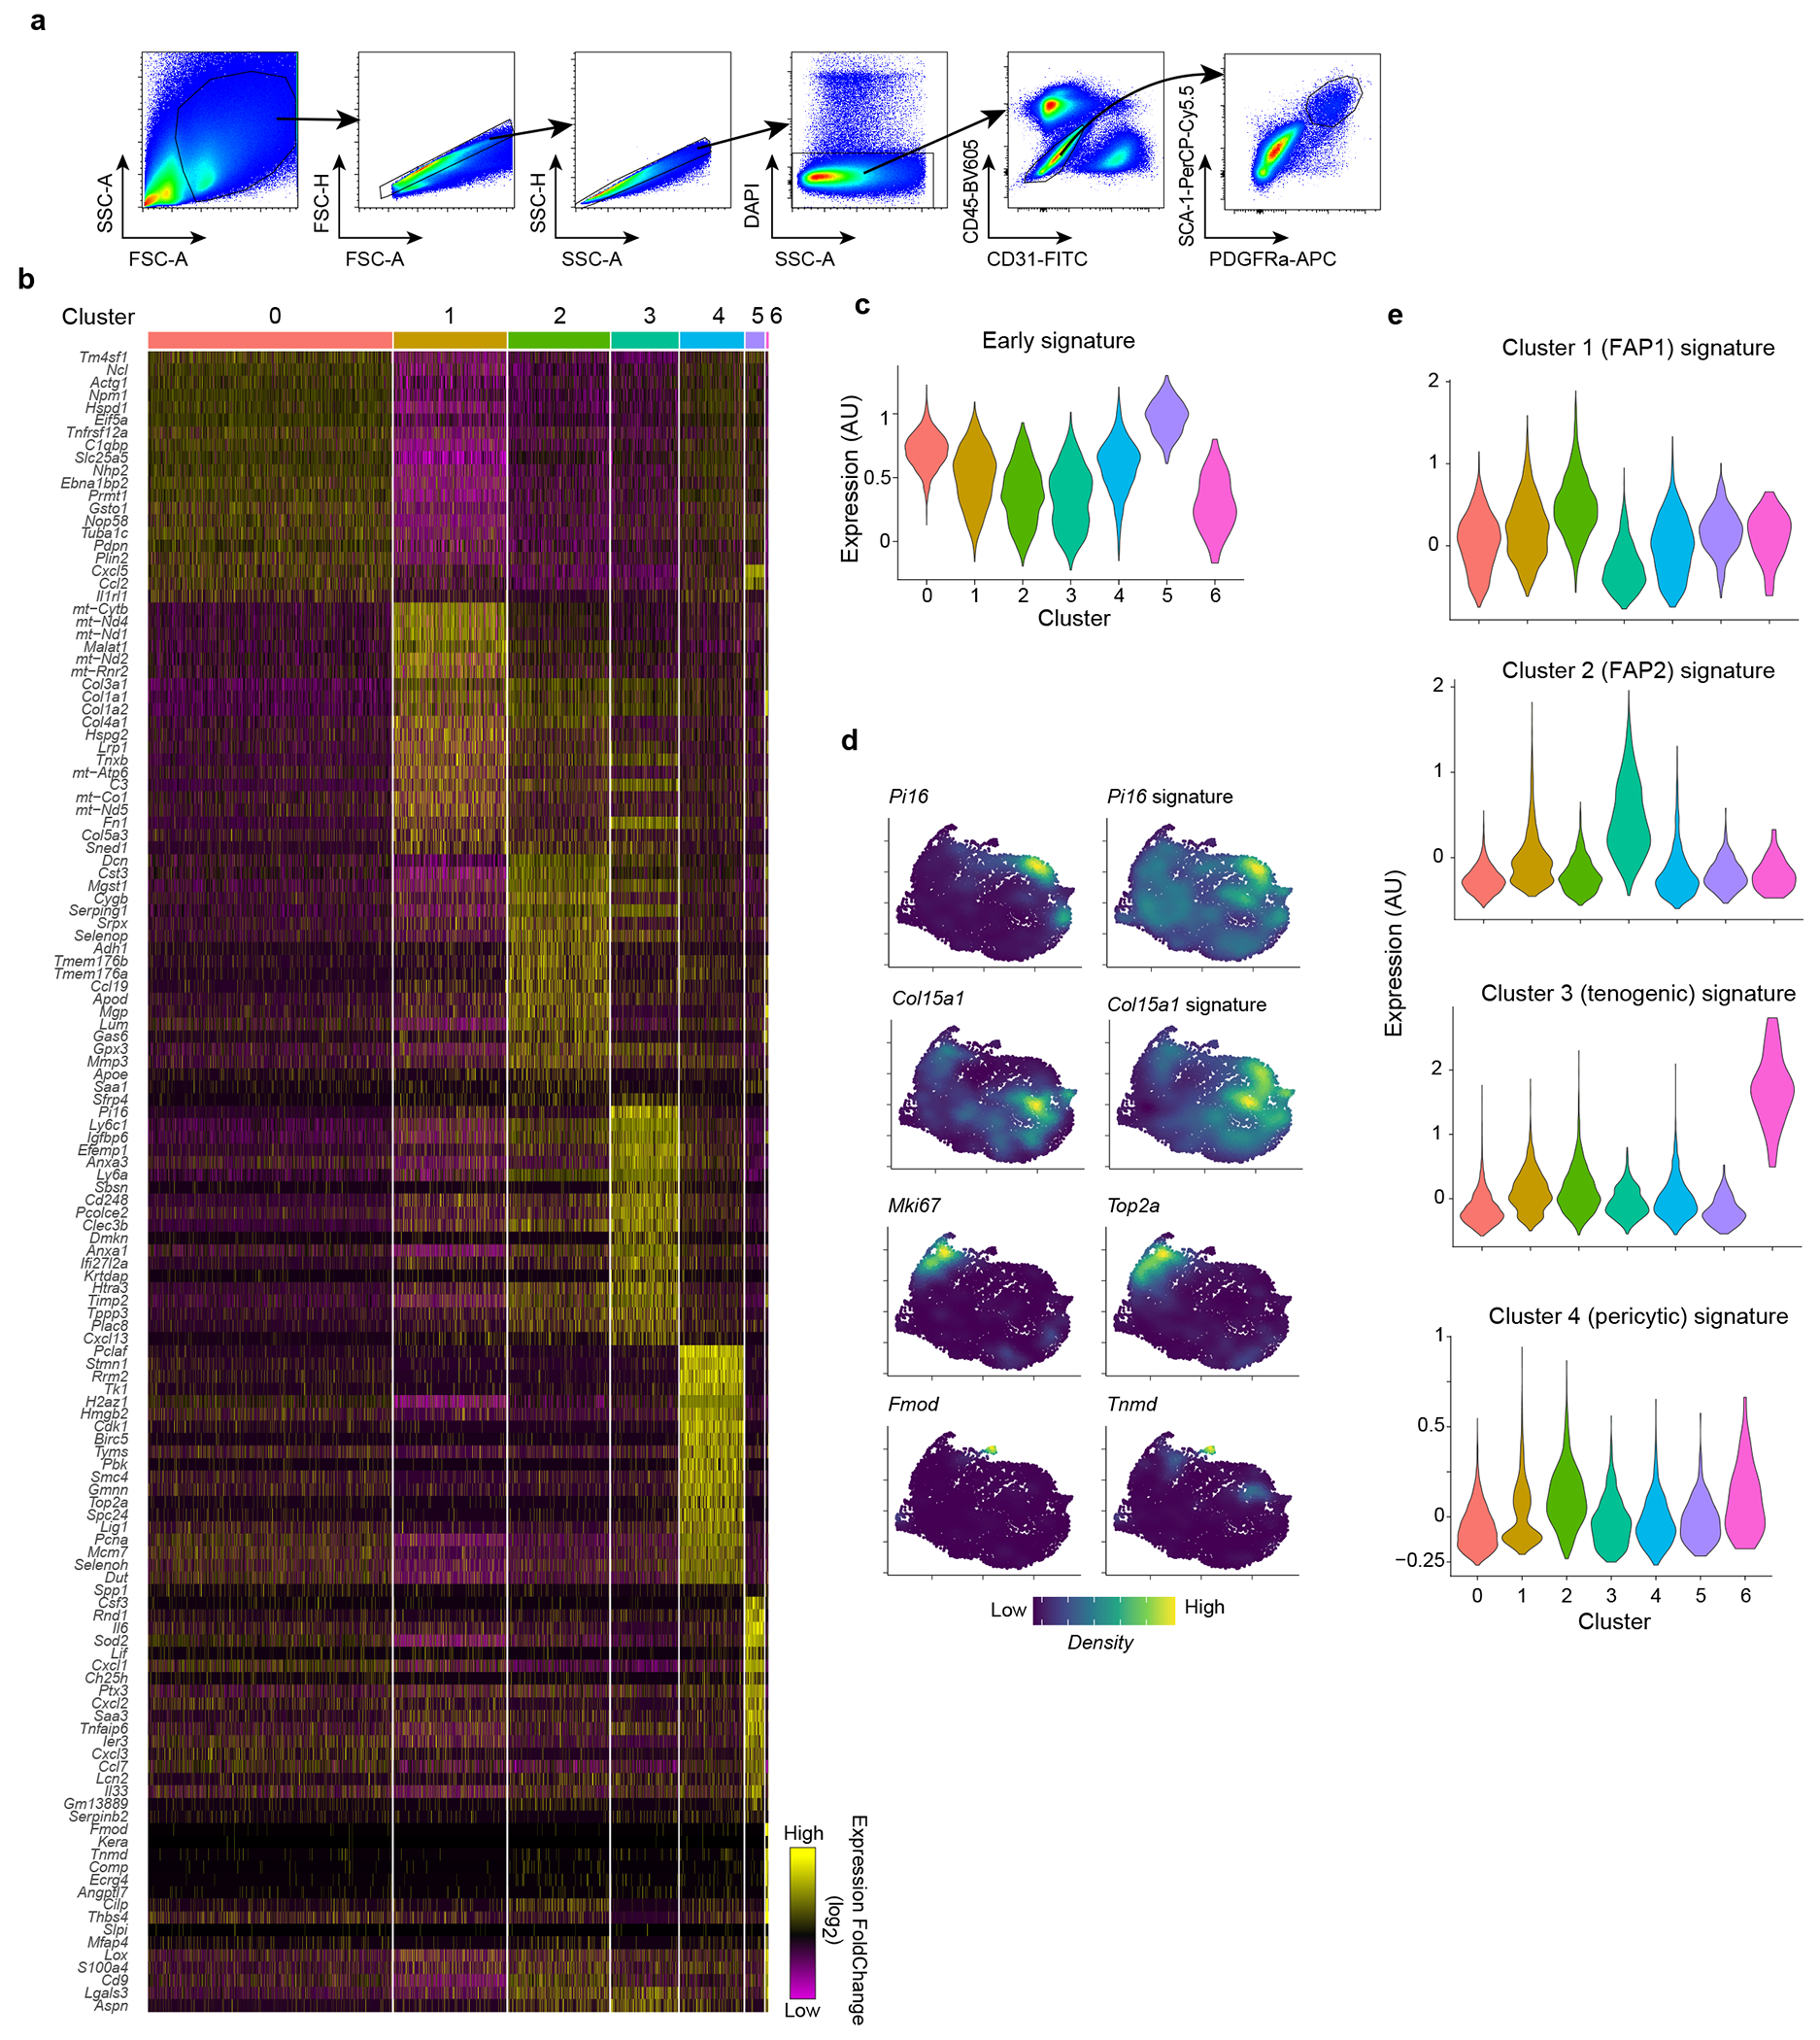
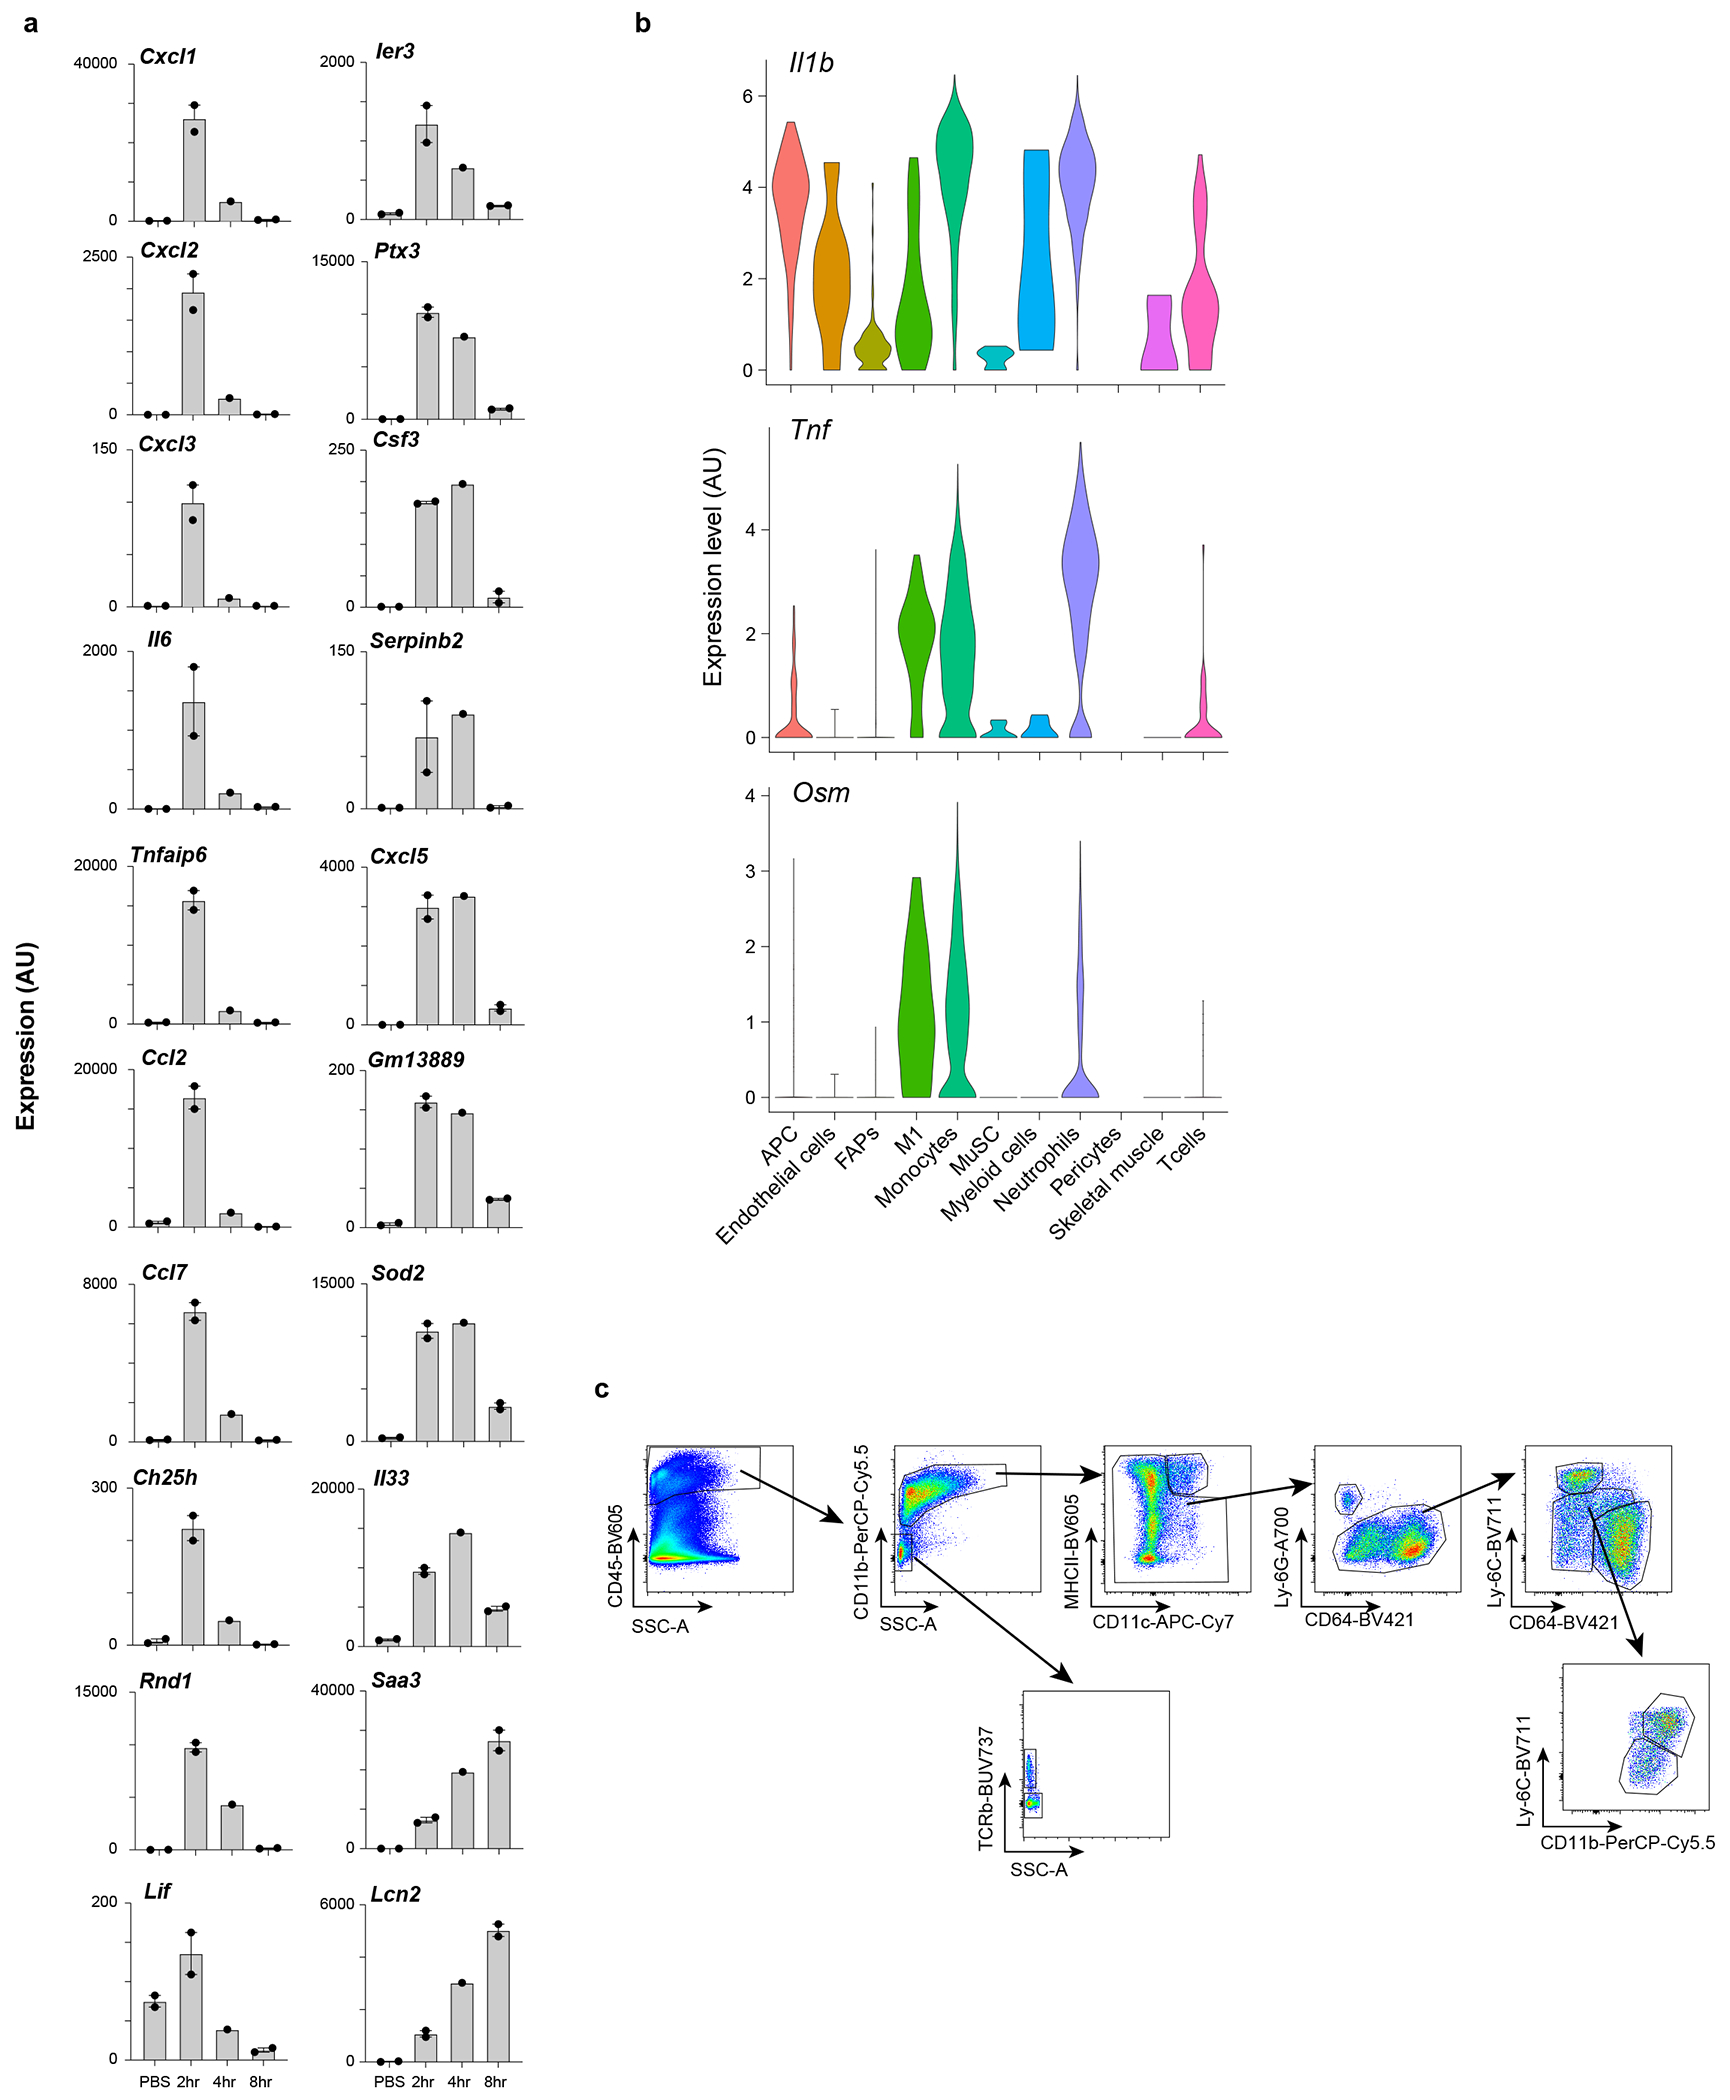
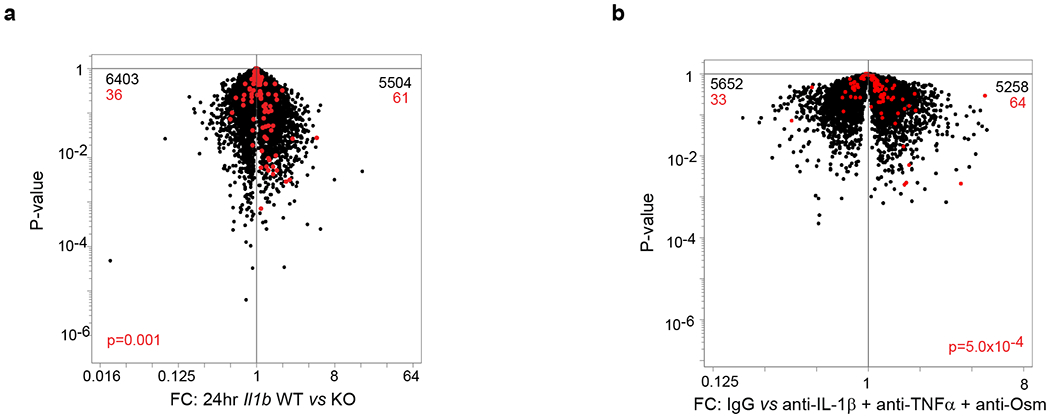
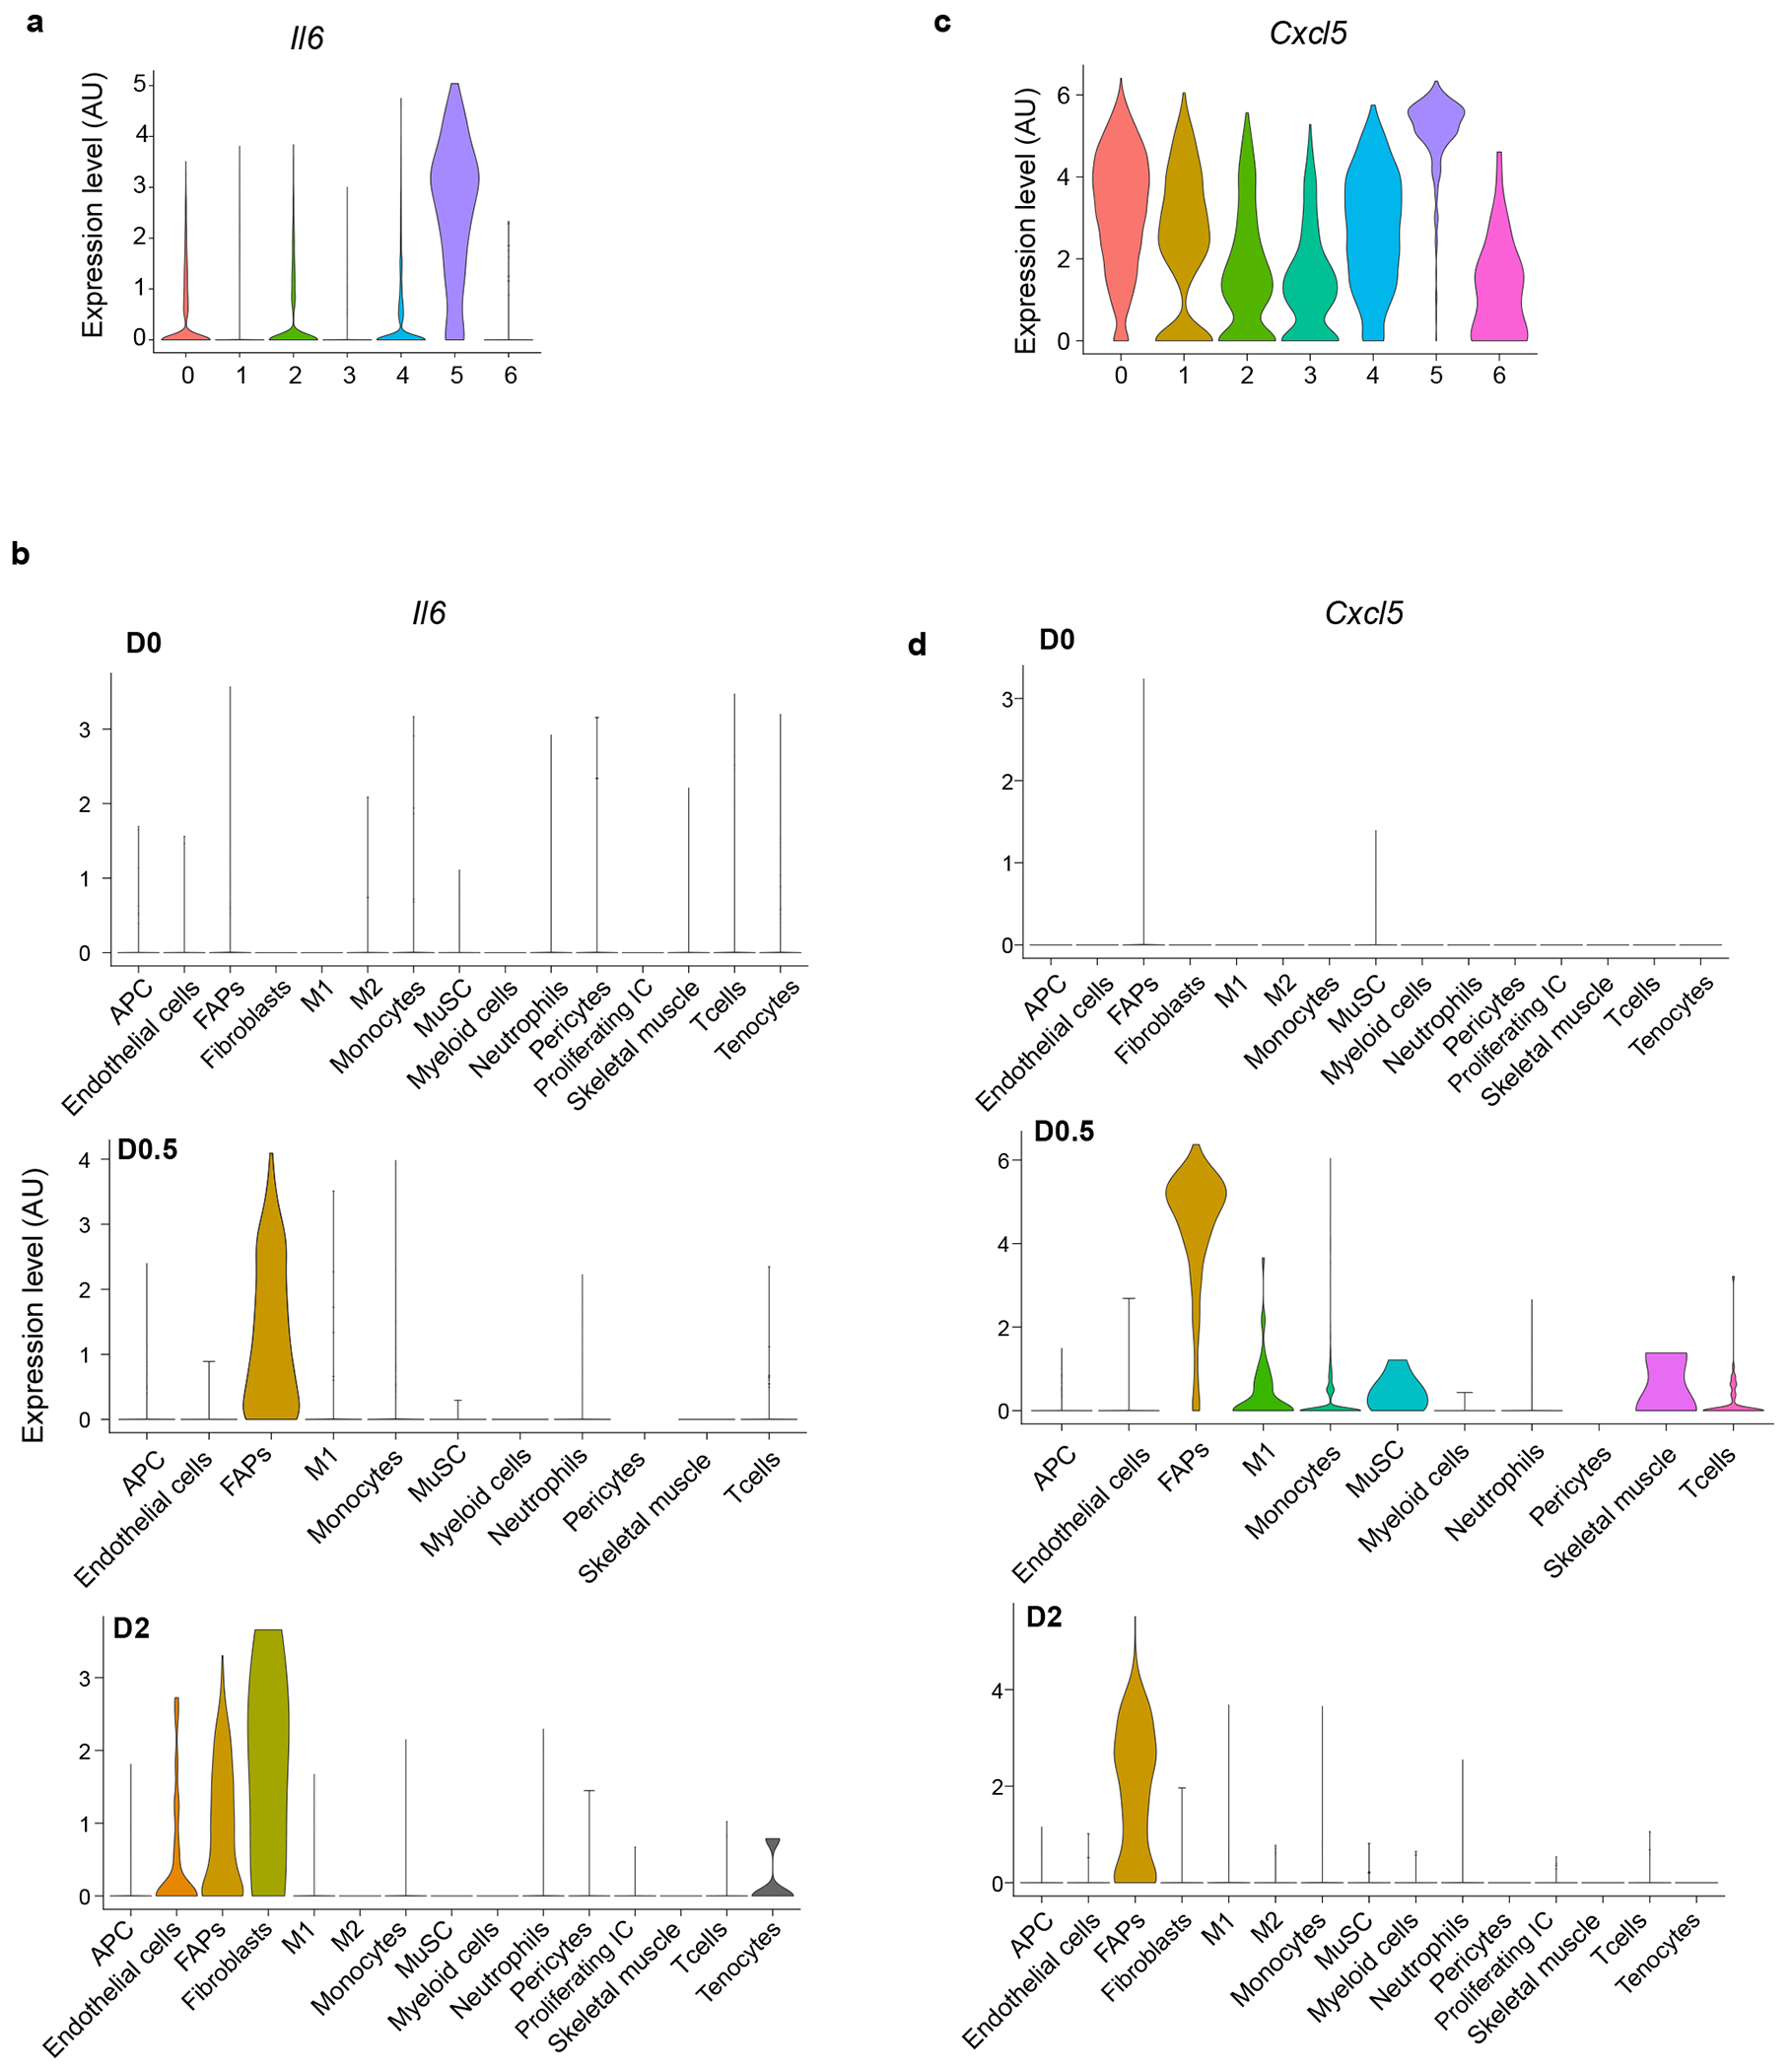
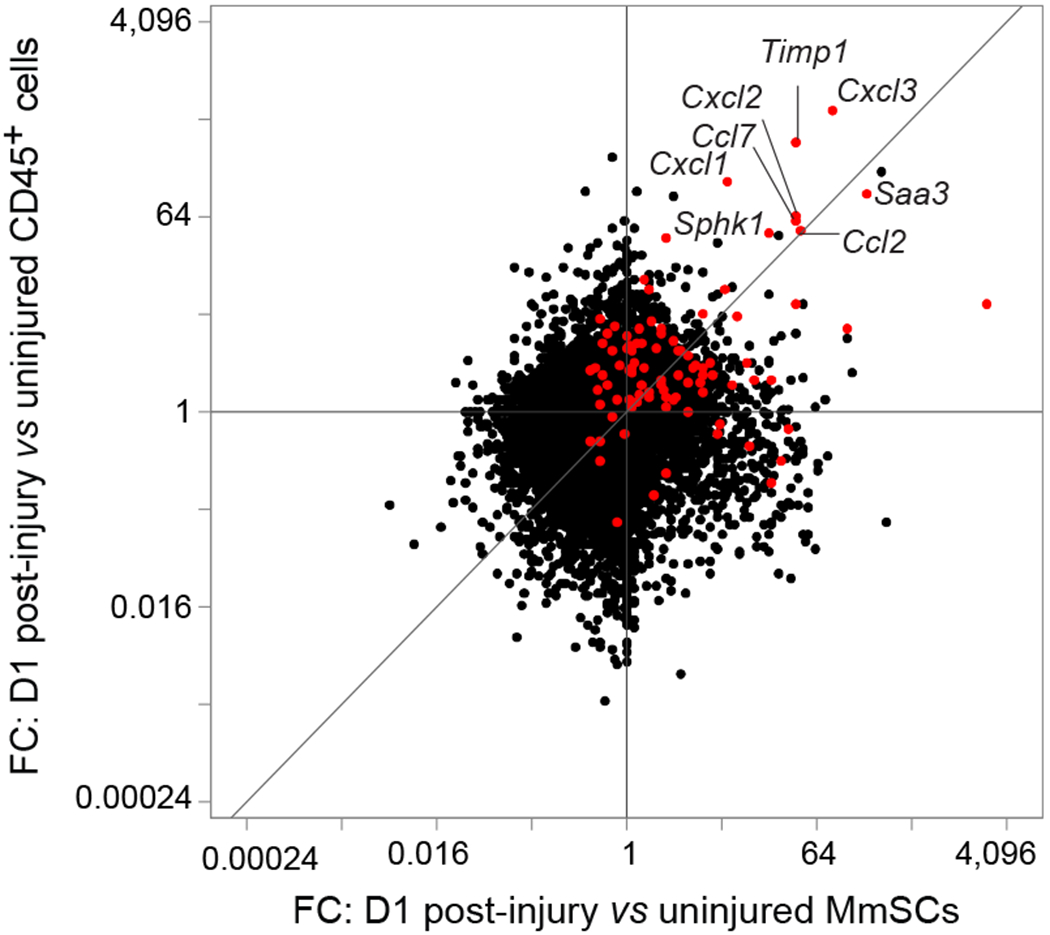
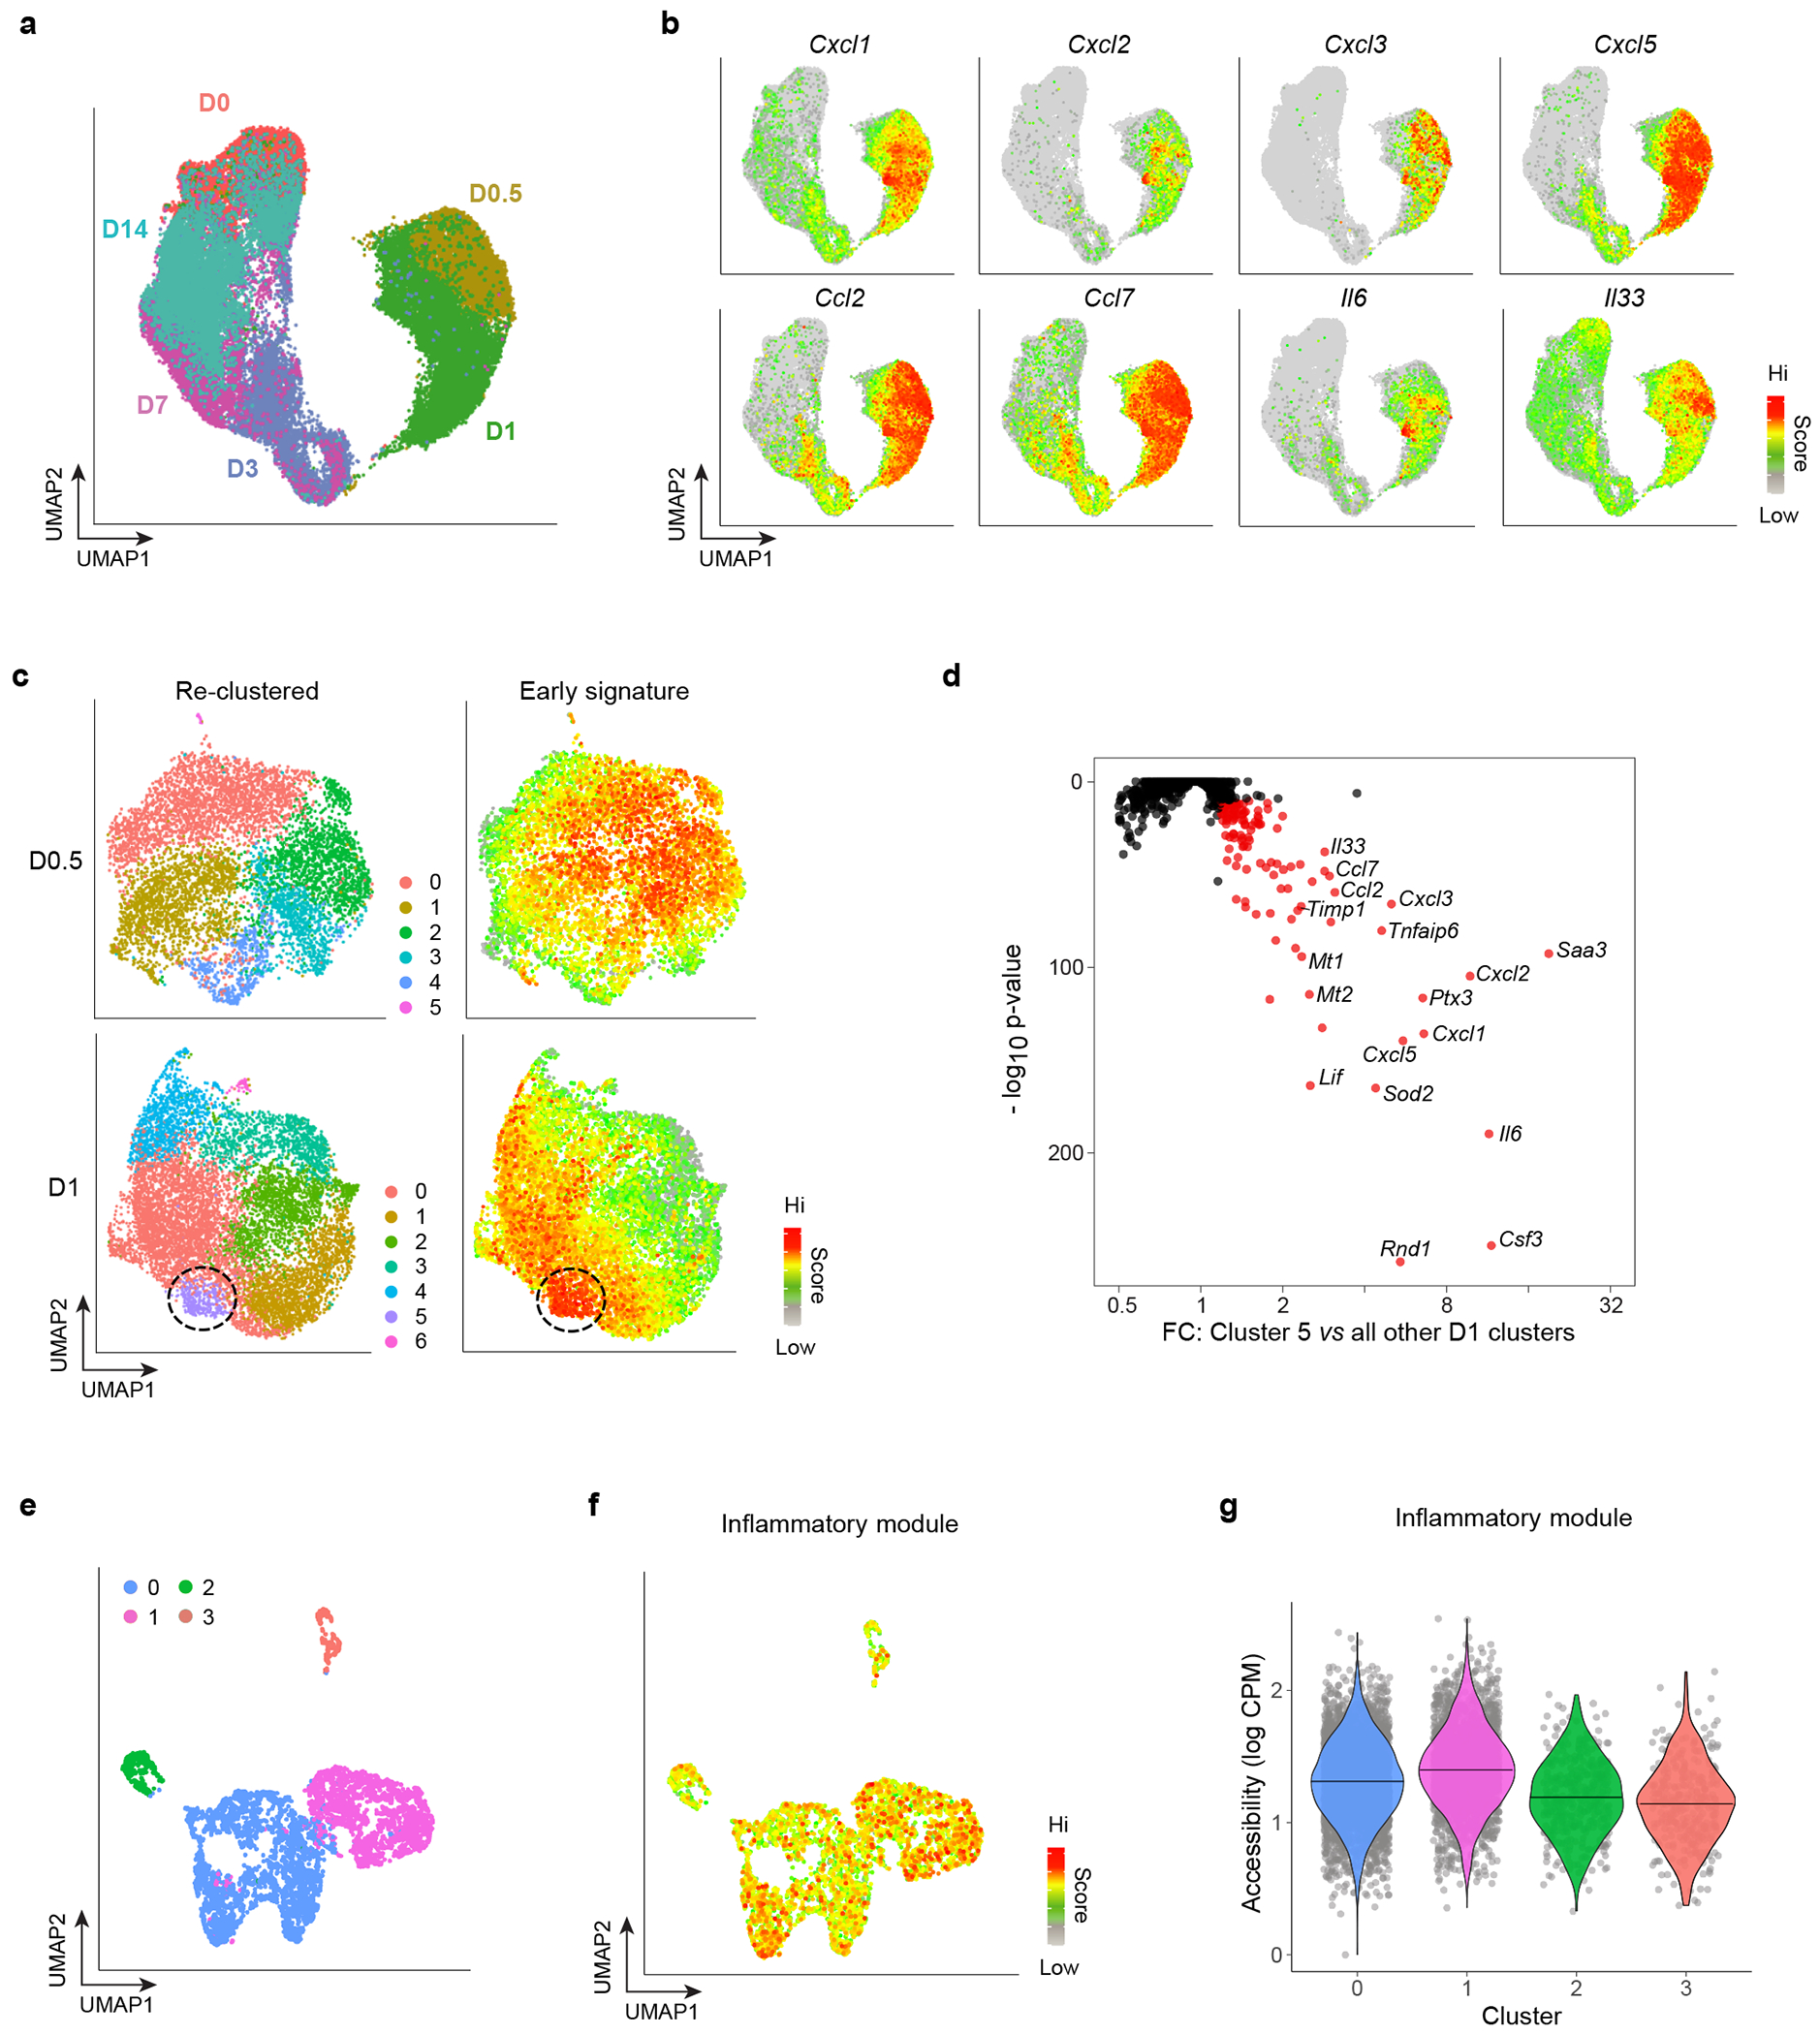
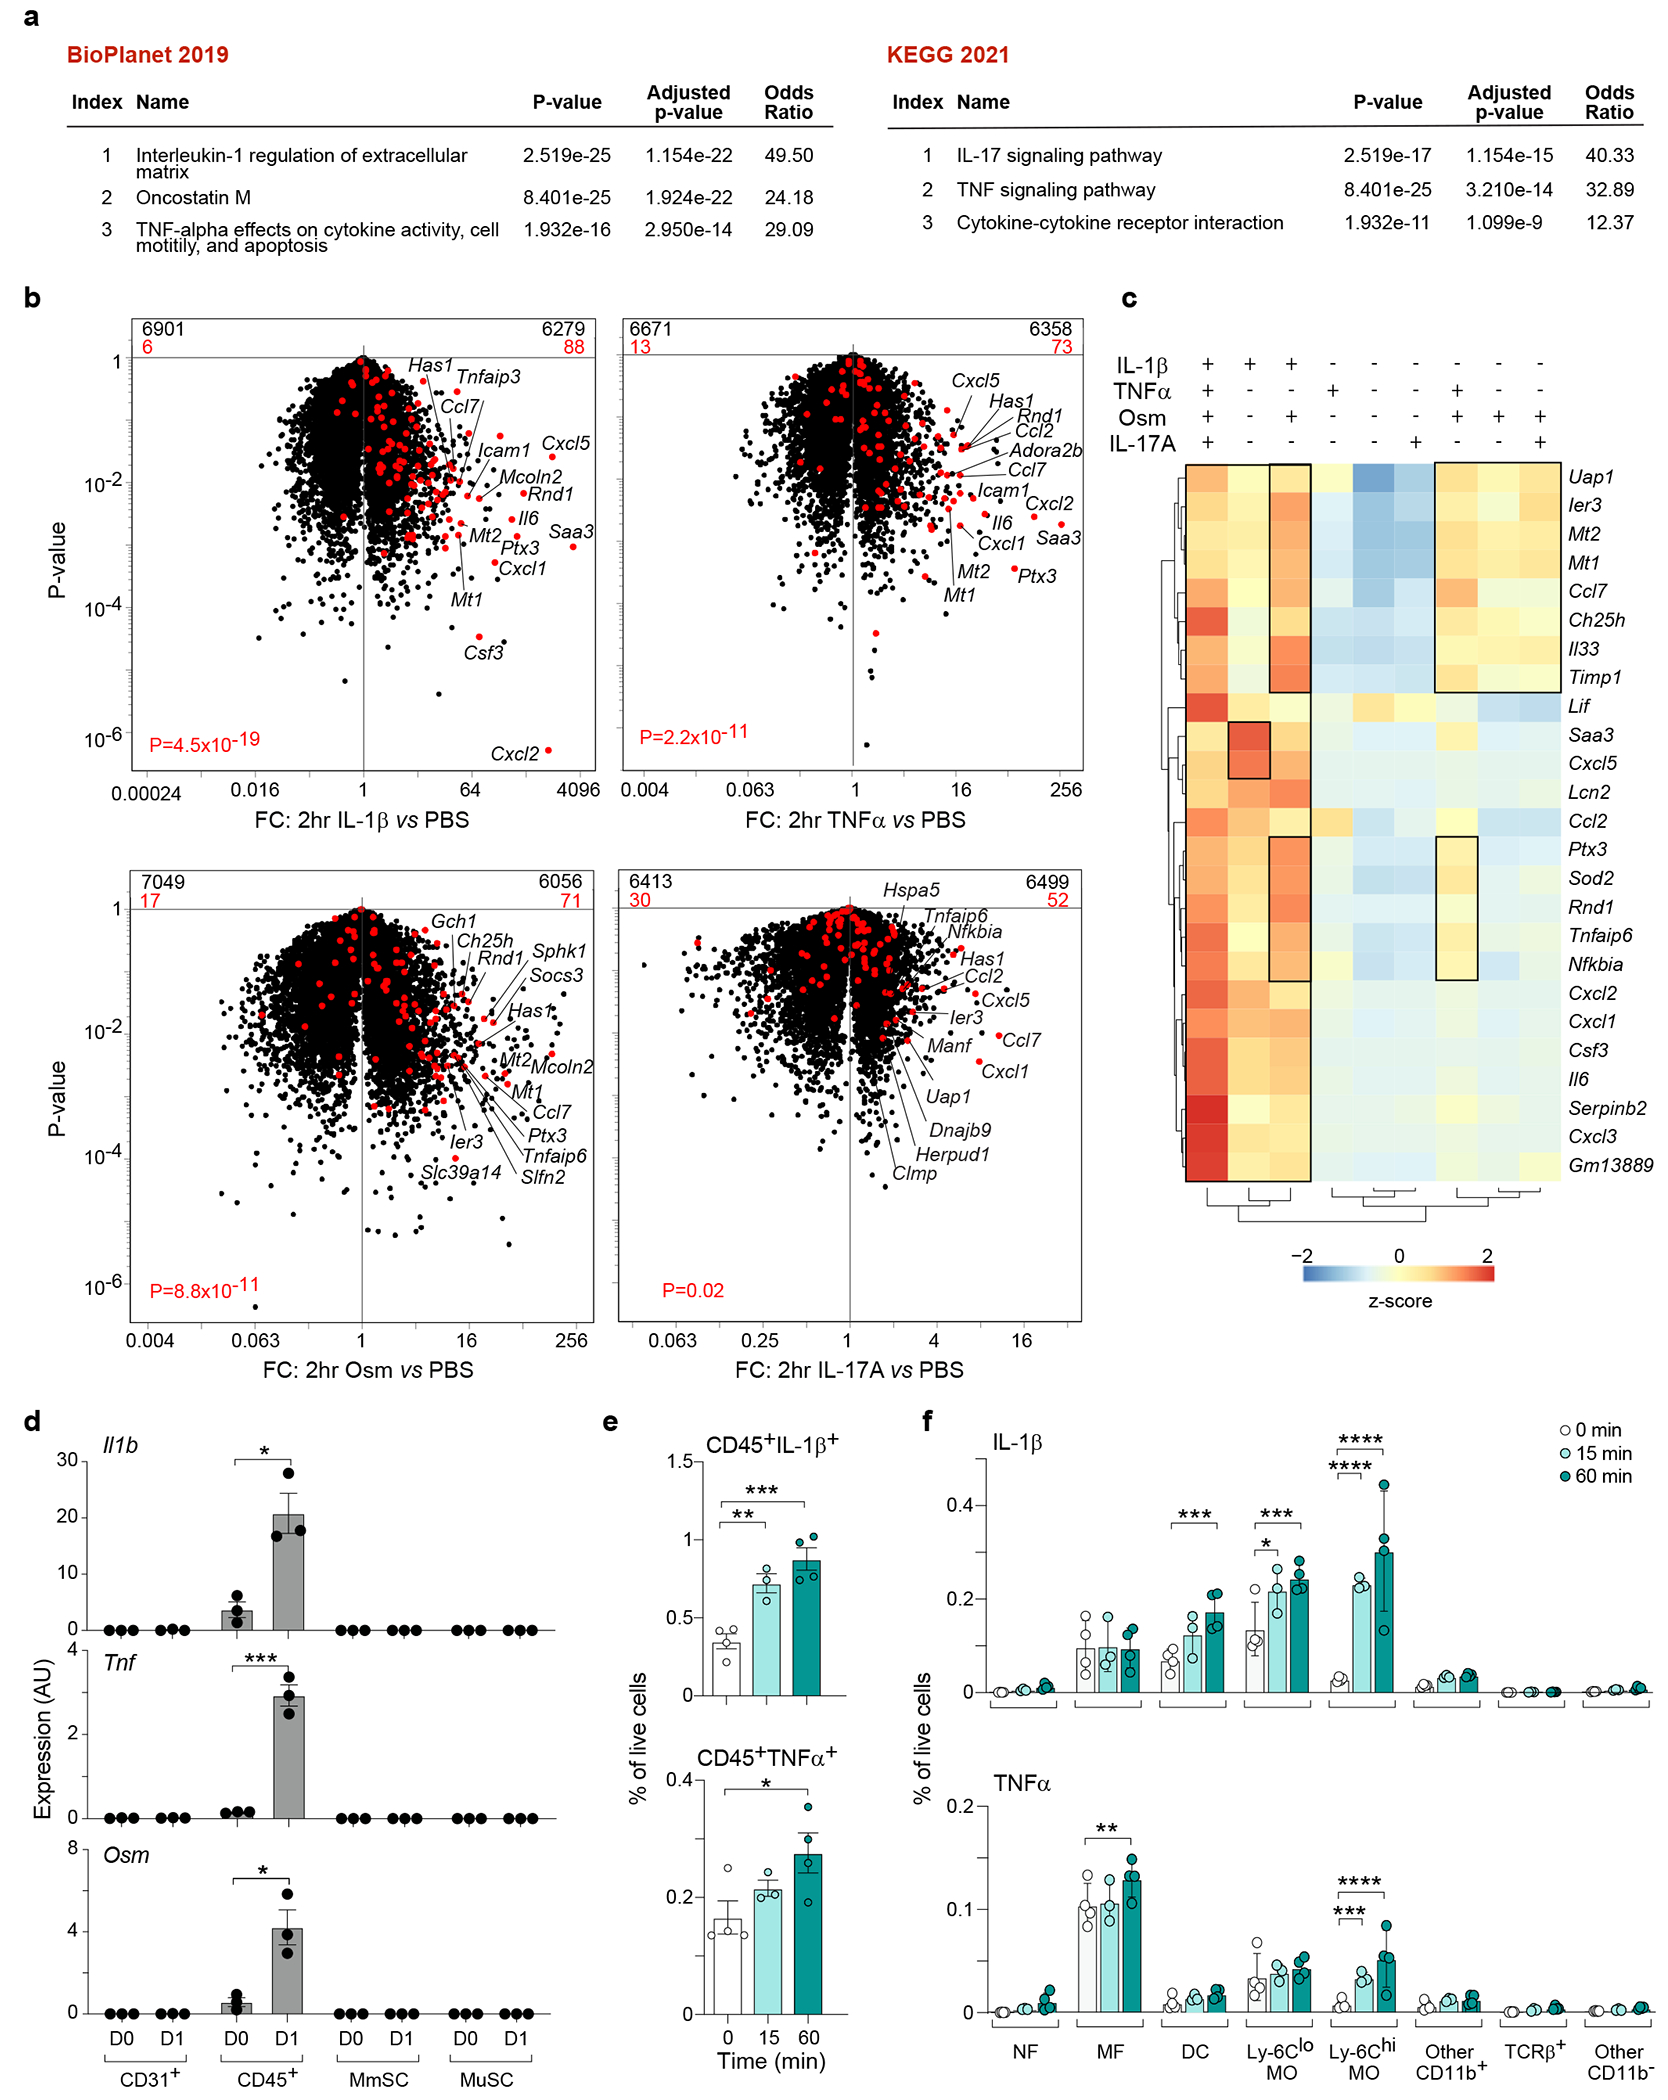
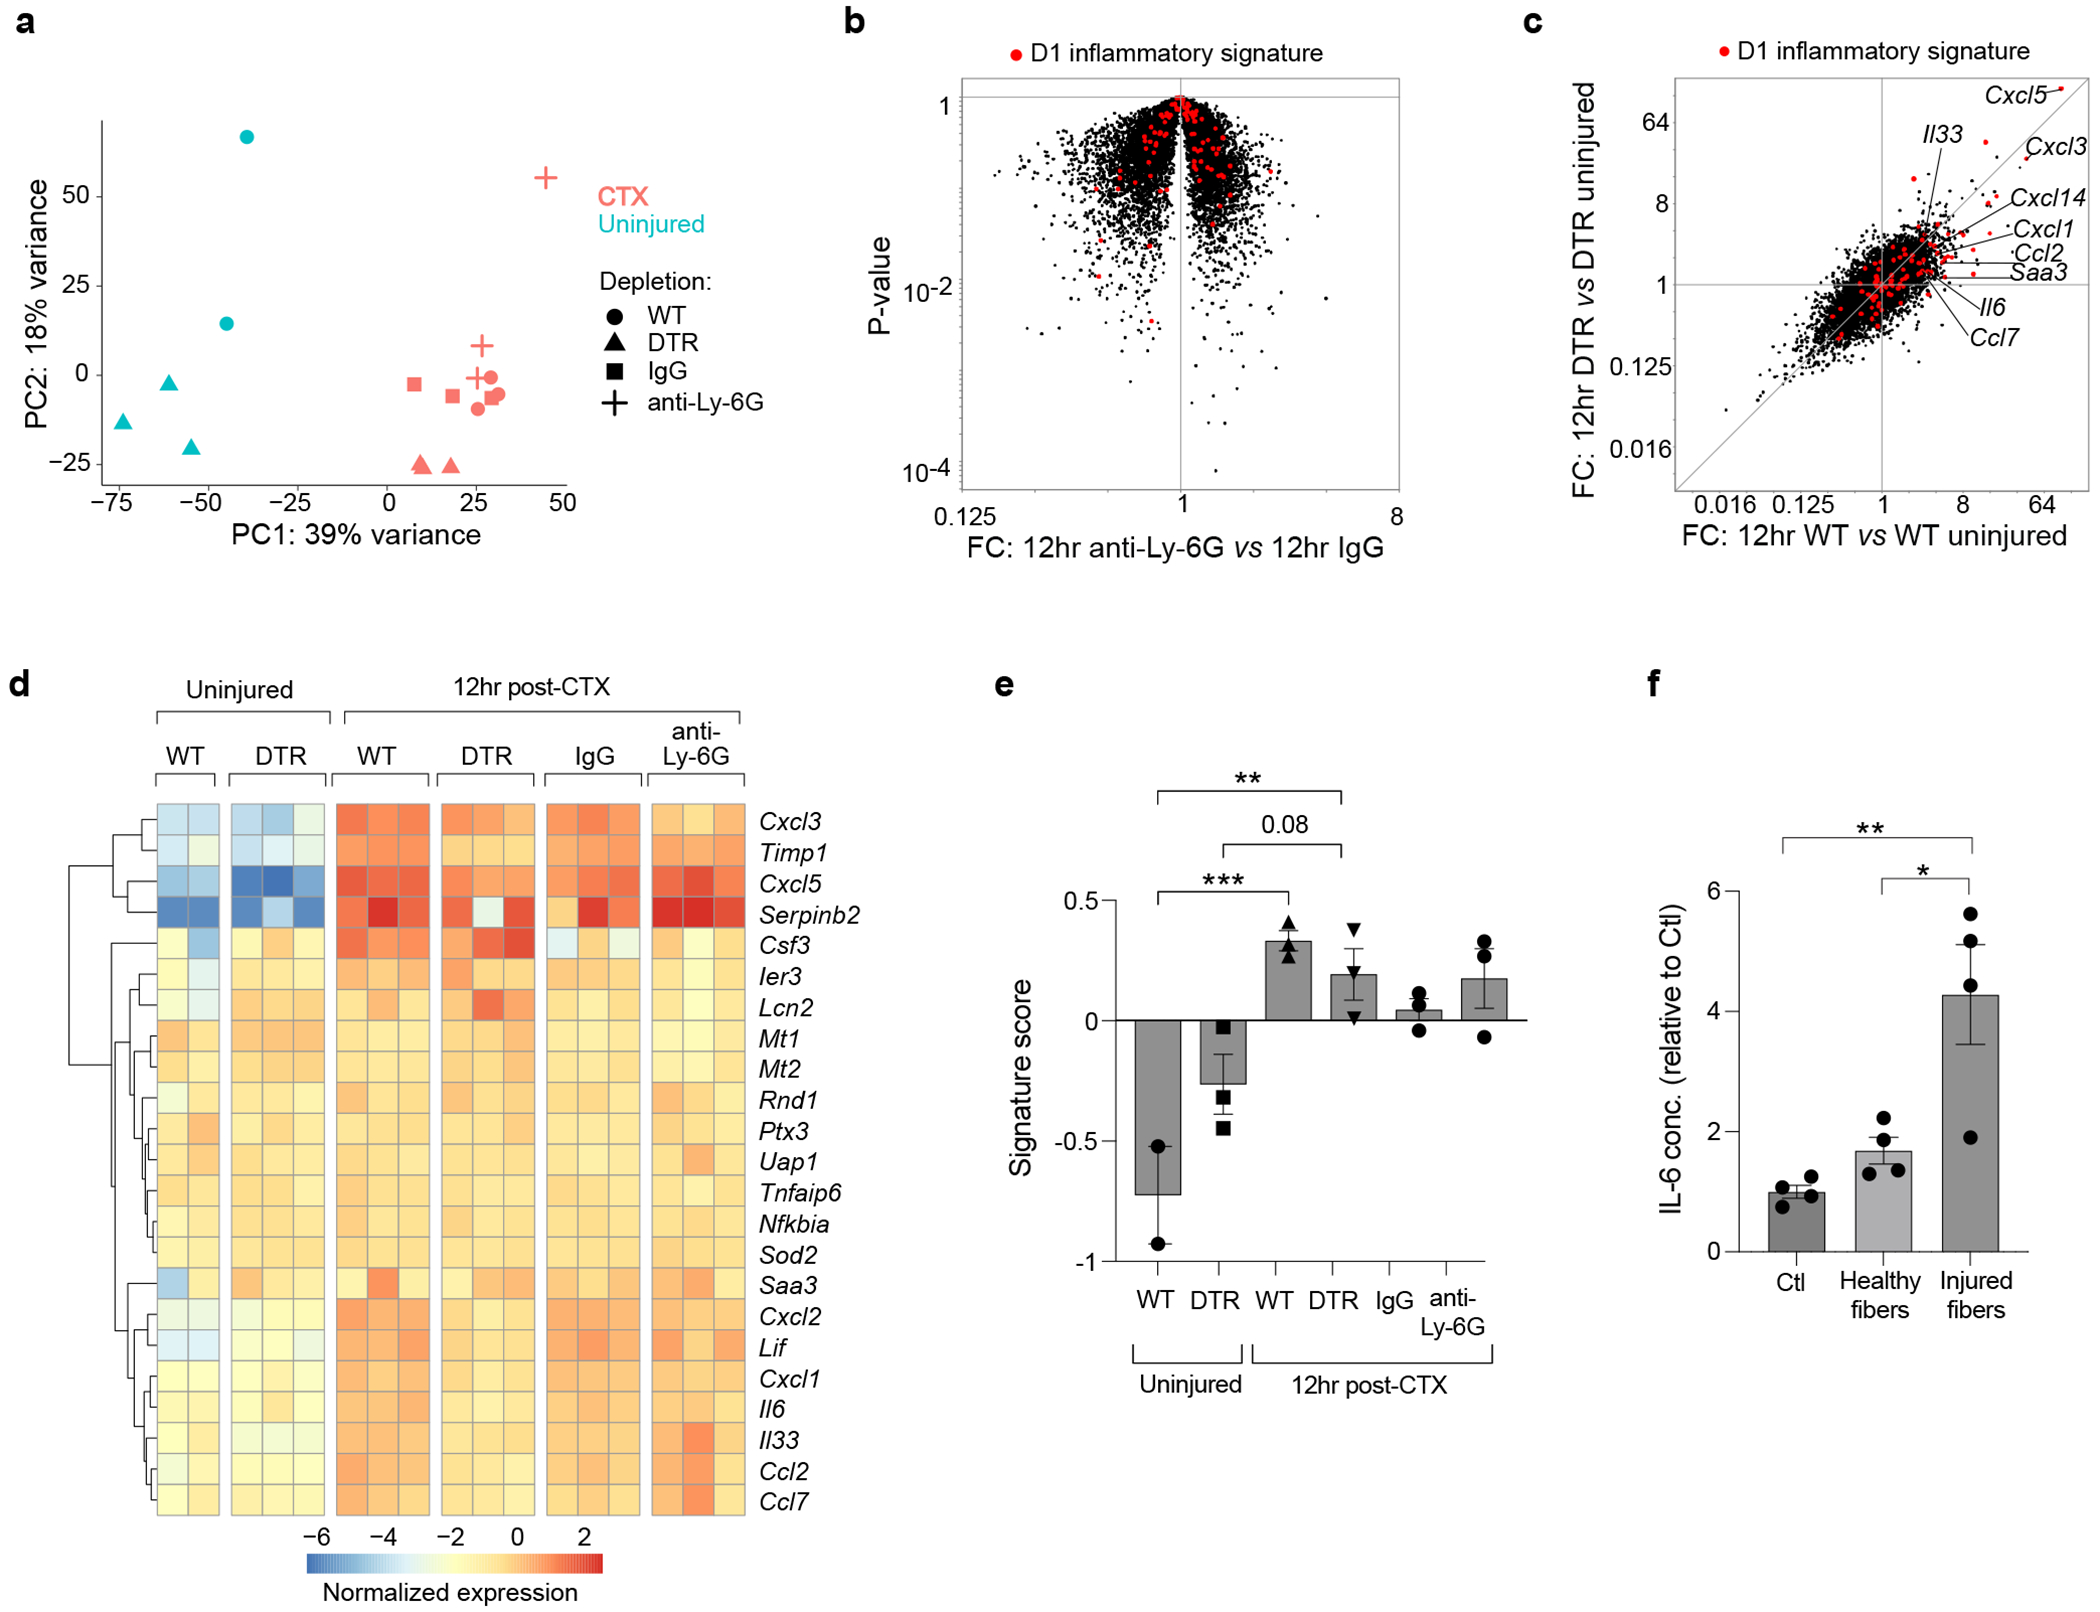
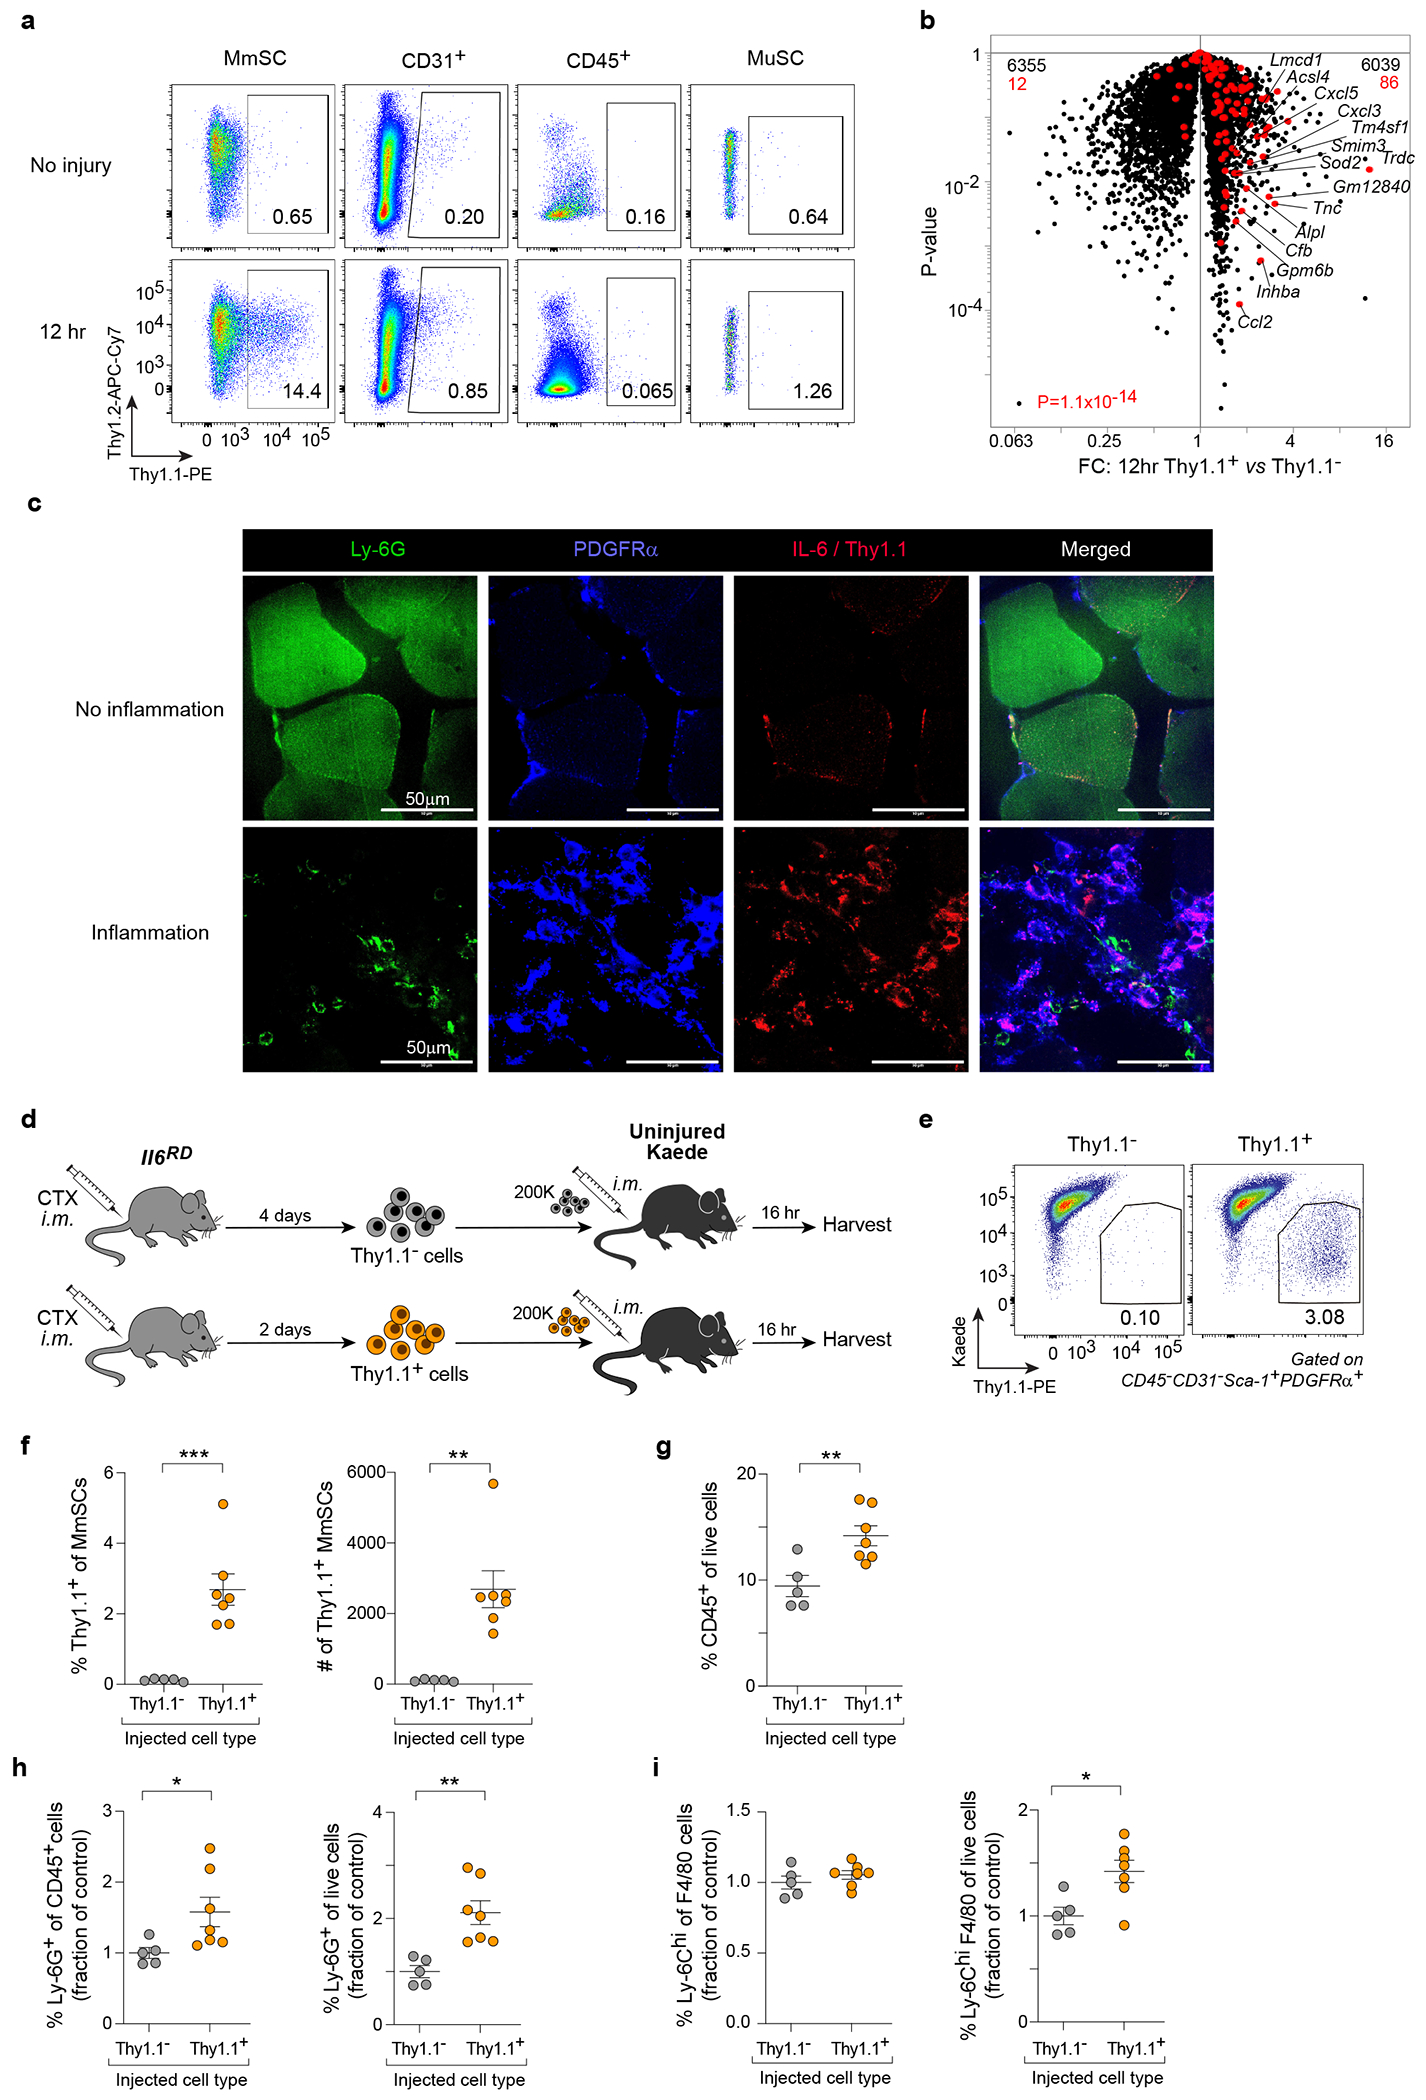
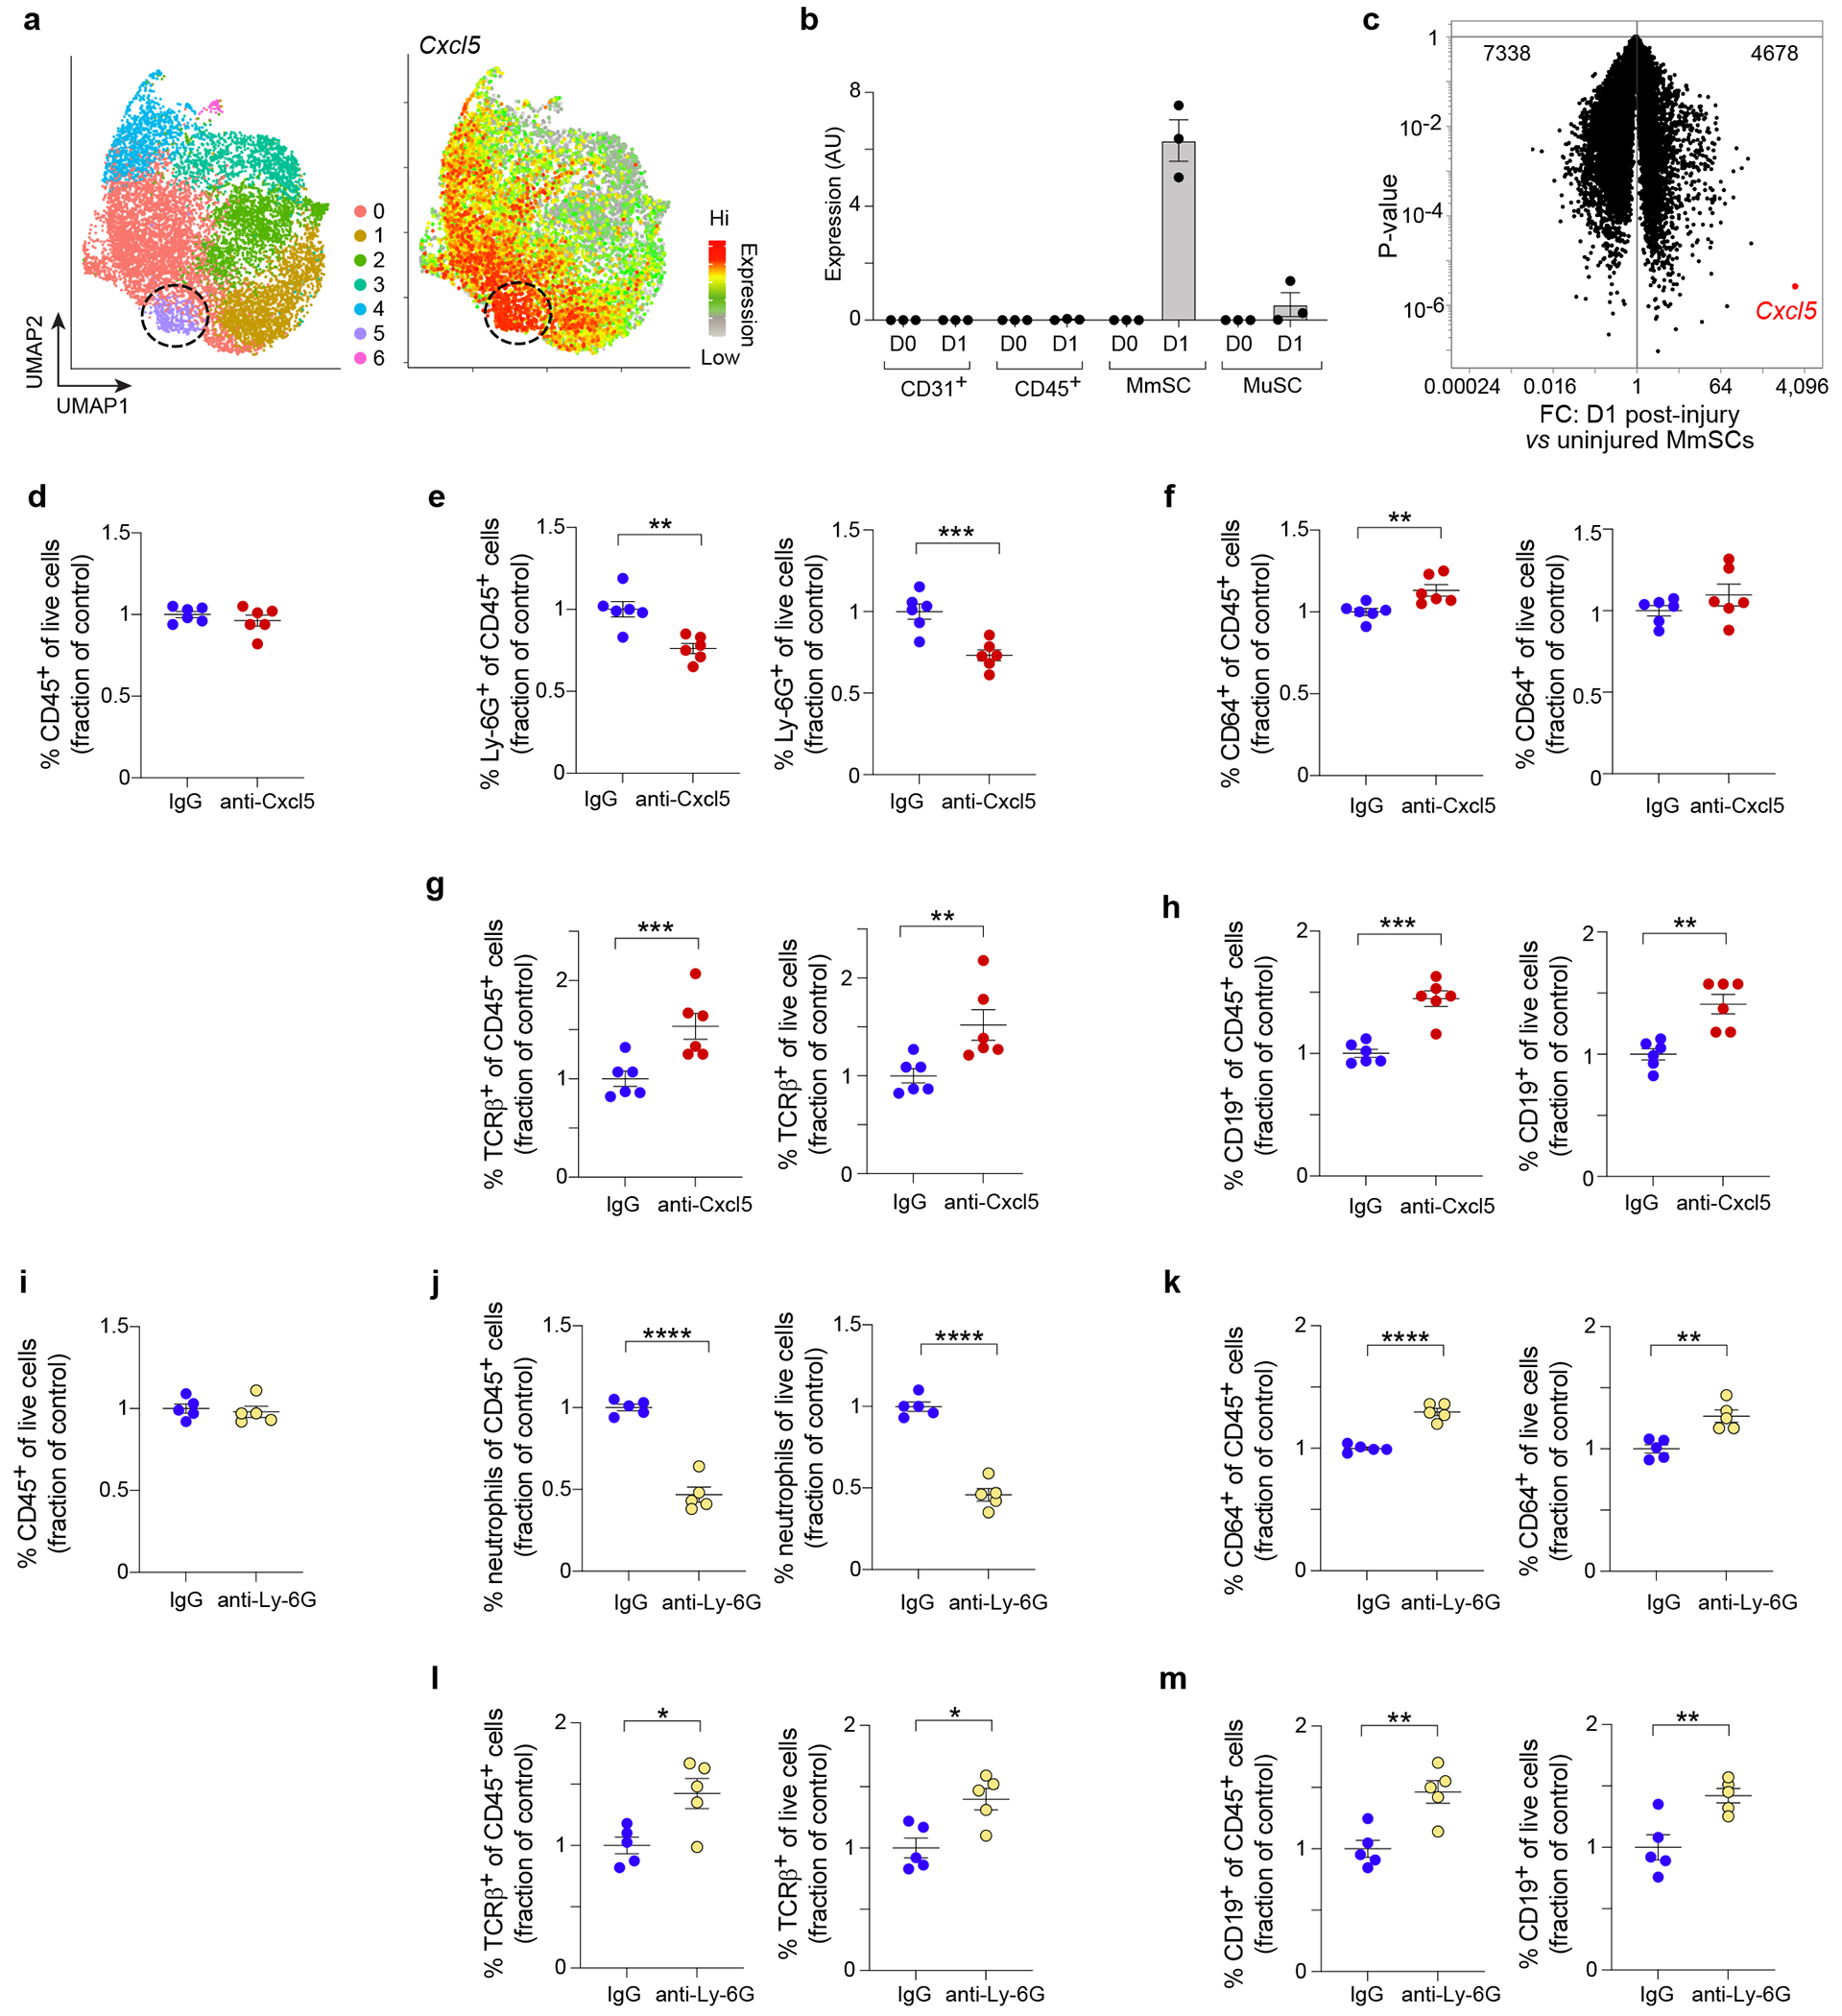
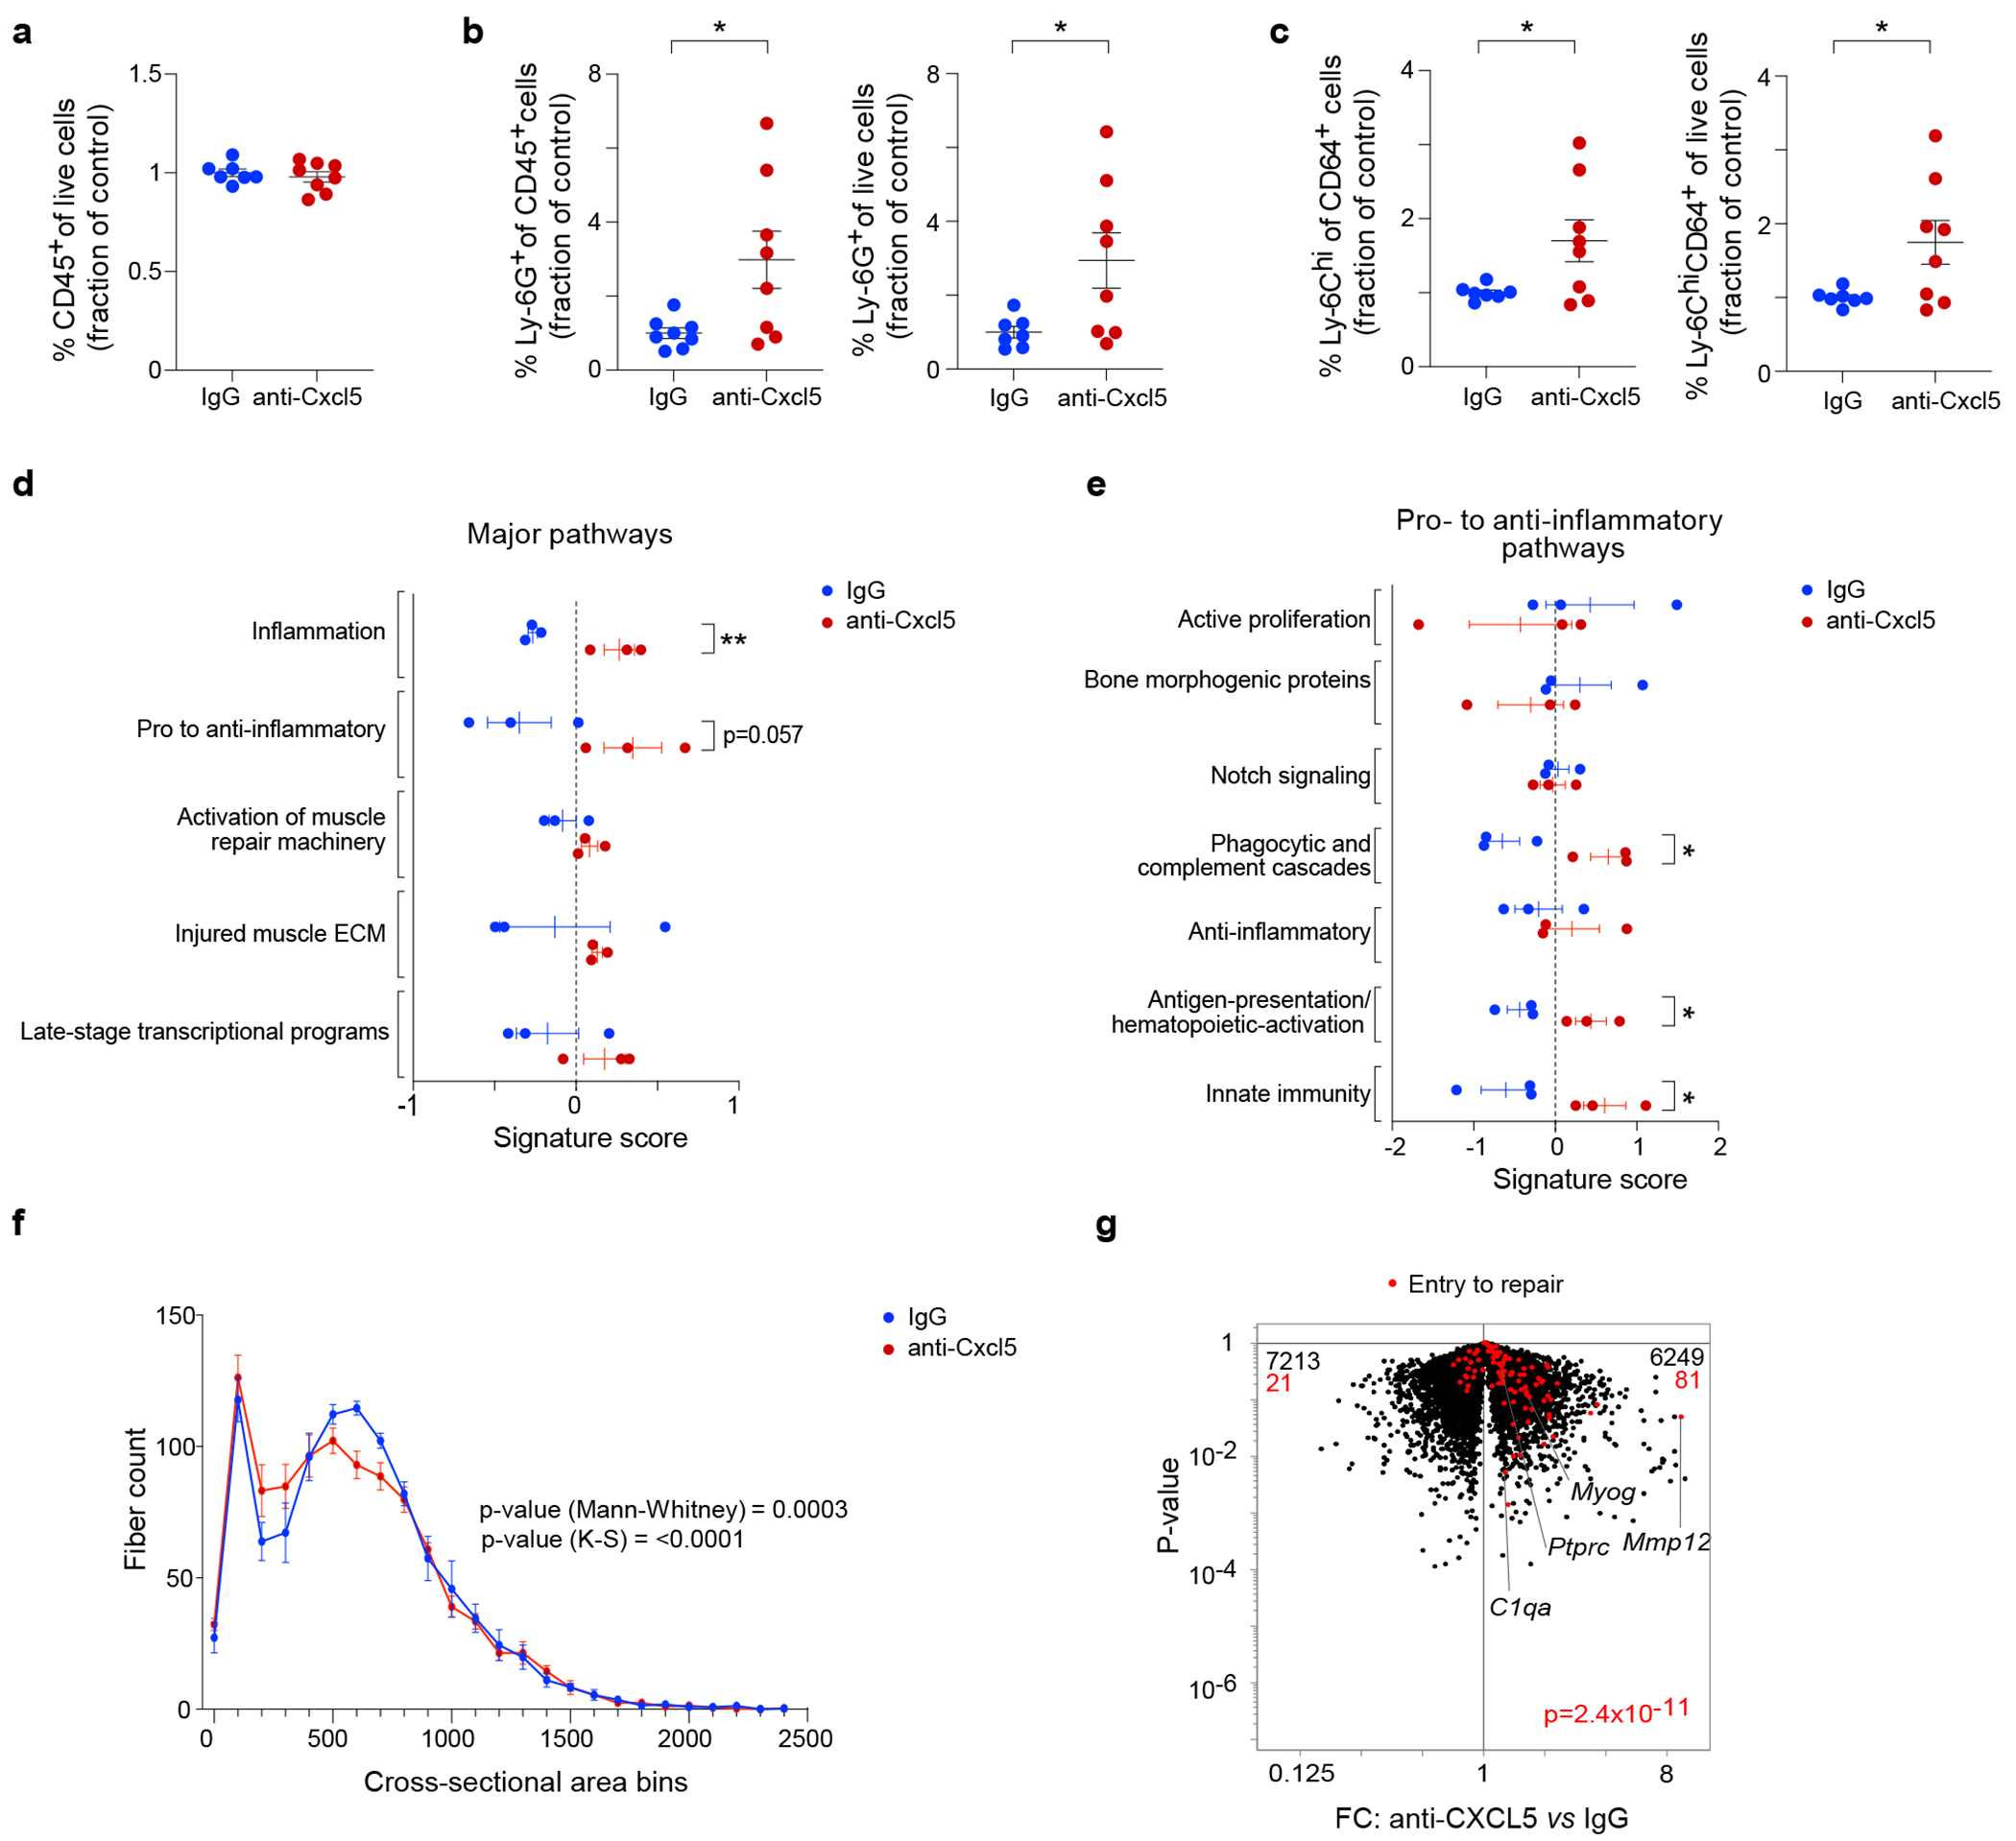
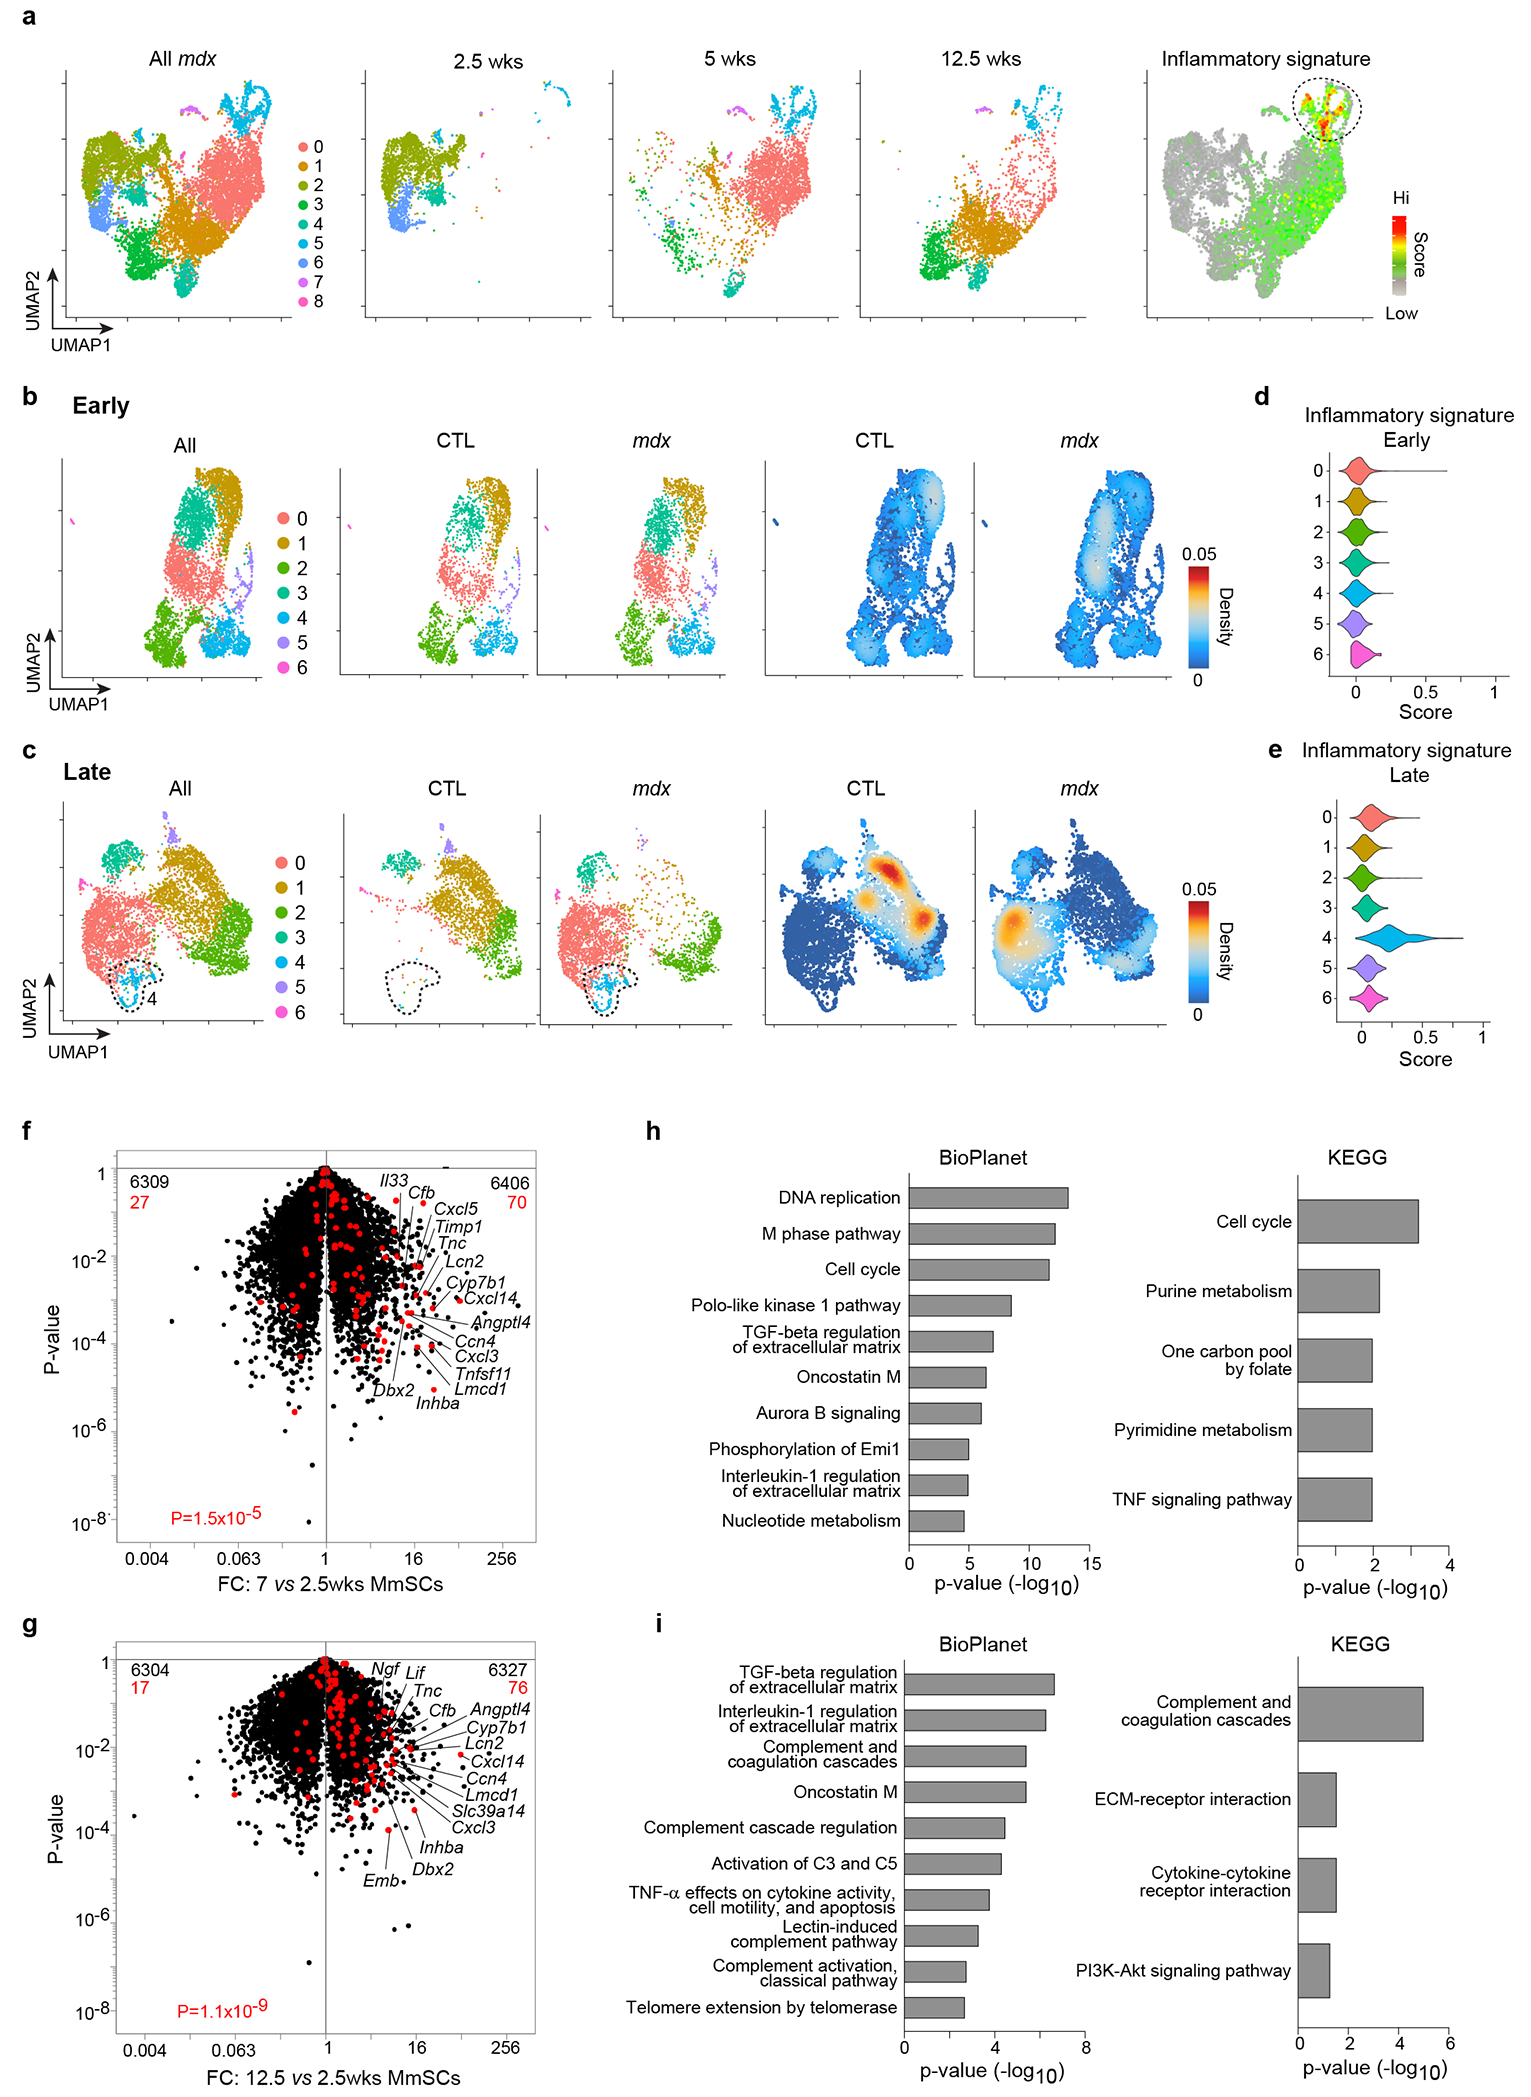
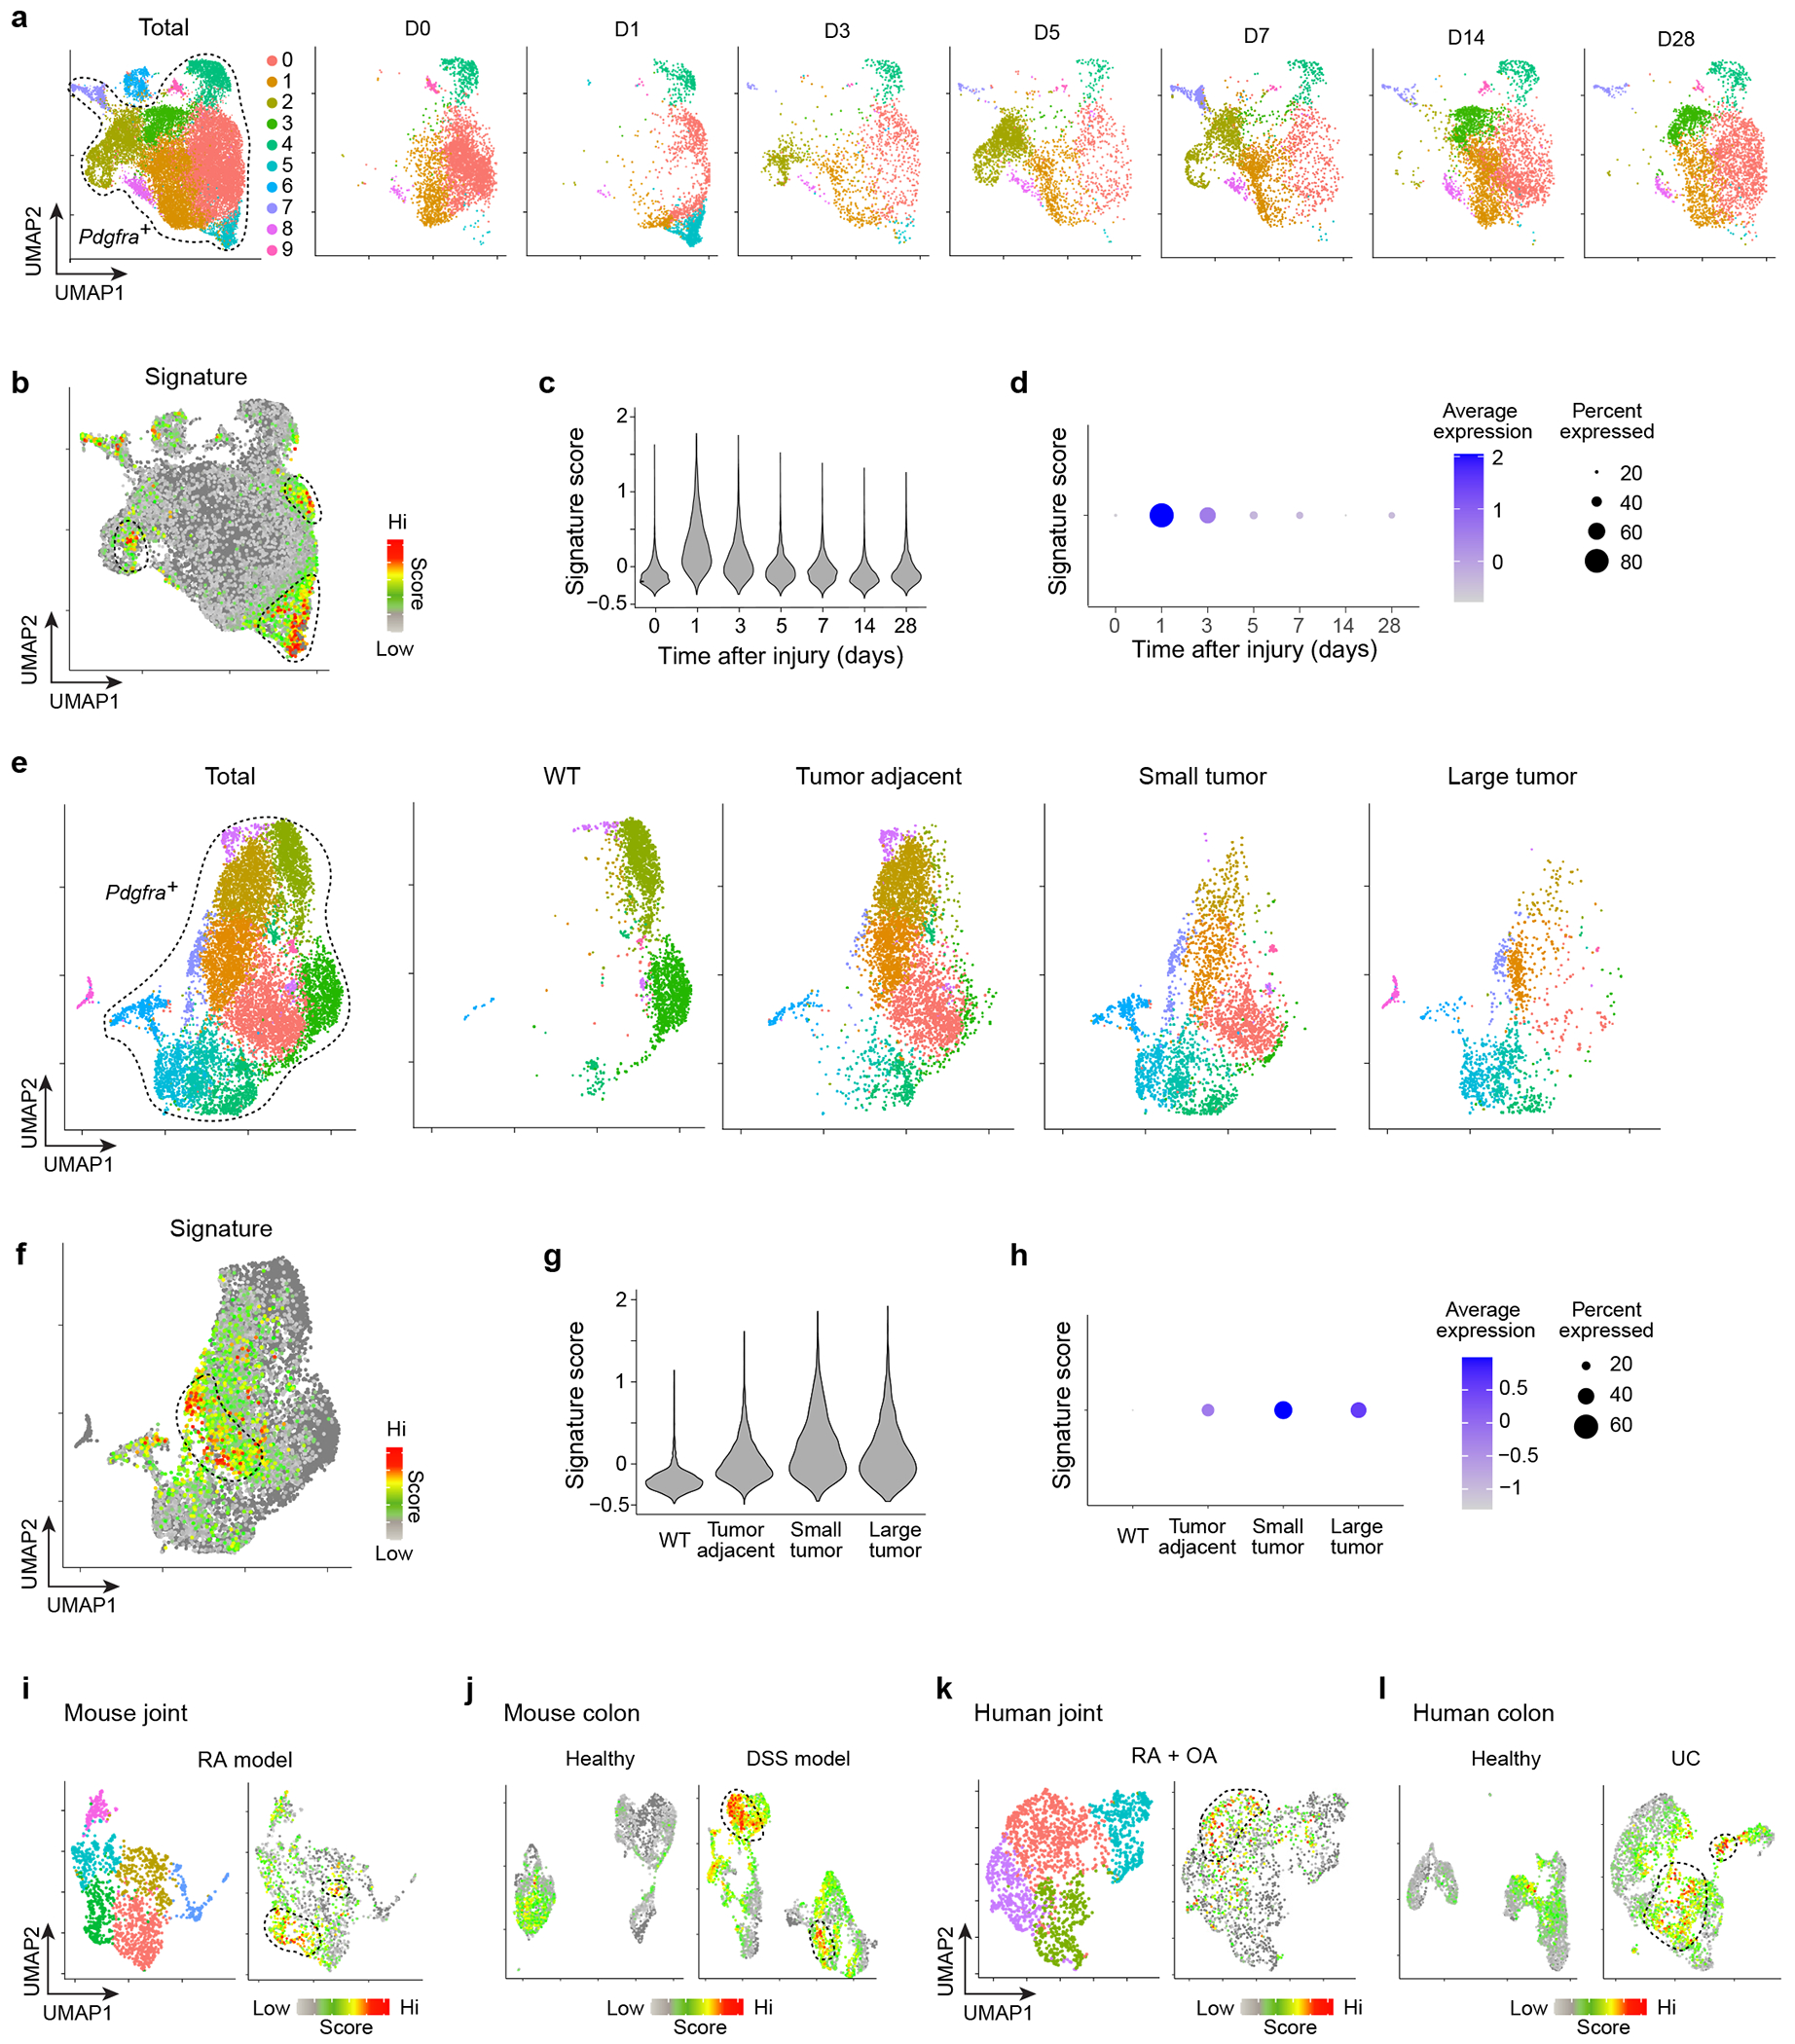
Following acute injury, stromal cells promote tissue regeneration by a diversity of mechanisms. Time-resolved single-cell RNA sequencing of muscle mesenchymal stromal cells (MmSCs) responding to acute injury identified an 'early-responder' subtype that spiked on day 1 and expressed a notable array of transcripts encoding immunomodulators. IL-1β, TNF-α and oncostatin M each strongly and rapidly induced MmSCs transcribing this immunomodulatory program. Macrophages amplified the program but were not strictly required for its induction. Transfer of the inflammatory MmSC subtype, tagged with a unique surface marker, into healthy hindlimb muscle induced inflammation primarily driven by neutrophils and macrophages. Among the abundant inflammatory transcripts produced by this subtype, Cxcl5 was stroma-specific and highly upregulated with injury. Depletion of this chemokine early after injury revealed a substantial impact on recruitment of neutrophils, a prolongation of inflammation to later times and an effect on tissue regeneration. Mesenchymal stromal cell subtypes expressing a comparable inflammatory program were found in a mouse model of muscular dystrophy and in several other tissues and pathologies in both mice and humans. These 'early-responder' mesenchymal stromal cells, already in place, permit rapid and coordinated mobilization and amplification of critical cell collaborators in response to injury.


Conflict of interest statement

COMPETING INTERESTS:

The authors declare no competing financial interests.

Figures

Extended Data Fig. 1:
Extended Data Fig. 1:. Identification of an inflammatory MmSC subtype after acute skeletal-muscle injury.
a, Gating strategy for the cytofluorimetric sorting of MmSCs from hindlimb muscles. b, Heatmap of the top 20 differentially expressed genes in MmSCs from D1 following CTX-induced injury comparing each cluster vis-à-vis all other clusters. c, Violin plot of the expression of the early signature (top 100 transcripts distinguishing early time-points from the rest) across all MmSCs clusters on D1 following CTX-induced injury. d, Density plot of the expression of the indicated genes and gene signatures in MmSCs from D1 following CTX-induced injury. e, Violin plots of the expression of the signatures differentiating the four muscle stromal subtypes from Scott et al. across all MmSCs clusters on D1 following CTX-induced injury.
Extended Data Fig. 2:
Extended Data Fig. 2:. Role of IL-1β, TNFα, Osm in inducing MmSC inflammatory program.
a, Population-level RNAseq of MmSCs isolated at 2 (n = 2), 4 (n = 1) or 8 (n = 2) hrs after ip co-injection of IL-1β, TNFα, OSM and IL-17A vs after PBS injection (n = 2). Expression levels across time-points of the top 20 transcripts from the 100-gene inflammatory signature most differentially expressed. Y-axes plot values in arbitrary units. Each data point represents an individual mouse. b, Violin plots of Il1b, Tnf and Osm expression across cell populations in skeletal muscle on D0.5 after CTX-induced injury. scRNA-seq dataset as per. Cell nomenclature as per original dataset. c, Gating strategy for the cytofluorimetric analysis of diverse immunocyte populations from hindlimb muscles. AU, arbitrary units; APC, antigen-presenting cells; FAPs, fibro/adipogenic progenitors; M1, inflammatory MFs; MuSC, muscle stem cells; PBS, phosphate-buffered saline; FC, fold-change.
Extended Data Fig. 3:
Extended Data Fig. 3:. Impact of the loss of IL-1β, TNFα and OSM on MmSC inflammatory phenotypes.
a, Population-level RNAseq of MmSCs isolated from Il1b knock-out (KO) (n = 3) and wild-type (WT) (n = 2) littermates at D1 following CTX-induced injury. Volcano-plot comparison of the different conditions. The 100-gene inflammatory signature is shown in red, with numbers at the top indicating up- and down-regulated transcripts (in comparison with total transcript numbers in black). b, Same as (a) except B6 mice were treated with a combination of IL-1β, TNFα and OSM neutralizing antibodies or IgG isotype controls. P determined by Chi-squared test.
Extended Data Fig. 4:
Extended Data Fig. 4:. Il6 and Cxcl5 expression in MmSCs at D1 and across skeletal muscle cell populations at homeostasis and various time-points after injury.
a, Violin plot of Il6 expression across all MmSCs clusters on D1 following CTX-induced injury. b, Violin plot of Il6 expression across cell populations in skeletal muscle at homeostasis, as per. c, Violin plot of Cxcl5 expression across all MmSCs clusters on D1 following CTX-induced injury. d, Violin plot of Cxcl5 expression across cell populations in skeletal muscle at homeostasis, as per. M2, reparative MFs; Proliferating IC, proliferating immune cells; other abbreviations as per Extended Data Fig 2. Cell nomenclature as per original dataset.
Extended Data Fig. 5:
Extended Data Fig. 5:. Expression of 100-gene inflammatory signature in immunocytes and MmSCs at homeostasis and upon acute injury.
Fold-change vs fold-change plot of population-level RNAseq of CD45+ cells and MmSCs at D0 and D1 following CTX-induced injury (n = 3 per group). The 100-gene inflammatory signature is shown in red. Abbreviations as per Extended Data Fig 1.
Fig. 1:
Fig. 1:. Identification of an inflammatory MmSC subtype after acute skeletal-muscle injury.
a, UMAP plot of MmSCs from hindlimb muscle of 6- to 8-wk-old male Foxp3GFP mice at homeostasis (D0) and 12 hrs (D0.5), 1 day (D1), 3 days (D3), 7 days (D7) and 14 days (D14) following CTX-induced injury. b, Same UMAP plot as in panel a overlain with expression heatmaps of the indicated transcripts. c, Left: UMAP plot of re-clustered MmSCs from the D0.5 (top) and D1 (bottom) time-points. Right: Superimposition of a signature composed of the top 100 transcripts distinguishing these early time-points from the rest. d, P-value vs fold-change (FC) plot of the transcripts most differentially enriched in D1 cluster 5 compared with the other D1 clusters. e, UMAP of a public scATAC-seq dataset of muscle stromal cells at homeostasis. f, Same UMAP plot as in panel e overlain with a signature score of the accessibility at loci encoding the top 100 differentially expressed transcripts from our D1 cluster 5. g, Violin plot of the signature score in panel f across clusters.
Fig. 2:
Fig. 2:. IL-1β, TNFα and OSM produced by myeloid cells strongly induce the inflammatory MmSC subtype.
a, Pathway analyses of the 100-gene inflammatory signature. b, Volcano-plot comparisons of MmSCs after injections of IL-1β vs PBS (top, left), TNFα vs PBS (top, right), OSM vs PBS (bottom, left) or IL-17A vs PBS (bottom, right). The 100-gene inflammatory signature is shown in red, with the numbers at the top of each plot indicating numbers of up- and down-regulated transcripts (in comparison with total transcript numbers in black). c, Hierarchically clustered heatmap of the top 25 transcripts in the inflammatory signature across the cytokine augmentation conditions. d, Expression of inflammatory-MmSC-inducing transcripts across the major skeletal-muscle-cell compartments at homeostasis (D0) and on D1 after CTX-induced injury. Cytofluorimetrically sorted cells were subject to RNA-seq (n = 3 mice per time-point). e,f, Cytofluorimetric analysis of IL-1β and TNFα levels in CD45+ cells in uninjured hindlimb muscle and at 15 and 60 min post-CTX-injection (n = 4 mice per time-point). Note: one sample was removed from the 15 min group, as it was 3 SDs from the mean. (e) Total CD45+IL-1β+ (top) and CD45+TNFα+ (bottom) cells. (f) Distribution of IL-1β+ (top) and TNFα+ (bottom) cells. Cytofluorimetric data were pooled from two independent experiments. Data are from 7- to 9-wk-old B6 male mice. ip, intraperitoneal; PBS, phosphate-buffered saline; MmSC, muscle mesenchymal stromal cell; MuSC, muscle stem cell; AU, arbitrary units; NF, neutrophil; MF, macrophage; DC, dendritic cell; MO, monocyte; FC, fold-change. Plots with error bars displayed as mean +/− standard error of the mean (SEM). *P < 0.05, **P < 0.01, ***P < 0.001, ****P < 0.0001. One-sided Fisher’s exact test with and without correction by the Benjamini-Hochberg method (panel a), Chi-squared test (panel b), two-tailed unpaired t-test (panel d), one-way ANOVA (panel e), and two-way ANOVA with Dunnett’s multiple comparisons test (panel f).
Fig. 3:
Fig. 3:. Induction of the inflammatory MmSC subtype is not strictly dependent on myeloid cells.
a-e, RNA-seq analysis of cytofluorimetrically sorted MmSCs from uninjured and CTX-injured mice (n = 2-3 mice per group). (a) PCA analysis. (b) Volcano-plot comparisons of MmSCs from B6 male mice treated with anti-Ly6G vs IgG isotype control. The 100-gene inflammatory signature is shown in red. (c) Transcriptomic fold-change/fold-change (FC) plot of MmSCs from CTX-injured vs uninjured Lysmwt X Csf1rLsL-DTR (WT; macrophage-containing) mice (x-axis) vis-a-vis CTX-injured vs uninjured LysmCre X Csf1rLsL-DTR (DTR; macrophage-depleted) mice (y-axis). The 100-gene inflammatory signature is shown in red. (d) Hierarchically clustered heatmap of the top 25 transcripts in the inflammatory signature across the different conditions. (e) Signature score of the 100-gene inflammatory MmSC gene set. Scores calculated as per materials and methods. f, Freshly-isolated MmSCs were cultured alone (Ctl) or co-cultured with muscle fibers that were pre-treated either with vehicle (healthy fibers) or CTX (injured fibers), and IL-6 levels in the culture supernatants were determined by ELISA (2 independent experiments). Data are from 7- to 9-wk-old male mice. DTR, diphtheria toxin receptor. Plots with error bars displayed as mean +/− SEM. *P < 0.05, **P < 0.01, ***P < 0.001. Chi-squared test (panel b) and one-way ANOVA with Tukey’s multiple comparisons test (panels e and f).
Fig. 4:
Fig. 4:. Transfer of inflammatory MmSCs can induce inflammation.
a, Cytofluorometric quantification of Thy1.1 expression across the major skeletal-muscle-cell compartments in Il6RD x Pdgfra-Cre mice at homeostasis and 12 hrs following CTX-induced injury. b, Volcano-plot comparison of transcripts expressed by Thy1.1+ and Thy1.1 MmSCs 12 hrs after CTX injection (n = 3). The 100-gene inflammatory signature is shown in red; numbers at the top indicate up- and down-regulated transcripts (in comparison with total transcript numbers in black). c, Immunofluorescence imaging of the indicated markers in muscle sections of Il6RD x Pdgfra-Cre mice 2 days following CTX-induced injury (60X magnification). Upper panels: representative images of areas with no NF infiltration (no inflammation). Lower panels: representative images of areas with high NF infiltration (inflammation). Experiment repeated twice with similar results. d, Schematic of the adoptive-transfer design used to generate the data in (panels e-i). e-i, Cytofluorometric profiling of cells from hindlimb muscles of recipient mice following Thy1.1+ (n = 7) vs Thy1.1 (n = 5) MmSC transfer. (e) Representative flow plots; (f) summary quantification of Thy1.1+ cells; (g) quantification of CD45+ cells, (h) NFs and (i) Ly-6Chi MFs. Transfer data were pooled from two independent experiments. Each data point represents an individual mouse within a group. All data are from 7- to 9-wk-old male mice. FC, fold-change; CTX, cardiotoxin; im, intramuscular; other abbreviations as per Fig 2. Plots with error bars displayed as mean +/− SEM. *P < 0.05, **P < 0.01, ***P < 0.001 by a two-tailed unpaired t-test except for panel b, in which a Chi-squared test was performed.
Fig. 5:
Fig. 5:. CXCL5 is a stroma-specific chemokine that promotes NF influx following CTX-induced injury.
a, UMAP plot of MmSCs from D1 following CTX-induced injury (left) overlain with a heatmap of Cxcl5 expression (right). b, Cxcl5 expression across the major skeletal-muscle-cell compartments at homeostasis (D0) and on D1 after CTX-induced injury (n = 3 mice per time-point). c, Volcano-plot comparison of D0 vs D1 MmSCs (n = 3 mice per time-point). Cxcl5 is highlighted in red. Numbers at the top indicate total genes up- and down-regulated in response to injury. d-h, Anti-CXCL5 mAb or IgG was administered 12 hrs before and coincident with CTX injection, and cells from hindlimb muscles were cytofluorimetrically profiled one day after injury (n = 6 per group). Quantification of (d) total CD45+ cells, (e) NFs, (f) MFs, (g) αβ T cells and (h) B cells. i-m, Anti-Ly-6G mAb or IgG was administered 2 days, 1 day and coincident with CTX injection, and cells from hindlimb muscles were cytofluorimetrically profiled one day after injury (n = 5 per group). Quantification of (i) total CD45+ cells, (j) NFs, (k) MFs, (l) αβ T cells and (m) B cells. Since the depleting antibody covered the Ly-6G epitope, NFs were defined as CD45+CD11b+CD64CD11cLy-6CGR-1+. Ab-mediated depletion data were pooled from two independent experiments. Besides panels a and c, each data point represents an individual mouse within a group. All, except the scRNA-seq, data derived from 7- to 9-wk-old B6 male mice. Abbreviations as per Figs 3 and 4. Plots with error bars displayed as mean +/− SEM. *P < 0.05, **P < 0.01, ***P < 0.001, ****P < 0.0001 by a two-tailed unpaired t-test. Data were normalized to the IgG group as repeated experiments had different control setpoints.
Fig. 6:
Fig. 6:. CXCL5 is necessary for effective tissue repair.
Anti-CXCL5 mAb (n = 8) or control IgG (n = 7) was injected during the earliest stage of recovery after CTX-injury (D-0.5, D0, D1 and D2) and at D7, hindlimb muscle was profiled by cytofluorimetry. a, Total CD45+ cells. b, NFs. c, Ly-6Chi MFs. d, e, Transcriptional analyses of whole muscle tissue at D7 (n = 3 mice per condition). Signature scores of major (d) and pro- to anti-inflammatory (e) pathways, as per. Scores calculated as per materials and methods. f, Histogram of the cross-sectional areas of centrally-nucleated muscle fibers at D7 (n = 5 mice per condition). g, Volcano plot comparing whole-muscle transcripts from anti-Cxcl5- and control-IgG-treated mice overlain with a signature of genes ordinarily shut down during the transition from inflammation to repair. Except for panels f and g, each data point represents an individual mouse within a group. All data are from 7- to 9-wk-old B6 male mice. Plots with error bars displayed as mean +/− SEM. *P < 0.05, **P < 0.01 by a two-tailed unpaired t-test except for panel f, in which two-tailed Mann-Whitney and Kolmogorov-Smirnov tests were performed, and panel g in which a Chi-squared test was performed. Data were normalized to the IgG group as repeated experiments had different control setpoints.
Fig. 7:
Fig. 7:. Identification of an inflammatory MmSC subtype in a mouse model of muscular dystrophy.
a-e, scRNA-seq of MmSCs from 2.5-, 5- and 12.5-wk-old mdx mice, and from 2.5- and 12.5-wk-old CTL mice. (a) UMAP plots of all cells from mdx mice (leftmost), cells from each time-point (three middle panels), and cells superimposed with the 100-gene CTX-inflammatory signature (rightmost). UMAP plots of mdx and CTL cells from (b) 2.5-wk-old mice (“Early”) and from (c) 12.5-wk-old mice (“Late”). Left: both genotypes; center: individual genotypes; right: density plots of individual genotypes. Violin plots of the CTX-inflammatory signature for the (d) “Early” and (e) “Late” clusters. f-i, Population-level RNA-seq of MmSCs from 2.5-, 7- and 12.5-wk-old mdx mice. Volcano-plot comparisons of MmSCs from (f) 7- vs 2.5-wk-old and (g) 12.5- vs 2.5-wk-old mice (n = 3 per time-point). 100-gene inflammatory signature is shown in red; numbers at the top indicate up- and down-regulated transcripts (in comparison with total transcript numbers in black). Pathway analyses of transcripts significantly up-regulated (> 2x, P < 0.05) in MmSCs from (h) 7-wk-old and (i) 12.5-wk-old mice compared with those from 2.5-wk-old mice. CTL, control; FC, fold-change. P determined by a Chi-squared test (panels f and g) and Fisher’s exact test corrected with the Benjamini-Hochberg method (panels h and i).
Fig. 8:
Fig. 8:. The inflammatory MmSC module appears in numerous tissues and pathologies in both mice and human datasets.
a-d, scRNA-seq of mouse heart tissue at homeostasis (D0) and at D1, D3, D5, D7, D14 and D28 following myocardial infarction. (a) UMAP plots of Pdgfra+ cells as a whole and by time-point. (b) Same plot as (a) overlain with the 25-gene CTX-inflammatory signature. (c) Violin plot and (d) dot-plot of the inflammatory signature across time-points. e-h, Mouse scRNA-seq of Pdgfra+ cells from healthy pancreas tissue and pancreatic ductal adenocarcinoma tumors at various stages of tumor progression. Organized as per (a-d). i, Mouse scRNA-seq of Pdgfra+ cells from the inflamed joints of the serum transfer induced arthritis model. UMAP plot of all cells (left) and cells overlain with the 25-gene CTX-inflammatory signature (right). j, Mouse scRNA-seq of Pdgfra+ cells from colons of healthy mice and mice treated with dextran sodium sulfate (DSS). UMAP plot of cells from healthy (left) and DSS-treated (right) mice overlain with the 25-gene CTX-inflammatory signature. k, scRNA-seq of PDGFRA+ cells from patients with rheumatoid (RA) or osteo (OA) arthritis. UMAP plot of all cells (left) and cells overlain with the 25-gene CTX-inflammatory signature (right). l, scRNA-seq of PDGFRA+ cells from colonic samples of healthy individuals and ulcerative colitis (UC) patients. UMAP plot of cells from healthy colon (left) and UC-colon (right) overlain with the 25-gene CTX-inflammatory signature. WT, wild-type mice.

References

    1. Robertson TA, Grounds MD, Mitchell CA, & Papadimitriou JM Fusion between myogenic cells in vivo: an ultrastructural study in regenerating murine skeletal muscle. J Struct. Biol 105, 170–182 (1990). - PubMed
    1. Kuang S, Kuroda K, Le GF, & Rudnicki MA Asymmetric self-renewal and commitment of satellite stem cells in muscle. Cell 129, 999–1010 (2007). - PMC - PubMed
    1. Sacco A et al. Self-renewal and expansion of single transplanted muscle stem cells. Nature 456, 502–506 (2008). - PMC - PubMed
    1. von Maltzahn J, Jones AE, Parks RJ, & Rudnicki MA Pax7 is critical for the normal function of satellite cells in adult skeletal muscle. Proc Natl Acad Sci U S A 110, 16474–16479 (2013). - PMC - PubMed
    1. Sambasivan R et al. Pax7-expressing satellite cells are indispensable for adult skeletal muscle regeneration. Development 138, 3647–3656 (2011). - PubMed

ONLINE REFERENCES

    1. Bettelli E et al. Reciprocal developmental pathways for the generation of pathogenic effector TH17 and regulatory T cells. Nature 441, 235–238 (2006). - PubMed
    1. Tomura M et al. Monitoring cellular movement in vivo with photoconvertible fluorescence protein “Kaede” transgenic mice. Proc Natl Acad Sci U S A 105, 10871–10876 (2008). - PMC - PubMed
    1. Wang K et al. Neuronal, stromal, and T-regulatory cell crosstalk in murine skeletal muscle. Proc. Natl. Acad. Sci. U. S. A 117, 5402–5408 (2020). - PMC - PubMed
    1. Liu L, Cheung TH, Charville GW, & Rando TA Isolation of skeletal muscle stem cells by fluorescence-activated cell sorting. Nat. Protoc 10, 1612–1624 (2015). - PMC - PubMed
    1. Hao Y et al. Integrated analysis of multimodal single-cell data. Cell 184, 3573–3587 (2021). - PMC - PubMed

LinkOut - more resources