. 2023 Dec;24(12):2135-2149.
doi: 10.1038/s41590-023-01658-z. Epub 2023 Nov 6.

Harnessing CD3 diversity to optimize CAR T cells

Affiliations

Harnessing CD3 diversity to optimize CAR T cells

Rubí M-H Velasco Cárdenas et al. Nat Immunol. 2023 Dec.

Abstract

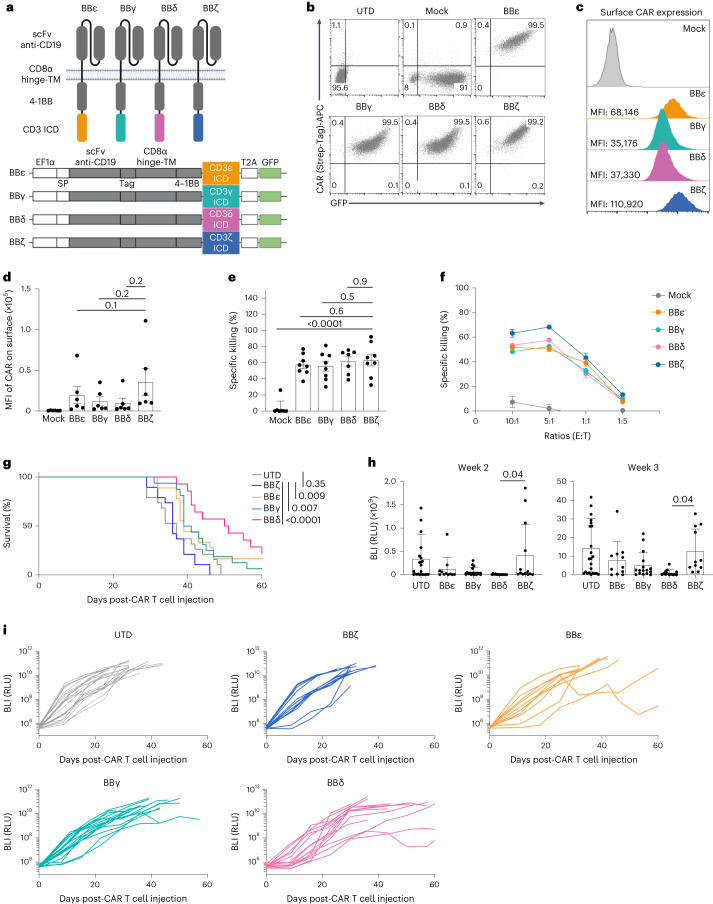
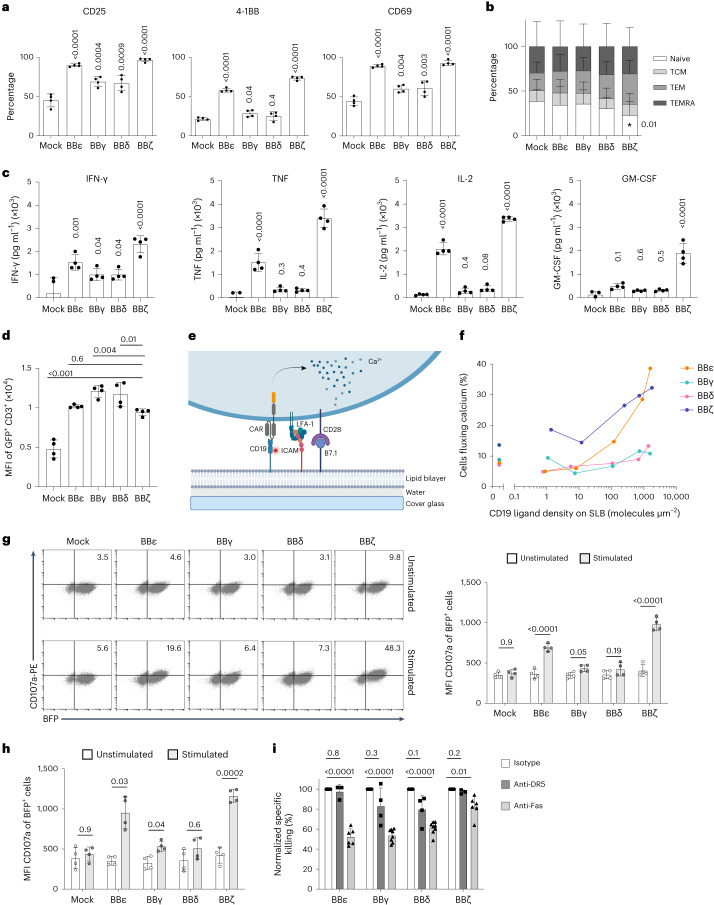
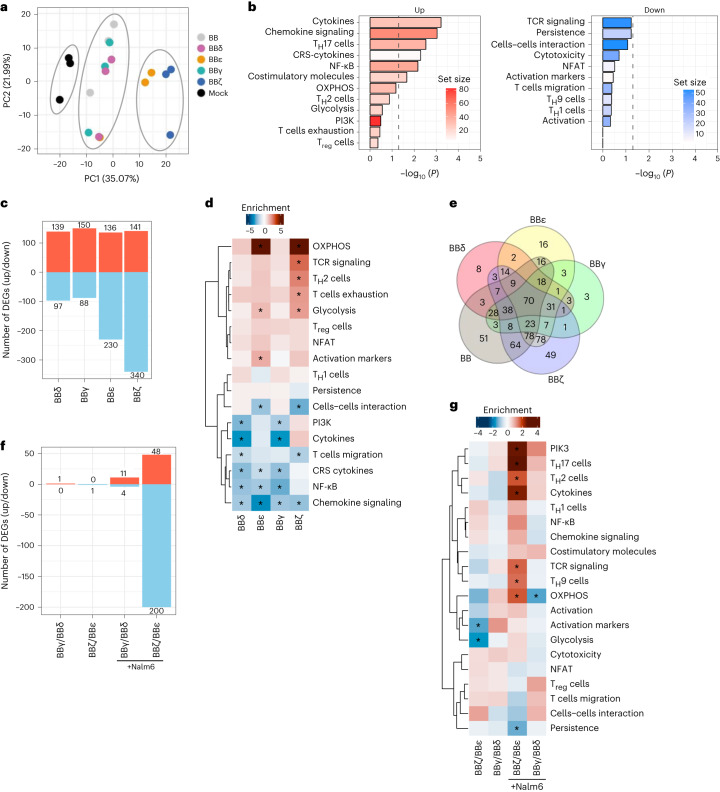
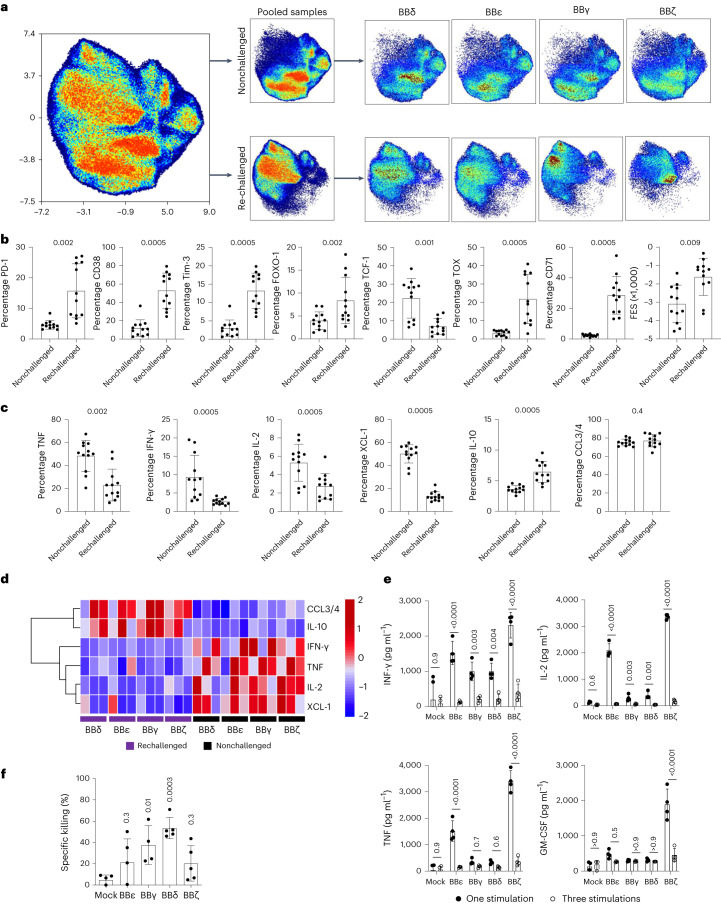
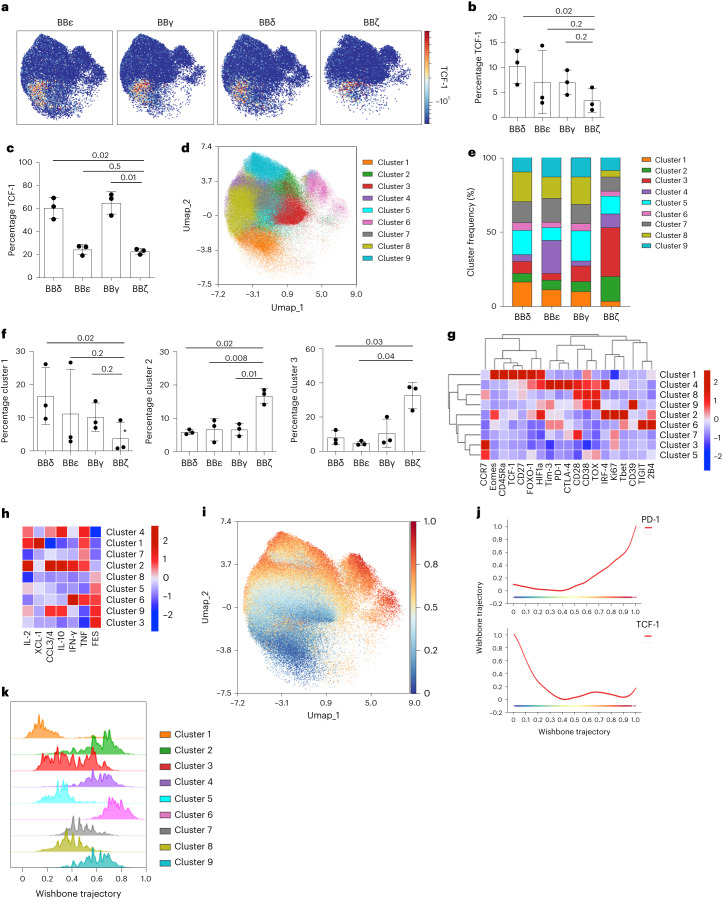
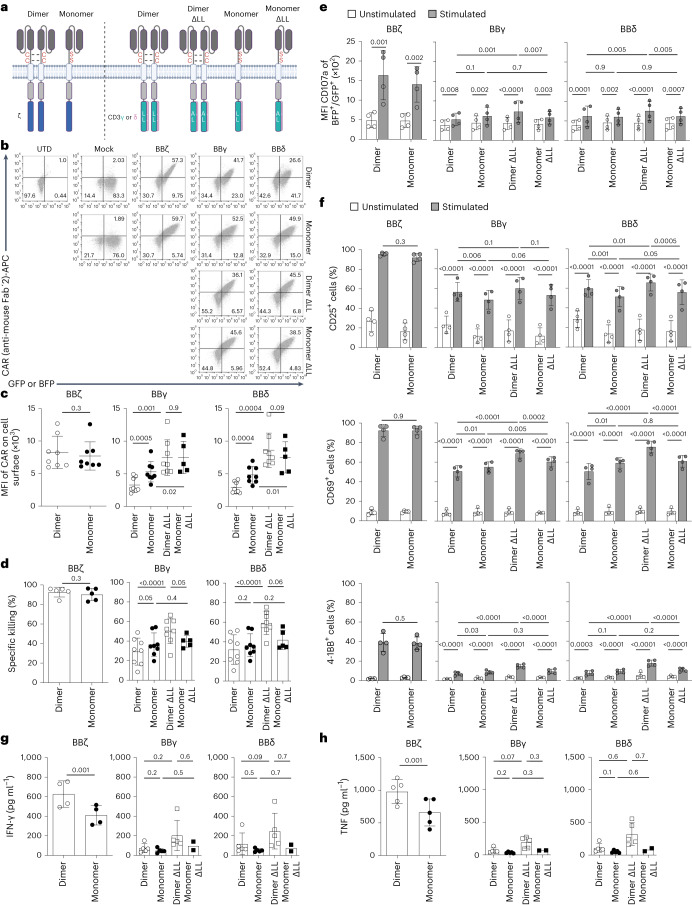
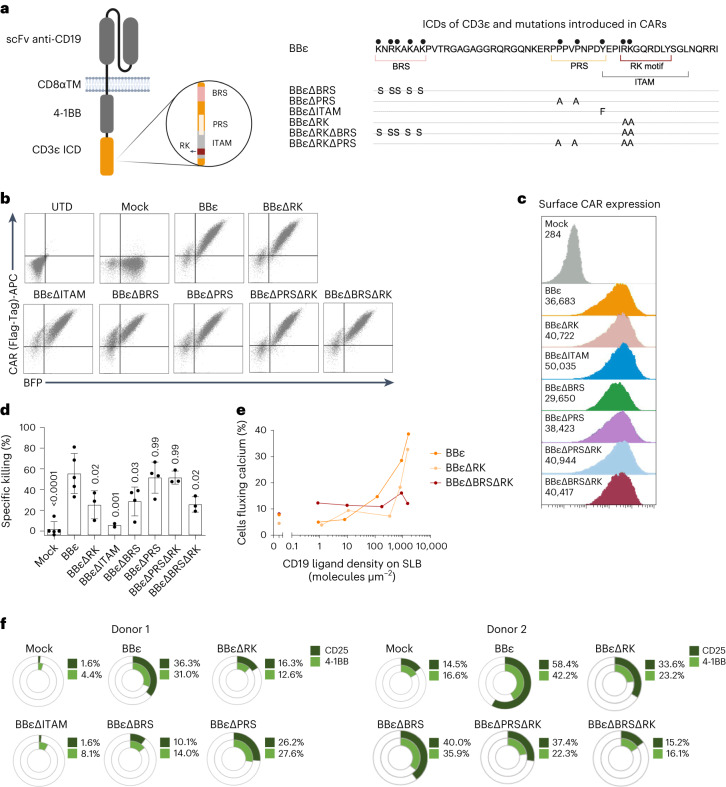
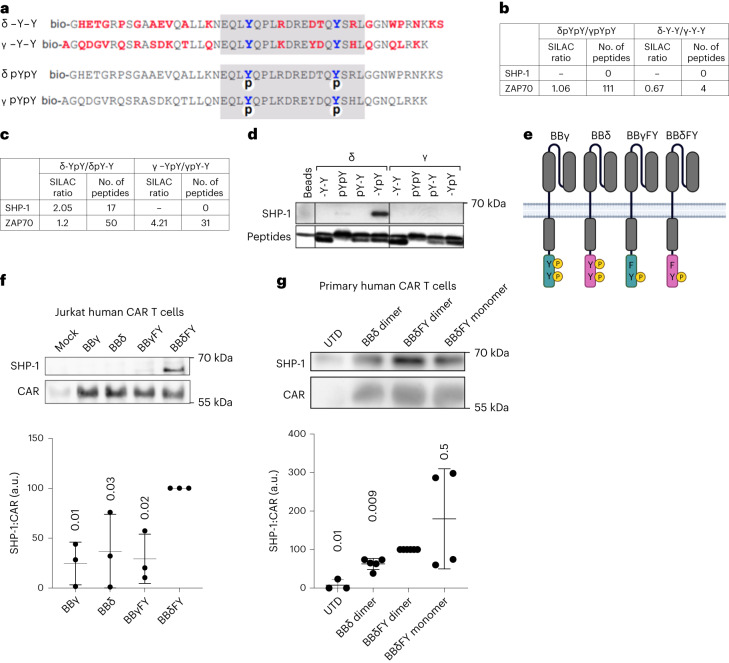
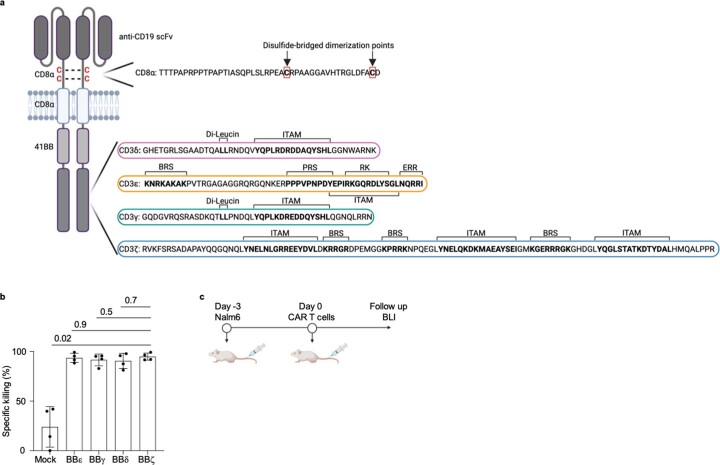
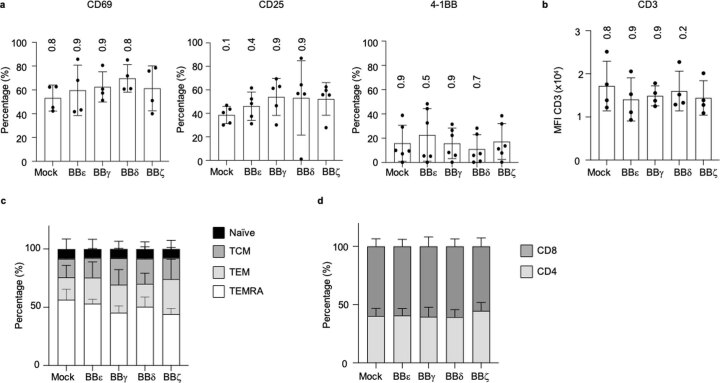
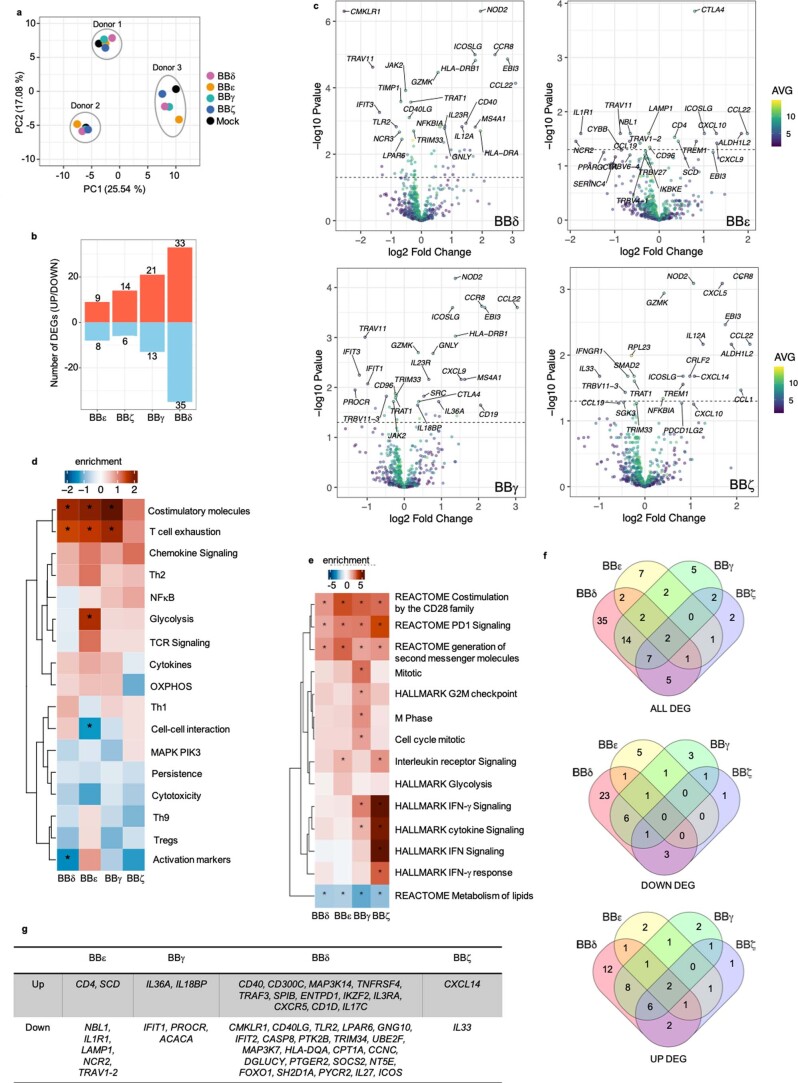
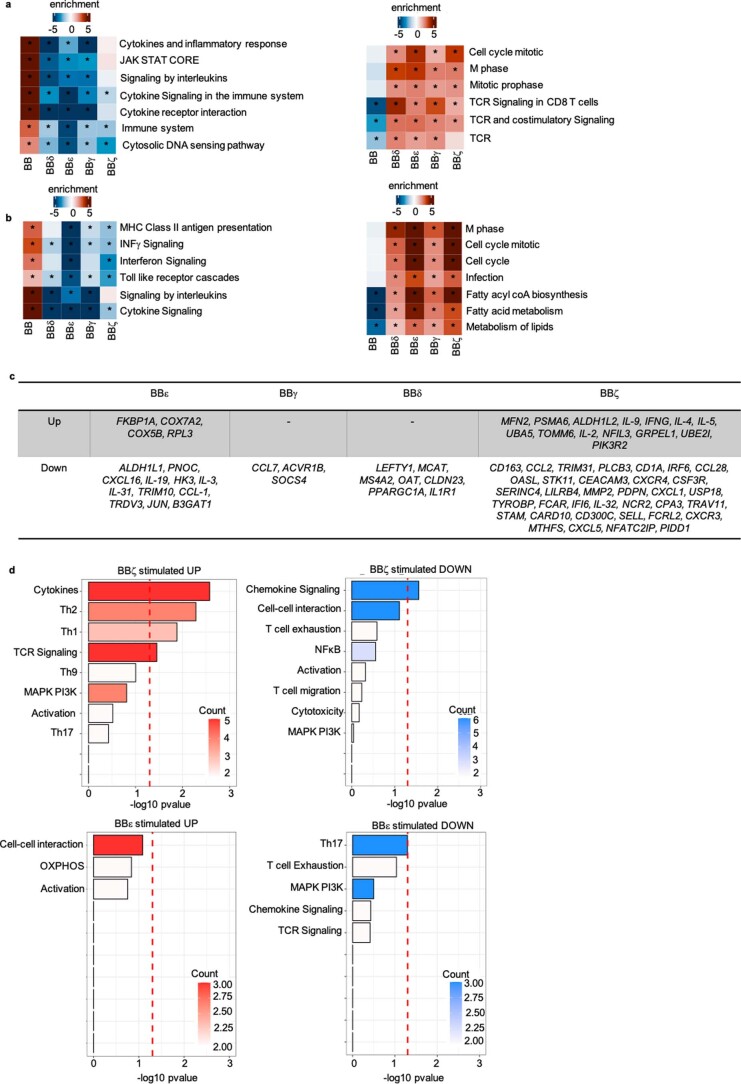
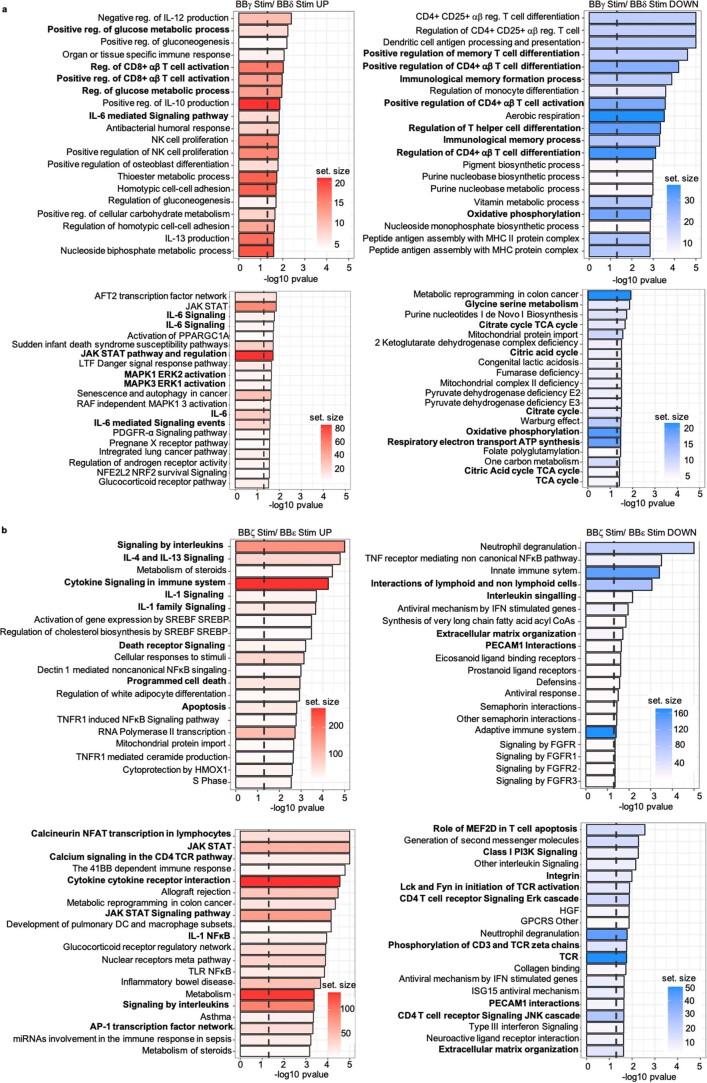
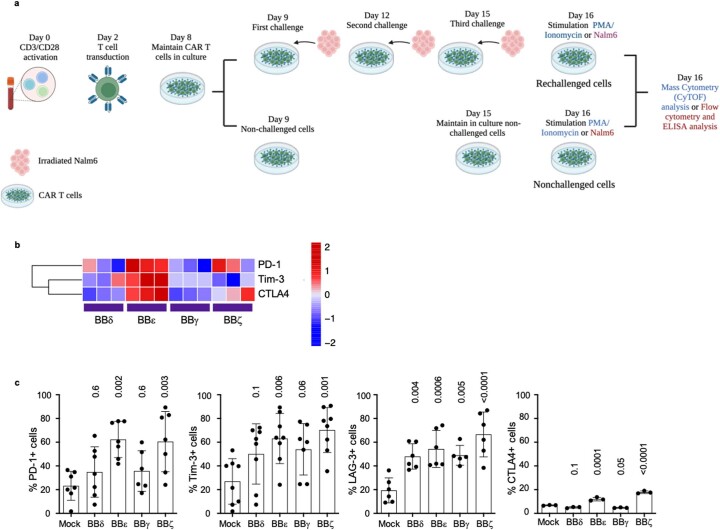
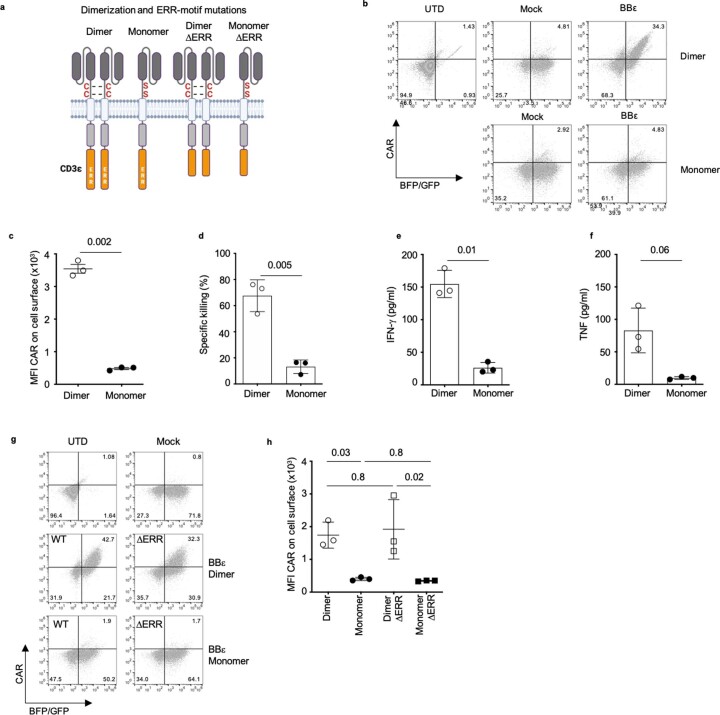
Current US Food and Drug Administration-approved chimeric antigen receptor (CAR) T cells harbor the T cell receptor (TCR)-derived ζ chain as an intracellular activation domain in addition to costimulatory domains. The functionality in a CAR format of the other chains of the TCR complex, namely CD3δ, CD3ε and CD3γ, instead of ζ, remains unknown. In the present study, we have systematically engineered new CD3 CARs, each containing only one of the CD3 intracellular domains. We found that CARs containing CD3δ, CD3ε or CD3γ cytoplasmic tails outperformed the conventional ζ CAR T cells in vivo. Transcriptomic and proteomic analysis revealed differences in activation potential, metabolism and stimulation-induced T cell dysfunctionality that mechanistically explain the enhanced anti-tumor performance. Furthermore, dimerization of the CARs improved their overall functionality. Using these CARs as minimalistic and synthetic surrogate TCRs, we have identified the phosphatase SHP-1 as a new interaction partner of CD3δ that binds the CD3δ-ITAM on phosphorylation of its C-terminal tyrosine. SHP-1 attenuates and restrains activation signals and might thus prevent exhaustion and dysfunction. These new insights into T cell activation could promote the rational redesign of synthetic antigen receptors to improve cancer immunotherapy.


Conflict of interest statement

S.M. and W.W.S. are patent holders on ‘Lck-binding motif in CD3e’, US patent application no. 20230070126. B.B. is a patent holder on ‘Methods and compositions for treating diseases associated with exhausted T cells’, US patent application no. 20210033595. The remaining authors declare no competing interests.

Figures

Fig. 1
Fig. 1. CARs containing CD3δ/ε/γ ICD outperformed the CAR containing ζ.
a, Schematic representation of the CARs used. bd, Percentage of positive CAR T cells (b) and surface CAR expression of GFP+ sorted cells from one representative donor (c) or from several donors pooled (d) (n = 6). e, Specific killing of CD19+ Nalm6 cells by primary human CAR T cells (1:1 ratio) for 6–8 h (n = 8, except for BBδ: n = 7). f, Specific killing at different cell-to-cell ratios (one representative donor from two is shown; n = 3 independent cocultures). g, The log(rank) Mantel–Cox survival test of Nalm6-bearing mice treated with CAR T cells sorted for GFP expression. h,i, Leukemia progression (average radiance) from weeks 2 and 3 post-CAR T cell injection (h) and average radiance analyzed through a 60-d period (i) (n = 11–24 mice pooled from 3 independently performed experiments). Each dot represents an independent donor (d and e) or mouse (h). Data are represented as mean ± s.d. One-way ANOVA followed by Dunnett’s multiple-comparison test (d, e and h) was used. APC, allophycocyanin. UTD, untransduced cells. Source data
Fig. 2
Fig. 2. BBζ and BBε CARs induce stronger T cell activation on antigen encounter.
a, Expression of activation markers by CAR T cells after 24 h of stimulation with Nalm6 (1:1 ratio) (n = 4). b, Phenotype of CAR T cells after 48 h of stimulation with Nalm6 (1:1 ratio) (n = 6). TCM, T central memory cells; TEM, T effector memory cells; TEMRA, T effector memory cells re-expressing CD45RA. c, Cytokines secreted by CAR T cells after 24 h of stimulation with Nalm6 (1:1 ratio) evaluated by ELISA (n = 4). d, Endogenous TCR–CD3 surface expression after 24 h of stimulation with Nalm6 (1:1 ratio) (n = 4). e, Schematic representation of an SLB featuring fluorescently labeled CD19 antigen, the adhesion molecule ICAM-1 (intercellular adhesion molecule 1) and the costimulatory molecule B7.1 for recognition by CAR T cells. LFA-1, Lymphocyte function-associated antigen 1. f, Percentage of cells fluxing calcium on encountering CD19 at the indicated densities. Data represent three independent experiments done with three independent donors. g,h, Flow cytometry analysis of degranulation assayed by upregulation of CD107a in response to CD19+ Nalm6 contact for 4 h (g) and 8 h (h). Shown are representative dot plots (4 h) and statistical analysis (n = 4). BFP, blue fluorescent protein. i, Specific killing of CD19+ Nalm6 cells by primary human CAR T cells (1:1 ratio) for 12 h in the presence of the indicated blocking antibodies (n = 4). Specific killing was normalized to isotype control (100%). Two independent anti-Fas antibodies were used and the results pooled (n = 4 healthy donors, 6 independent cocultures). Each dot represents an independent donor (n). Data are represented as mean ± s.d. One-way (a, c and d) or two-way (b and gi) ANOVA followed by Dunnett’s (b and i) or Sidak’s (g and h) multiple-comparison test was used. Source data
Fig. 3
Fig. 3. Exclusive and shared gene expression profiles on antigen encounter.
a, PCA. b,c, Pathway analysis of primary T cells expressing BB CAR versus Mock (b) and number of DEGs significantly up- and downregulated (c) comparing cells expressing every CAR stimulated versus BB 24 h after stimulation with CD19+ Nalm6 cells. d, Heatmap of the pathway analysis performed for each CAR construct compared with BB after 24 h of stimulation. e, Venn diagrams indicating the number of DEGs changed for each construct or shared among them. Every CAR is compared with the BB CAR 24 h after stimulation. f,g, Number of DEGs significantly up- or downregulated (f) and heatmap of the pathway analysis (g) performed for BBζ versus BBε and BBγ versus BBδ. Stimulation conditions are indicated. Three independent donors were analyzed in all panels. For d and g, a two-sample Student’s t-test was used. *Indicates statistical significance; P < 0.05. Exact P values are provided in Source data. Source data
Fig. 4
Fig. 4. CD3γ and CD3δ ICDs protect CAR T cells from dysregulation on serial antigen encounters.
a, UMAP plot from CyTOF data showing all the samples together (left), pooled nonchallenged or rechallenged cells (middle) and cells sorted by CAR (right). b,c, Percentage of cells expressing T cell exhaustion/dysregulation markers (b) and cytokine production (c) comparing all nonchallenged samples pooled with all rechallenged samples pooled. d, Heatmap showing the cytokine production in nonchallenged and rechallenged conditions. e, Cytokine secretion assayed by ELISA of CAR T cells on incubation with Nalm6 cells (1:1 ratio) for 24 h after one (black) or three (white) challenges. Each dot represents an independent donor (n = 4). f, Specific killing of CD19+ Nalm6 cells by CAR T cells submitted to repetitive stimulations (E:T ratio = 1:1 for 6–8 h). Each dot represents an independent donor (n = 3 for ad, n = 4 for e, n = 5 for f). Data are represented as mean ± s.d. Wilcoxon’s two-tailed test (b and c), two-way ANOVA followed by Sidak’s multiple-comparison test (e) or one-way ANOVA followed by Dunnett’s multiple-comparison test (f) is used. Source data
Fig. 5
Fig. 5. BBδ CAR T cells maintain precursors expressing TCF-1.
a, UMAP visualization from CyTOF data of CAR+ T cells on serial antigen encounters. Color indicates TCF-1 expression (n = 3). b,c, Frequency of TCF-1-expressing CAR T cells assayed by CyTOF (b) (n = 3) and by intracellular flow cytometric analysis (c) (n = 3). d, FlowSOM clustering of CAR T cells. Clusters are visualized by the indicated colors on the UMAP plot. e, Stack bar graph displaying the median frequency of each cluster. f, Cluster frequency of selected clusters (n = 3). g, Hierarchically clustered heatmap indicating the percentage of expression of activation and exhaustion markers per cluster. h, Heatmap showing the percentages of cytokine-expressing CAR T cells per cluster ordered by increasing FES. i, Wanderlust trajectory analysis, with progressing trajectory pseudotime color visualized on the UMAP. j, PD-1 (top) and TCF-1 (bottom) expression according to the Wanderlust trajectory. k, Stacked bar histogram indicating the position of the indicated cluster cells according to the trajectory. Each dot represents an independent donor (b, c and f). Data are represented as mean ± s.d. One-way ANOVA followed by Dunnett’s multiple-comparison test was used. Source data
Fig. 6
Fig. 6. Dimeric CARs displayed improved functionality.
a, Scheme of monomeric and dimeric CARs and the mutations introduced. b,c, Flow cytometric analysis depicting the percentage of positive CAR T cells (b) and quantification of surface CAR expression for GFP+ or BFP+ cells (c) (n = 8, except for monomer ΔLL: n = 5). d, Specific killing of CD19+ Nalm6 cells by primary human CAR T cells (1:1 ratio) for 12 h (n = 8, except for BBζ and monomer ΔLL: n = 5). e, Flow cytometry-based analysis of degranulation. Statistical analysis of the mean fluorescence intensity of CD107a is shown (n = 4). f, Activation markers on CAR T cells 24 h after stimulation with Nalm6 (1:1 ratio) (n = 4). g,h, Cytokine secretion, IFN-γ (g) and TNF (h), assayed by ELISA of CAR T cells on incubation with Nalm6 cells at a 1:1 ratio for 24 h (n = 5, except for monomer ΔLL: n = 2). Data are represented as mean ± s.d. Each dot represents an independent donor. In c, d, g and h, two-tailed, paired Student’s t-test for BBζ and paired one-way ANOVA followed by Holm–Sidak multiple-comparison test for BBγ and BBδ were used. In e and f, paired two-way ANOVA followed by the Holm–Sidak multiple-comparison test was used. Source data
Fig. 7
Fig. 7. The enhanced functionality of the BBε CAR relies on motifs recruiting Lck.
a, Schematic representation of the mutations introduced in BBε. b,c, Flow cytometric analysis (b) and surface CAR expression (c) gated on BFP+ cells (n = 5). d, Specific killing of CD19+ Nalm6 cells by CAR T cells (1:1 ratio for 6–8 h). Each dot represents an independent donor (n = 5 for BBε, n = 4 for BBεΔBRS and BBεΔPRS, n = 3 for BBεΔRK, BBεΔPRSΔRK and BBεΔBRSΔRK, and n = 2 for BBεΔITAM). Data are represented as mean ± s.d. One-way ANOVA followed by Dunnett’s multiple-comparison test was used. e, Percentage of CAR T cells fluxing calcium after contacting SLBs functionalized with adhesion and costimulatory molecules as well as CD19 molecules at indicated densities. Data represent one out of three independent experiments done with three independent donors. f, Percentage of CAR T cells positive for activation markers after 48 h of stimulation with CD19+ Nalm6 cells (1:1 ratio). Two representative donors are shown. Source data
Fig. 8
Fig. 8. Monophosphorylated CD3δ recruits SHP-1.
a, Peptide sequences corresponding to the cytoplasmic tails of mouse CD3δ and CD3γ. Red amino acids are not conserved between CD3δ and CD3γ; ITAMs are marked in gray, phosphates are indicated with a circled ‘p’ and N-terminal biotin with a ‘bio’. b,c, SILAC ratio and the number of identified peptides for SHP-1 (b) and ZAP70 (c) on quantification by MS–MS. T cell lysates were incubated with doubly phosphorylated, unphosphorylated or singly phosphorylated peptides. The SILAC ratio indicates the relative amounts of a protein bound to one peptide in comparison to the amounts of the same protein bound to the other peptide. d, The experiments in b and c were repeated, purified proteins were separated by SDS–PAGE and visualized using immunoblotting (n = 2). e, Schematic representation of the CARs with a mutation in the N-terminal tyrosine leaving functional just the C-terminal tyrosine. f,g, Jurkat (n = 3) (f) and primary human T cells (n = 3 for UTD, n = 5 for BBδ dimer, n = 6 for BBδFY dimer and n = 4 for BBδFY monomer) (g). Each dot represents a healthy donor transduced with the indicated CARs. Cells were stimulated with pervanadate for 5 min to achieve maximum phosphorylation and the CARs were immunoprecipitated. Purified proteins were separated by SDS–PAGE and visualized using immunoblotting. The ratio of SHP-1 and CAR was calculated. Data are represented as mean ± s.d. One-way ANOVA followed by Dunnett’s multiple-comparison test was used. Source data
Extended Data Fig. 1
Extended Data Fig. 1. CARs containing the CD3δ/ε/γ ICD are functional.
a, Scheme depicting the ICD of all CD3 chains used in this study and the localization of the cysteines driving CAR dimerization. b, Specific killing of CD19+ Nalm6 cells by primary human T cells lentivirally transduced with the indicated CAR after 24 h of co-incubation (1:1 ratio). Each dot represents an independent donor (n = 4). c, Schematic representation of the in vivo model. Data are represented as mean ± s.d. and analyzed by paired one-way ANOVA and Dunnett’s multiple comparisons test. ITAM, Immunoreceptor Tyrosine-based Activation Motif; BRS, Basic Rich Stretch; PRS, Proline Rich Sequence; RK, Receptor Kinase; ERR, endoplasmic reticulum retention. Source data
Extended Data Fig. 2
Extended Data Fig. 2. All CARs containing the TCR-CD3 ICD deliver tonic signals.
a, Activation markers (n = 4 for CD69, n = 5 for CD25, n = 6 for 4-1BB), b, endogenous TCR-CD3 expression (n = 4), c, differentiation (n = 4) and d, CD4/CD8 ratios (n = 3) of CAR T cells 6 days after transduction measured by flow cytometry. Each dot represents an independent donor. TCM, central memory; TEM, effector memory; and TEMRA, effector memory RA. Data are represented as mean ± s.d. One-way ANOVA (a, b) or Two-way ANOVA (c, d), followed by Dunnett’s multiple comparisons test. All comparisons to BBζ were non-significant. Source data
Extended Data Fig. 3
Extended Data Fig. 3. Gene expression profile induced by CAR-derived tonic signals.
a, Principal component analysis (PCA), b, number of Differentially Expressed Genes (DEGs) significantly up- and down-regulated by each CAR versus Mock and c, volcano plots showing the differentially expressed genes between CAR and Mock cells from three different donors 6 days after CAR transduction. d, Heatmap of pathway analysis from each CAR construct compared to Mock. e, Heatmaps of the pathway analysis (Reactome, Consensus, Hallmark and GO) regulated by each single CAR construct compared to BB. f, Venn diagrams indicate the number of DEGs changed for each construct or shared among them. Every CAR is compared to Mock. g, Genes exclusively regulated by a single CAR construct. (d, e) Two-sample t-test, * indicates statistical significance, p < 0.05. Exact p values are provided in the source data file. n = 3 independent donors. Source data
Extended Data Fig. 4
Extended Data Fig. 4. Gene expression profile induced by CARs upon antigen encounter.
a, b, Heatmaps of the pathway analysis, (a) Consensus and (b) Reactome. c, List of genes exclusively regulated by a single CAR construct compared to BB after 24 h stimulation with target cells. d, Pathway analysis (CAR T cells Nanostring) performed with the genes exclusively regulated by BBζ (up) or BBε (down) compared to BB upon 24 h stimulation with target cells. Two sample t-test, * indicates statistical significance, p < 0.05. Exact p values are provided in the source data file. n = 3 independent donors. Source data
Extended Data Fig. 5
Extended Data Fig. 5. Comparative gene expression profile induced by BBγ/BBδ and BBζ/BBε upon antigen stimulation.
a, Pathway analysis (GO and Consensus) directly comparing BBγ with BBδ (genes in the UP graph are significantly up-regulated in BBγ and genes in the DOWN graph are significantly up-regulated in BBδ). b, Pathway analysis (Reactome and Consensus) directly comparing BBζ with BBε (genes in the UP graph are significantly up-regulated in BBζ and genes in the DOWN graph are significantly up-regulated in BBε). Two-sample t-test, the dashed vertical line indicates statistical significance, p < 0.05. Relevant pathways are bolded. n = 3 independent donors.
Extended Data Fig. 6
Extended Data Fig. 6. Repetitive antigen encounters induce CAR T cell dysregulation in vitro.
a, Schematic protocol to repetitively stimulate CAR T cells with irradiated Nalm6 (1:1 ratio) to generate nonchallenged and rechallenged CAR T cells. For CyTOF analysis, CAR T cells were sorted and stimulated with PMA/Ionomycin for 6 h to unravel the full activation potential. For flow cytometric analysis and ELISA, CAR T cells were incubated with Nalm6 for 24 h. b, Hierarchically clustered heatmap showing median marker expression of inhibitory receptors by the different CAR T cells in rechallenged conditions assayed by CyTOF analysis. Z-scores after column normalization are show n = 3. c, Up-regulation of inhibitory receptors by CAR T cells upon incubation with Nalm6 (1:1) for 24 h after the third challenge assayed by flow cytometry. Each dot represents an independent donor (n = 7 for PD-1, Tim-3 and LAG-3; n = 3 for CTLA4). Data are represented as mean ± s.d. One-way ANOVA followed by Dunnett’s multiple comparisons test. Source data
Extended Data Fig. 7
Extended Data Fig. 7. Dimerization is needed for BBε CAR surface expression.
a, Schematic representation of monomeric and dimeric BBε CARs and the mutations introduced. ERR, endoplasmic reticulum retention signal. b,c, Flow cytometric analysis (b) and quantification (c) of surface CAR expression for GFP+ or BFP+ cells (n = 3). d, Specific killing of CD19+ Nalm6 cells by CAR T cells (1:1 ratio) for 12 h. (n = 3). e, f, Cytokine secretion, IFN-γ (e) and TNF (f), assayed by ELISA of CAR T cells upon incubation with Nalm6 (1:1 ratio) for 24 h (n = 3). g, Flow cytometric analysis and h, quantification of surface CAR expression for BFP+ or GFP+ cells (n = 3). Each dot represents an independent donor. Data are represented as mean ± s.d. Two-tailed paired t-test (c–f). One-way ANOVA followed by Holm-Sidak’s multiple comparisons test (h). Source data
Extended Data Fig. 8
Extended Data Fig. 8. Gating strategy for flow cytometric analysis.
a, Gating strategy to sort for GFP+ cells as presented for Fig. 1b. b Gating strategy to gate on phenotypic T cell subsets as presented in Fig. 2b. c Gating Strategy to determine CD107a upregulation on CAR T cells upon Nalm6 co-culture as presented in Fig. 2g. d, Gating Strategy for Fig. 4a. e, Gating Strategy for Fig. 5a. f, Gating strategy to determine GFP+CAR+ or BFP+CAR+ T cell populations as presented for Fig. 6b, Extended Data Figs. 7 and g. g, Gating strategy to determine BFP+CAR+ T cell populations as presented for Fig. 7b.

References

    1. Eshhar Z, Waks T, Gross G, Schindler DG. Specific activation and targeting of cytotoxic lymphocytes through chimeric single chains consisting of antibody-binding domains and the γ or ζ subunits of the immunoglobulin and T-cell receptors. Proc. Natl Acad. Sci. USA. 1993;90:720–724. doi: 10.1073/pnas.90.2.720. - DOI - PMC - PubMed
    1. Finney HM, Lawson AD, Bebbington CR, Weir AN. Chimeric receptors providing both primary and costimulatory signaling in T cells from a single gene product. J. Immunol. 1998;161:2791–2797. doi: 10.4049/jimmunol.161.6.2791. - DOI - PubMed
    1. Grupp SA, et al. Chimeric antigen receptor-modified T cells for acute lymphoid leukemia. N. Engl. J. Med. 2013;368:1509–1518. doi: 10.1056/NEJMoa1215134. - DOI - PMC - PubMed
    1. Rafiq S, Hackett CS, Brentjens RJ. Engineering strategies to overcome the current roadblocks in CAR T cell therapy. Nat. Rev. Clin. Oncol. 2020;17:147–167. doi: 10.1038/s41571-019-0297-y. - DOI - PMC - PubMed
    1. Schamel, W. W., Alarcon, B. & Minguet, S. The TCR is an allosterically regulated macromolecular machinery changing its conformation while working. Immunol. Rev.291, 8–25 (2019). - PubMed