. 2023 Dec;24(12):2108-2120.
doi: 10.1038/s41590-023-01667-y. Epub 2023 Nov 6.

Selective IL-27 production by intestinal regulatory T cells permits gut-specific regulation of TH17 cell immunity

Affiliations

Selective IL-27 production by intestinal regulatory T cells permits gut-specific regulation of TH17 cell immunity

Chia-Hao Lin et al. Nat Immunol. 2023 Dec.

Abstract

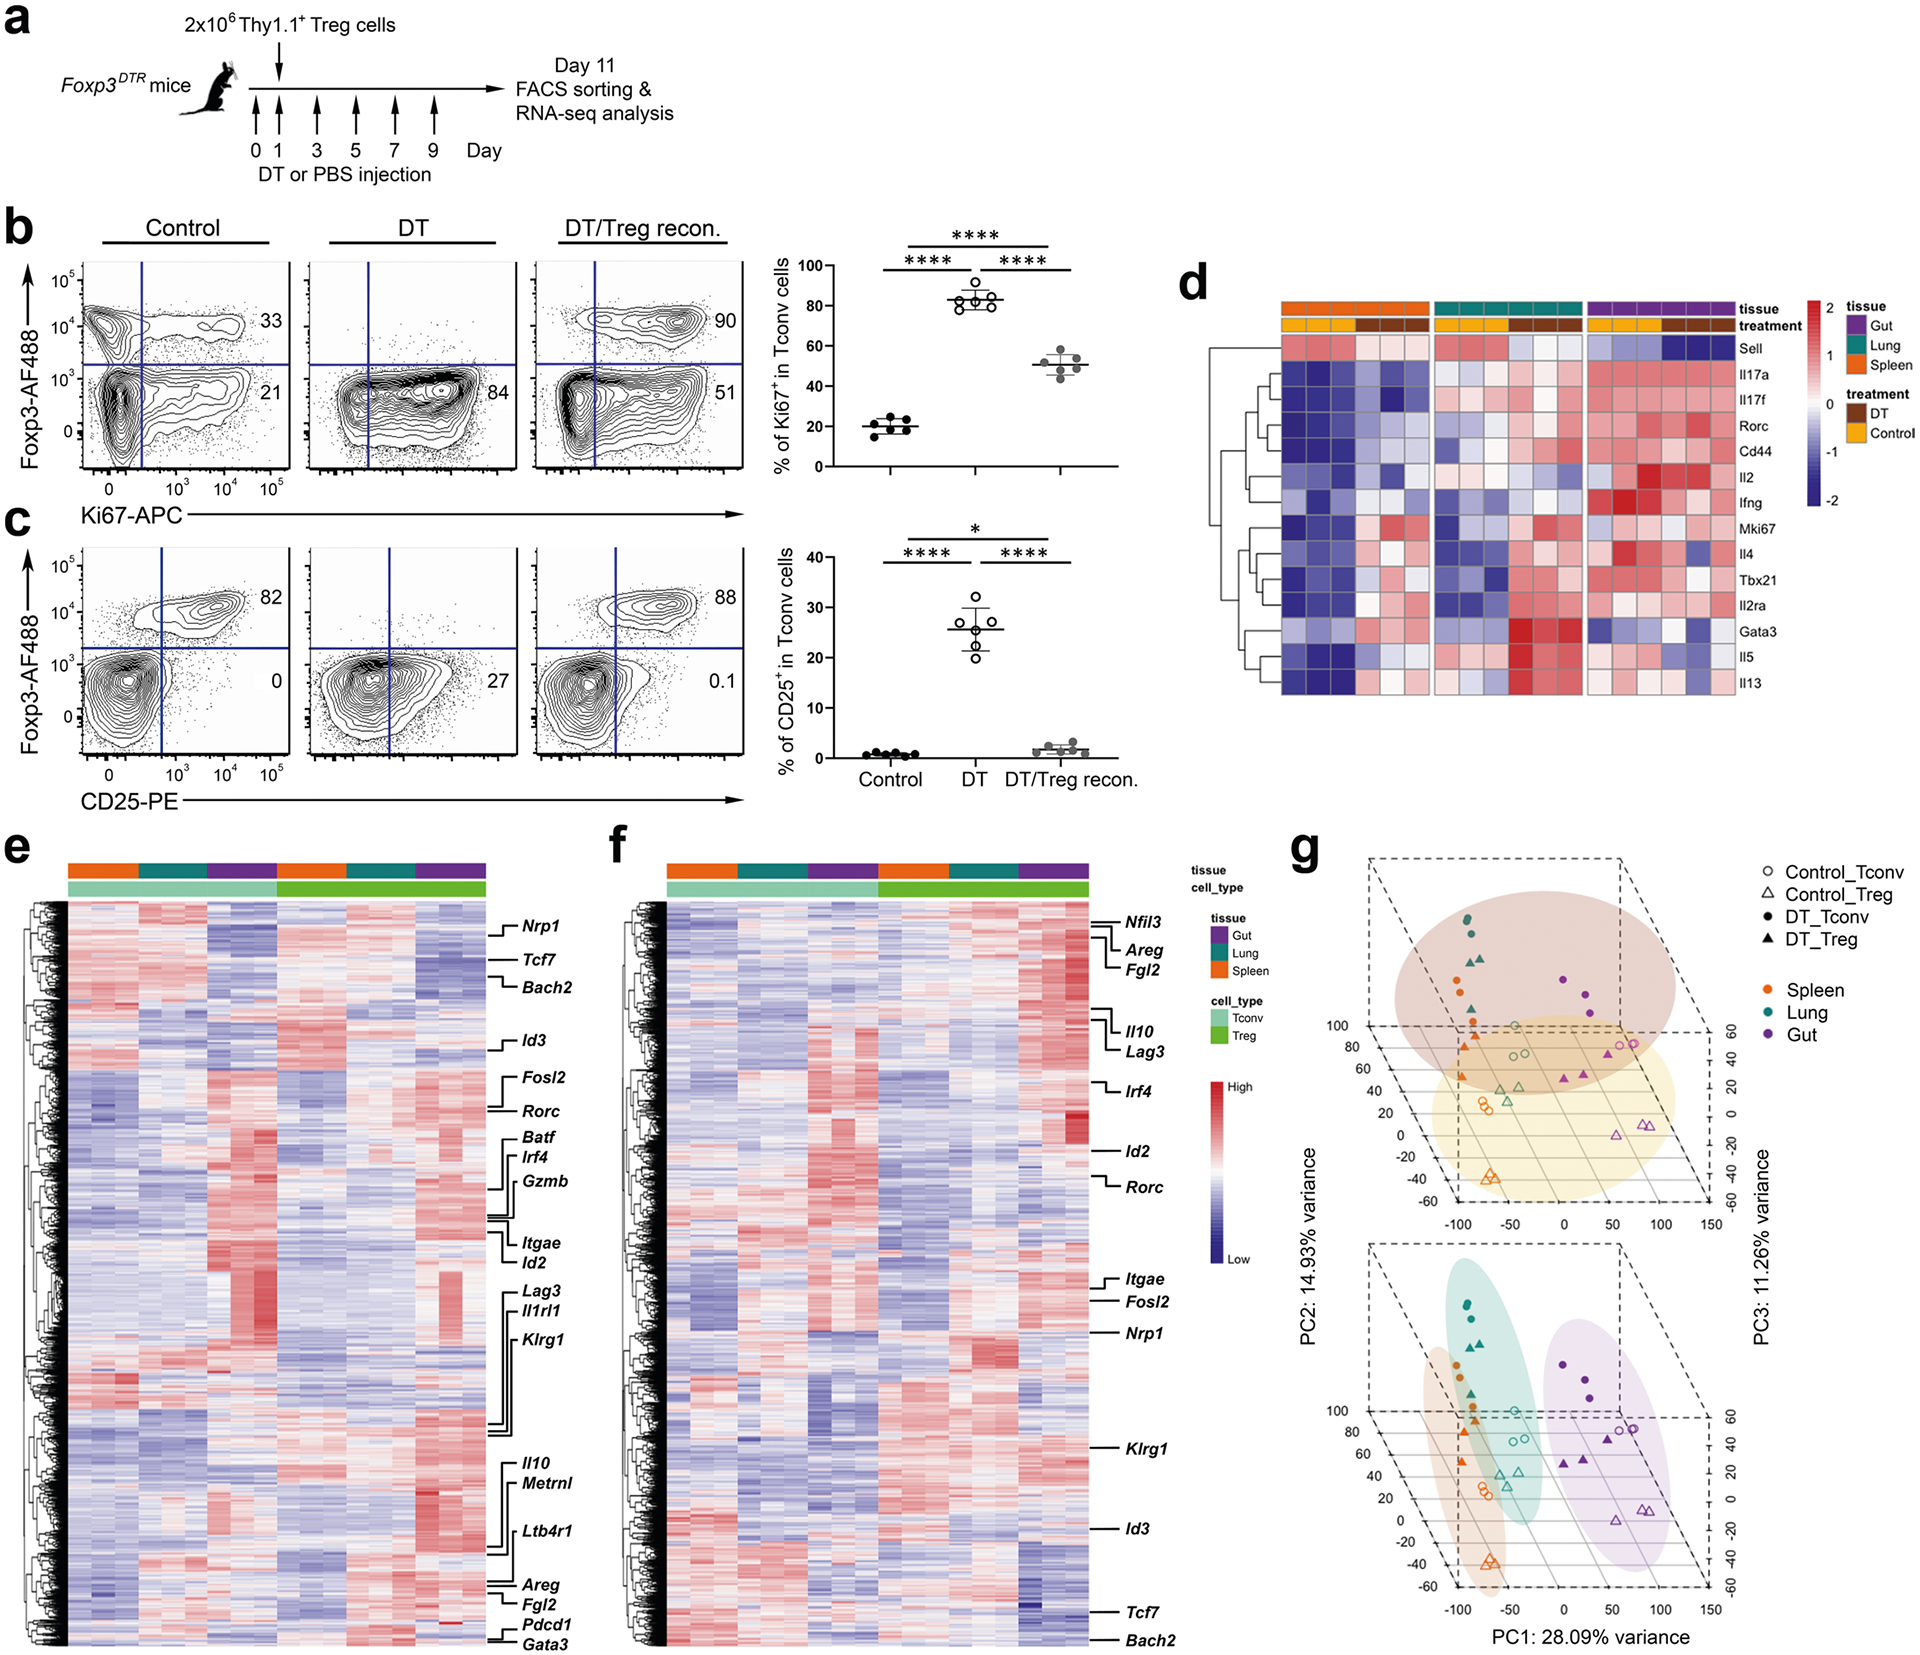
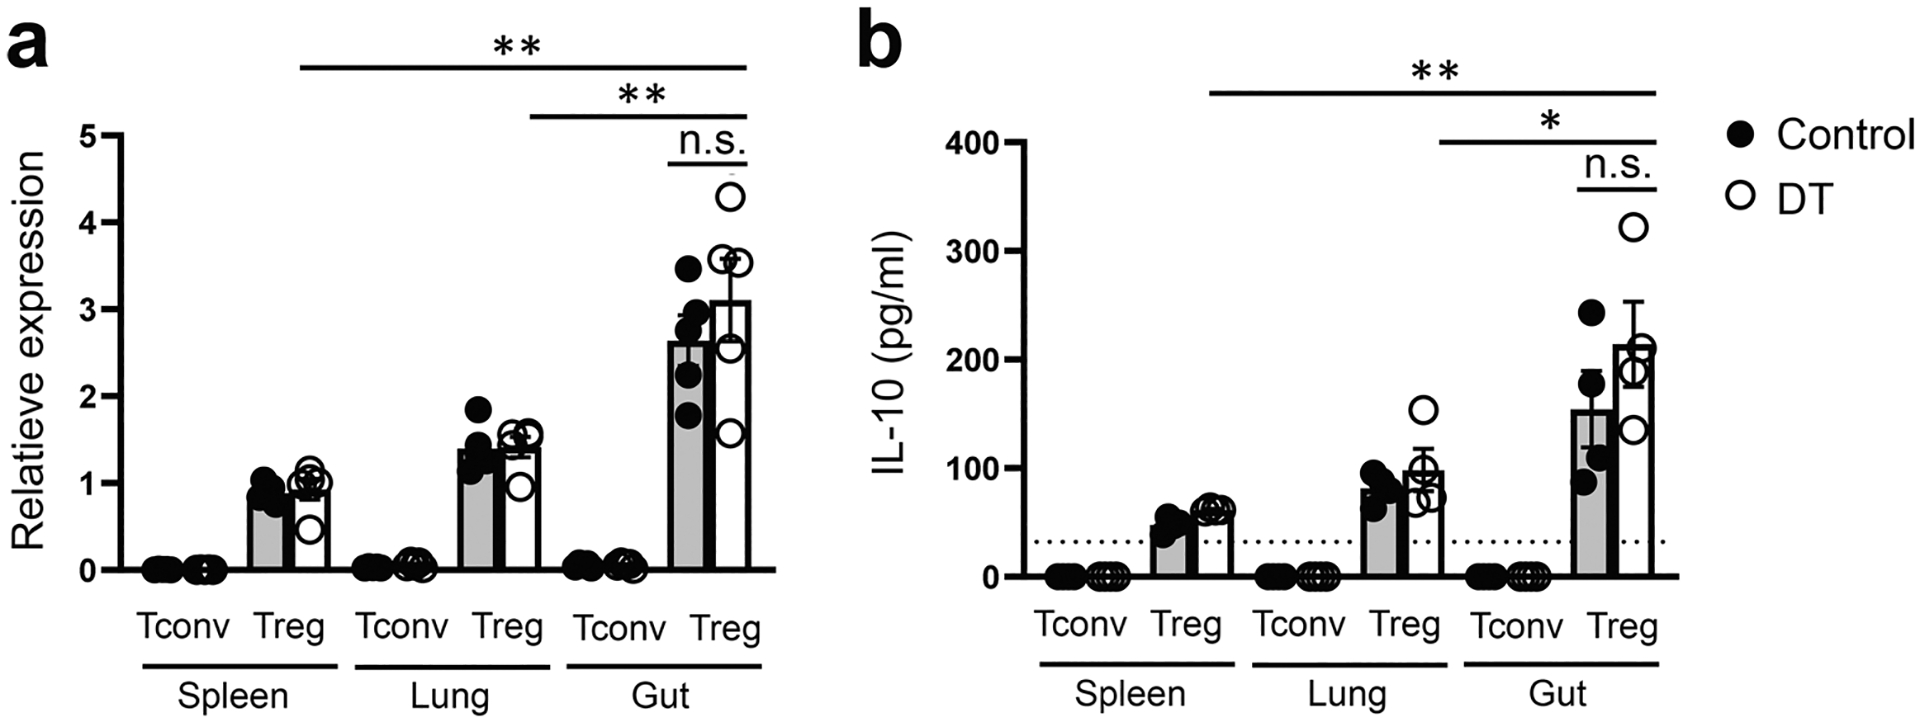
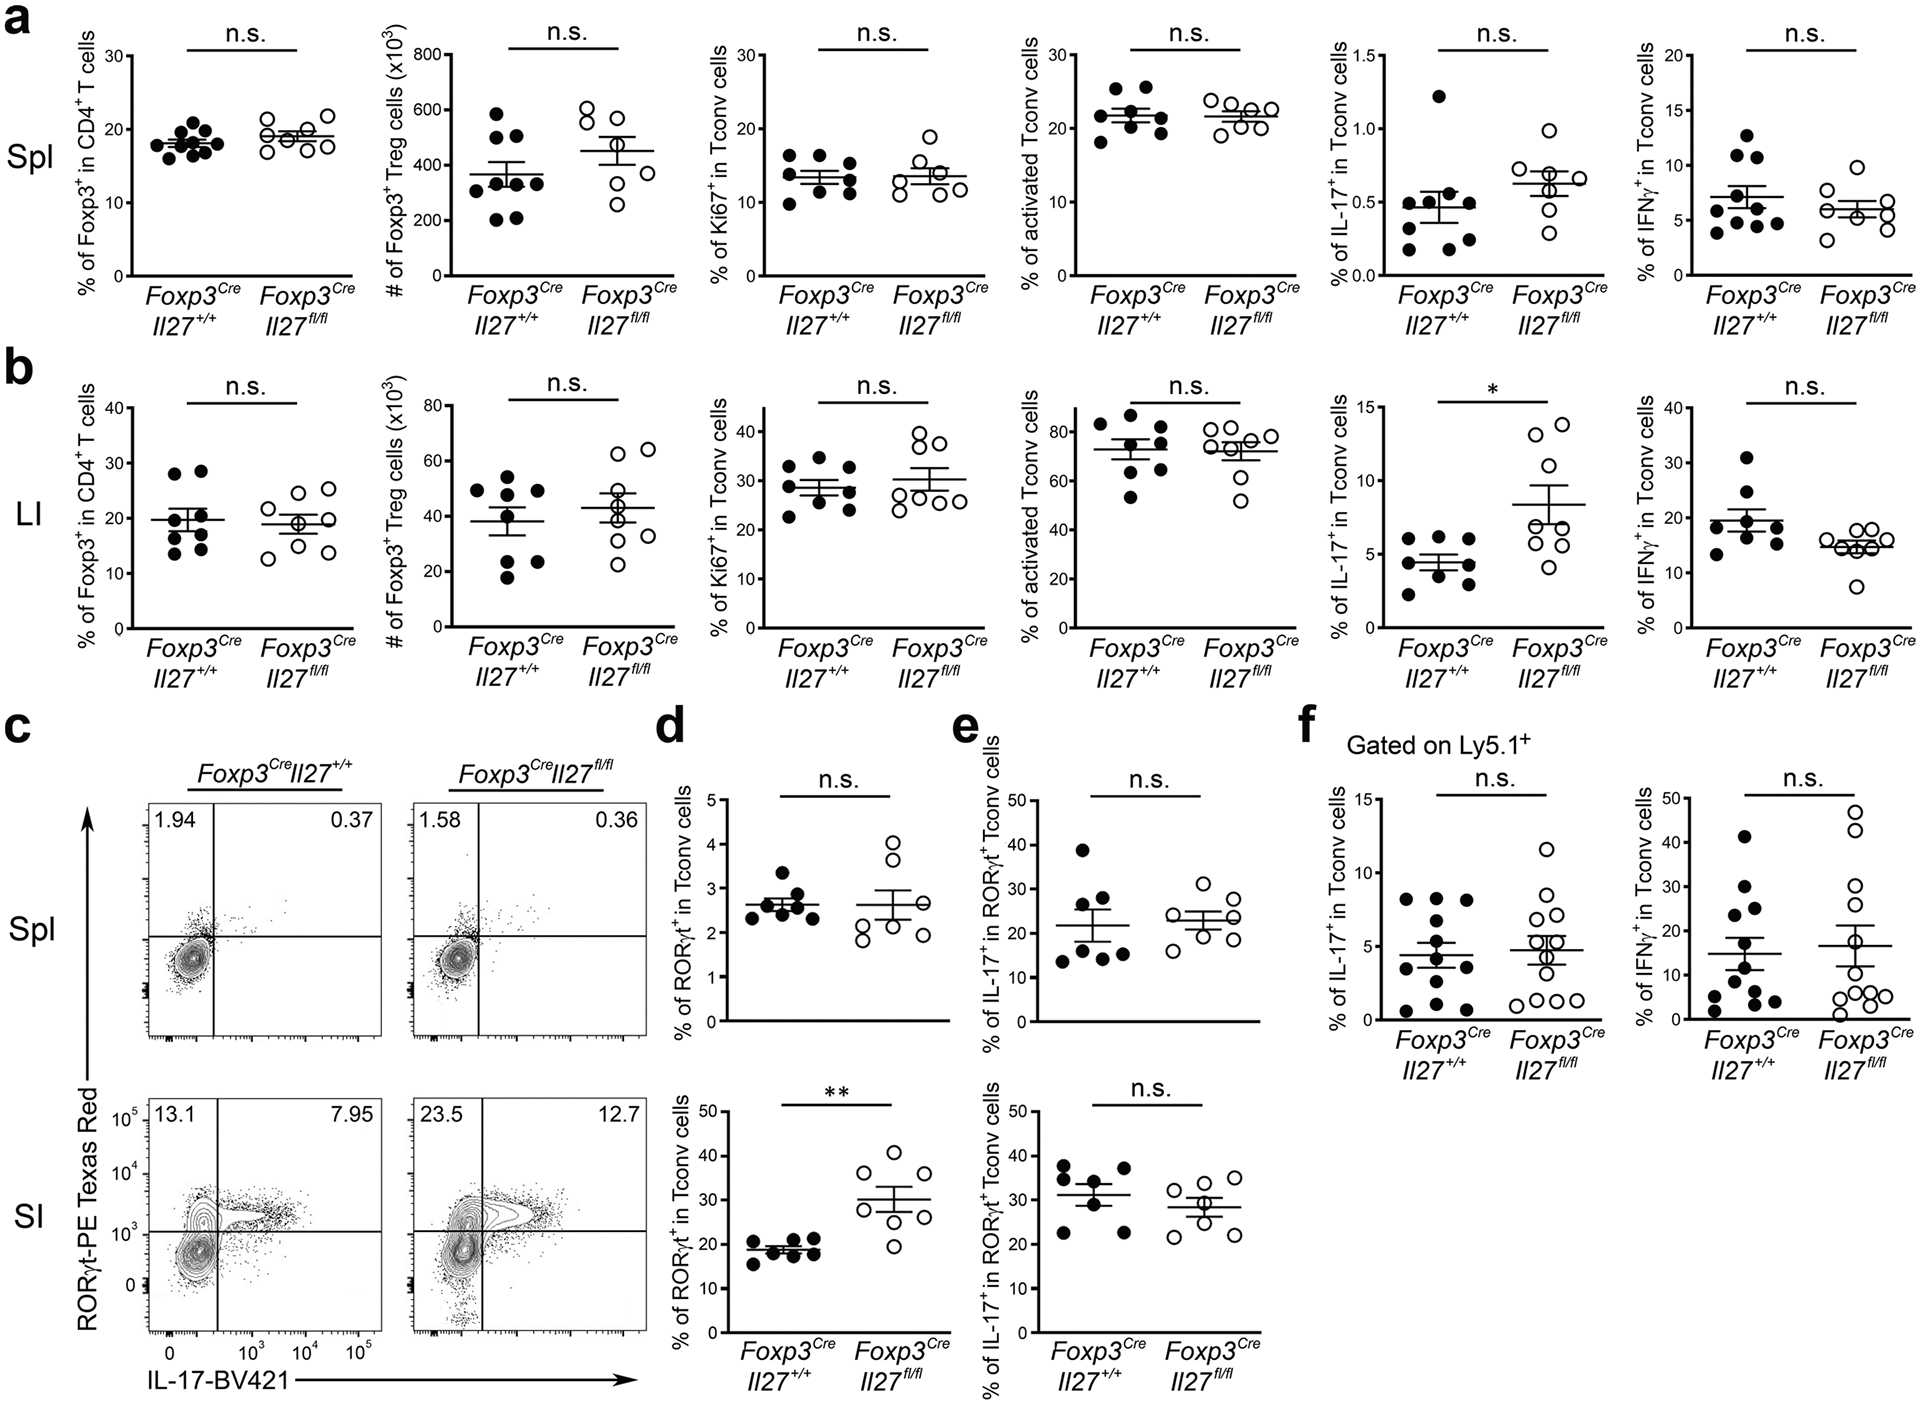
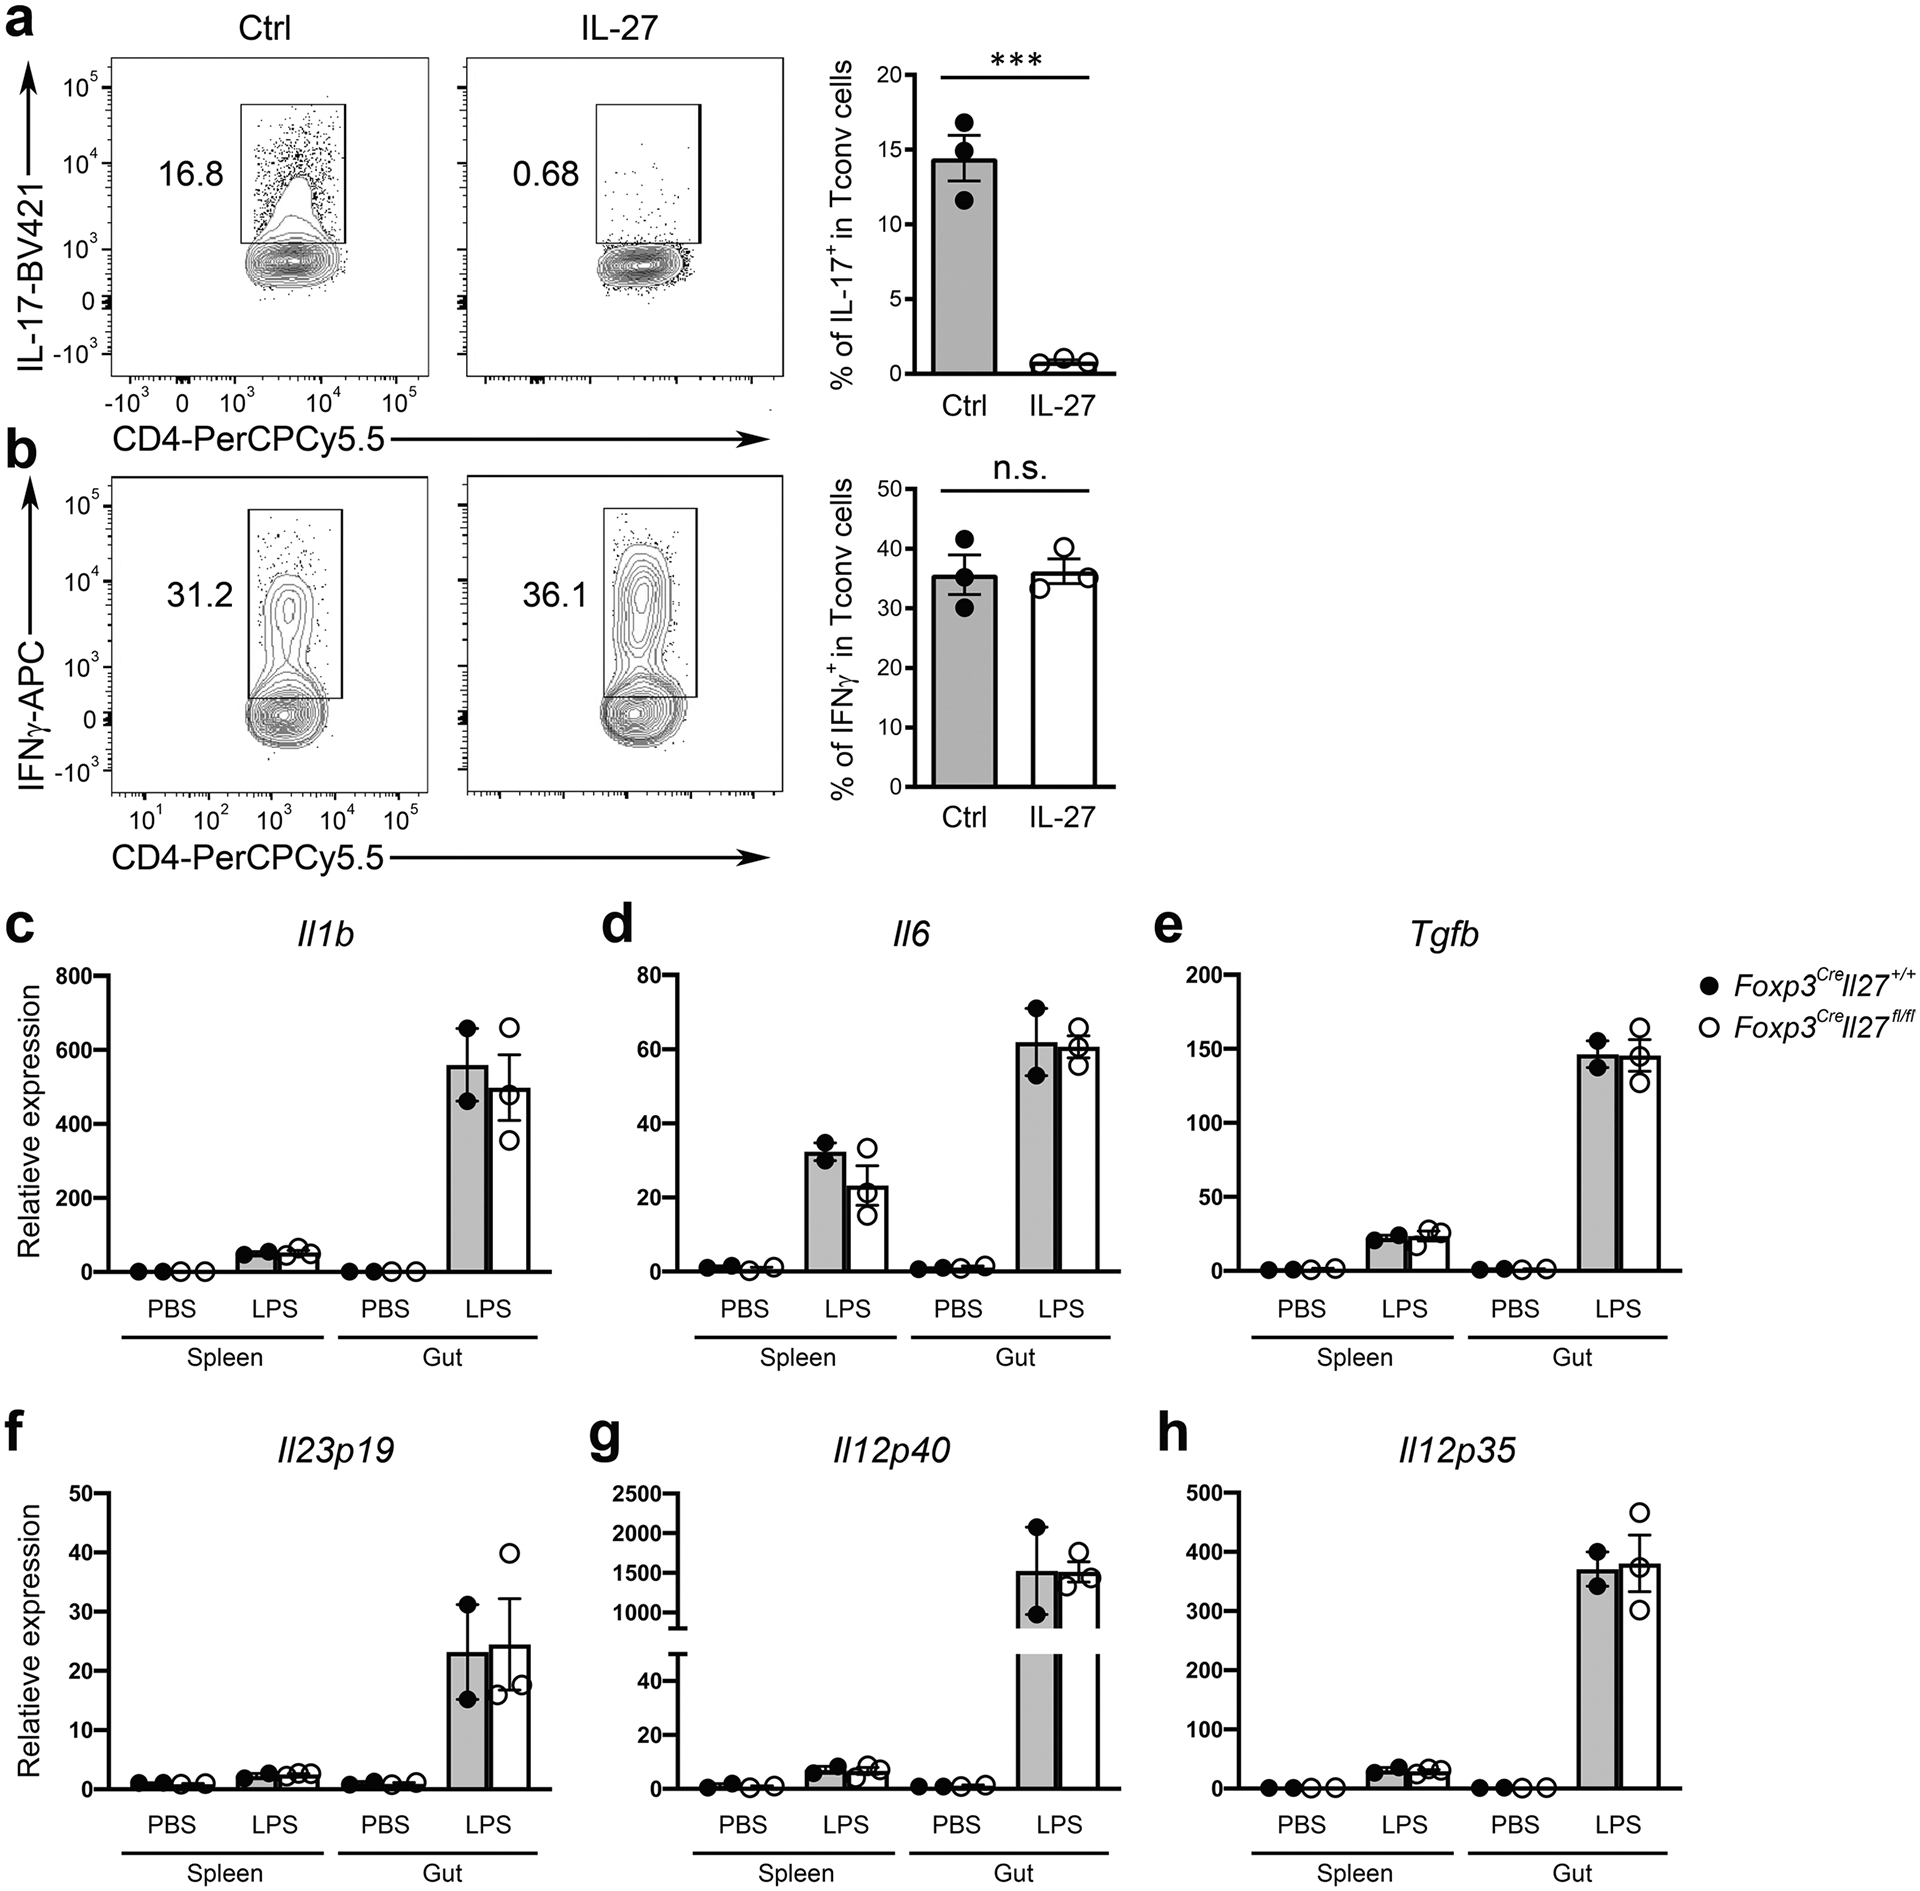
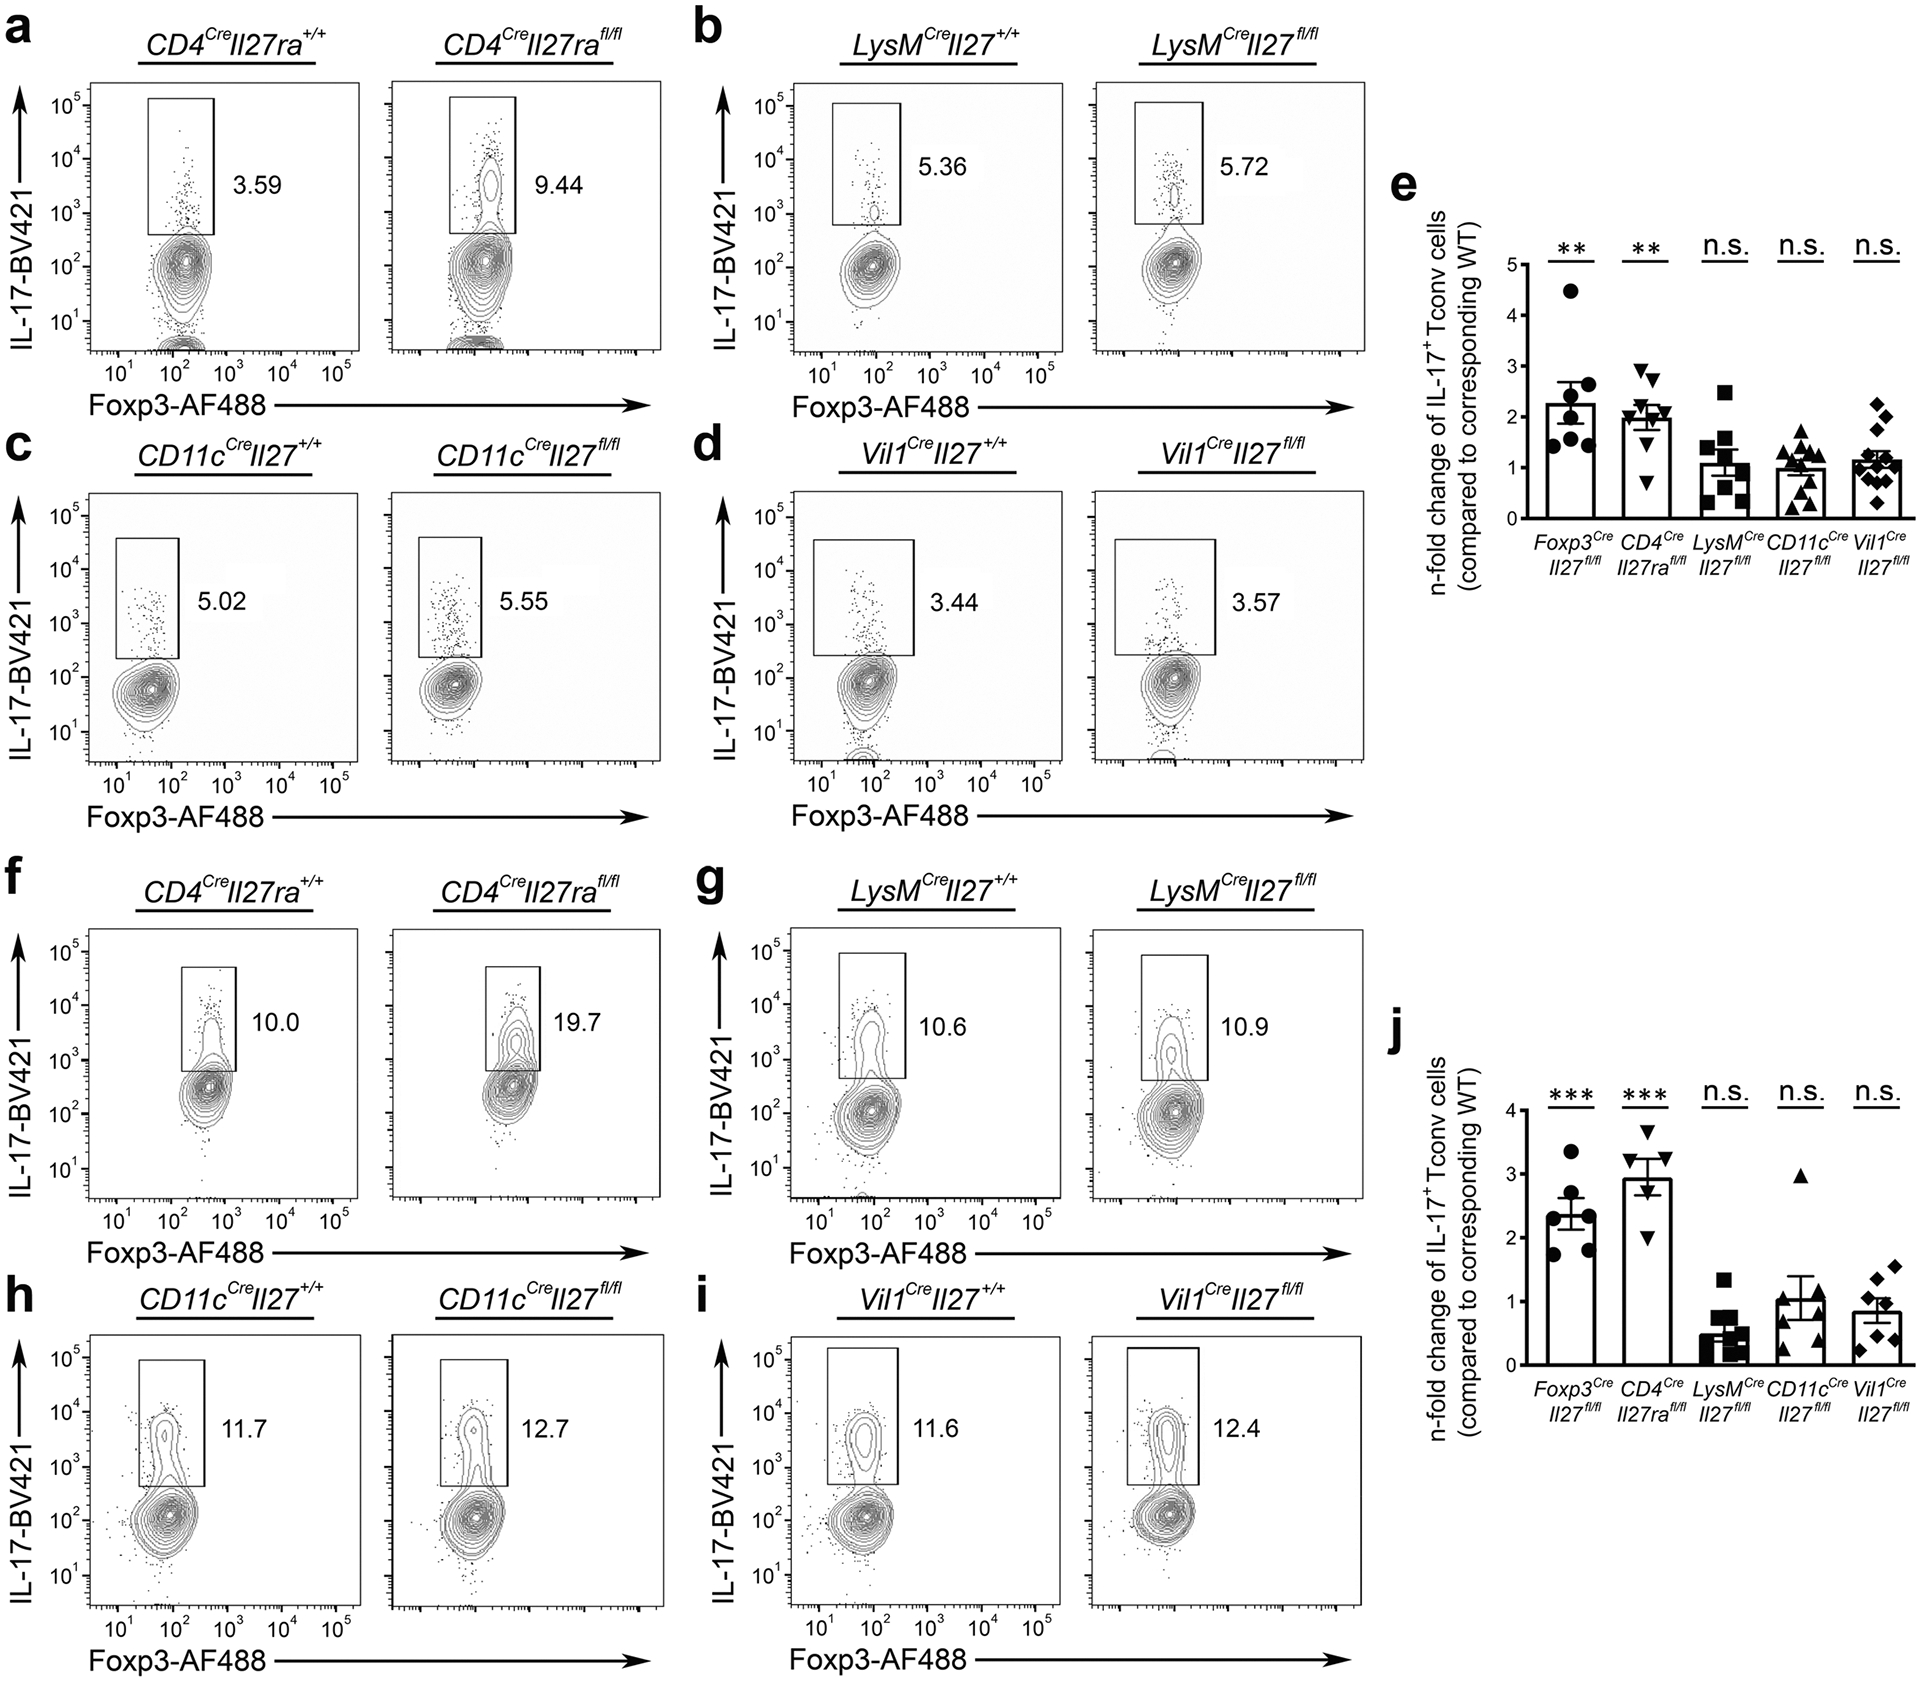
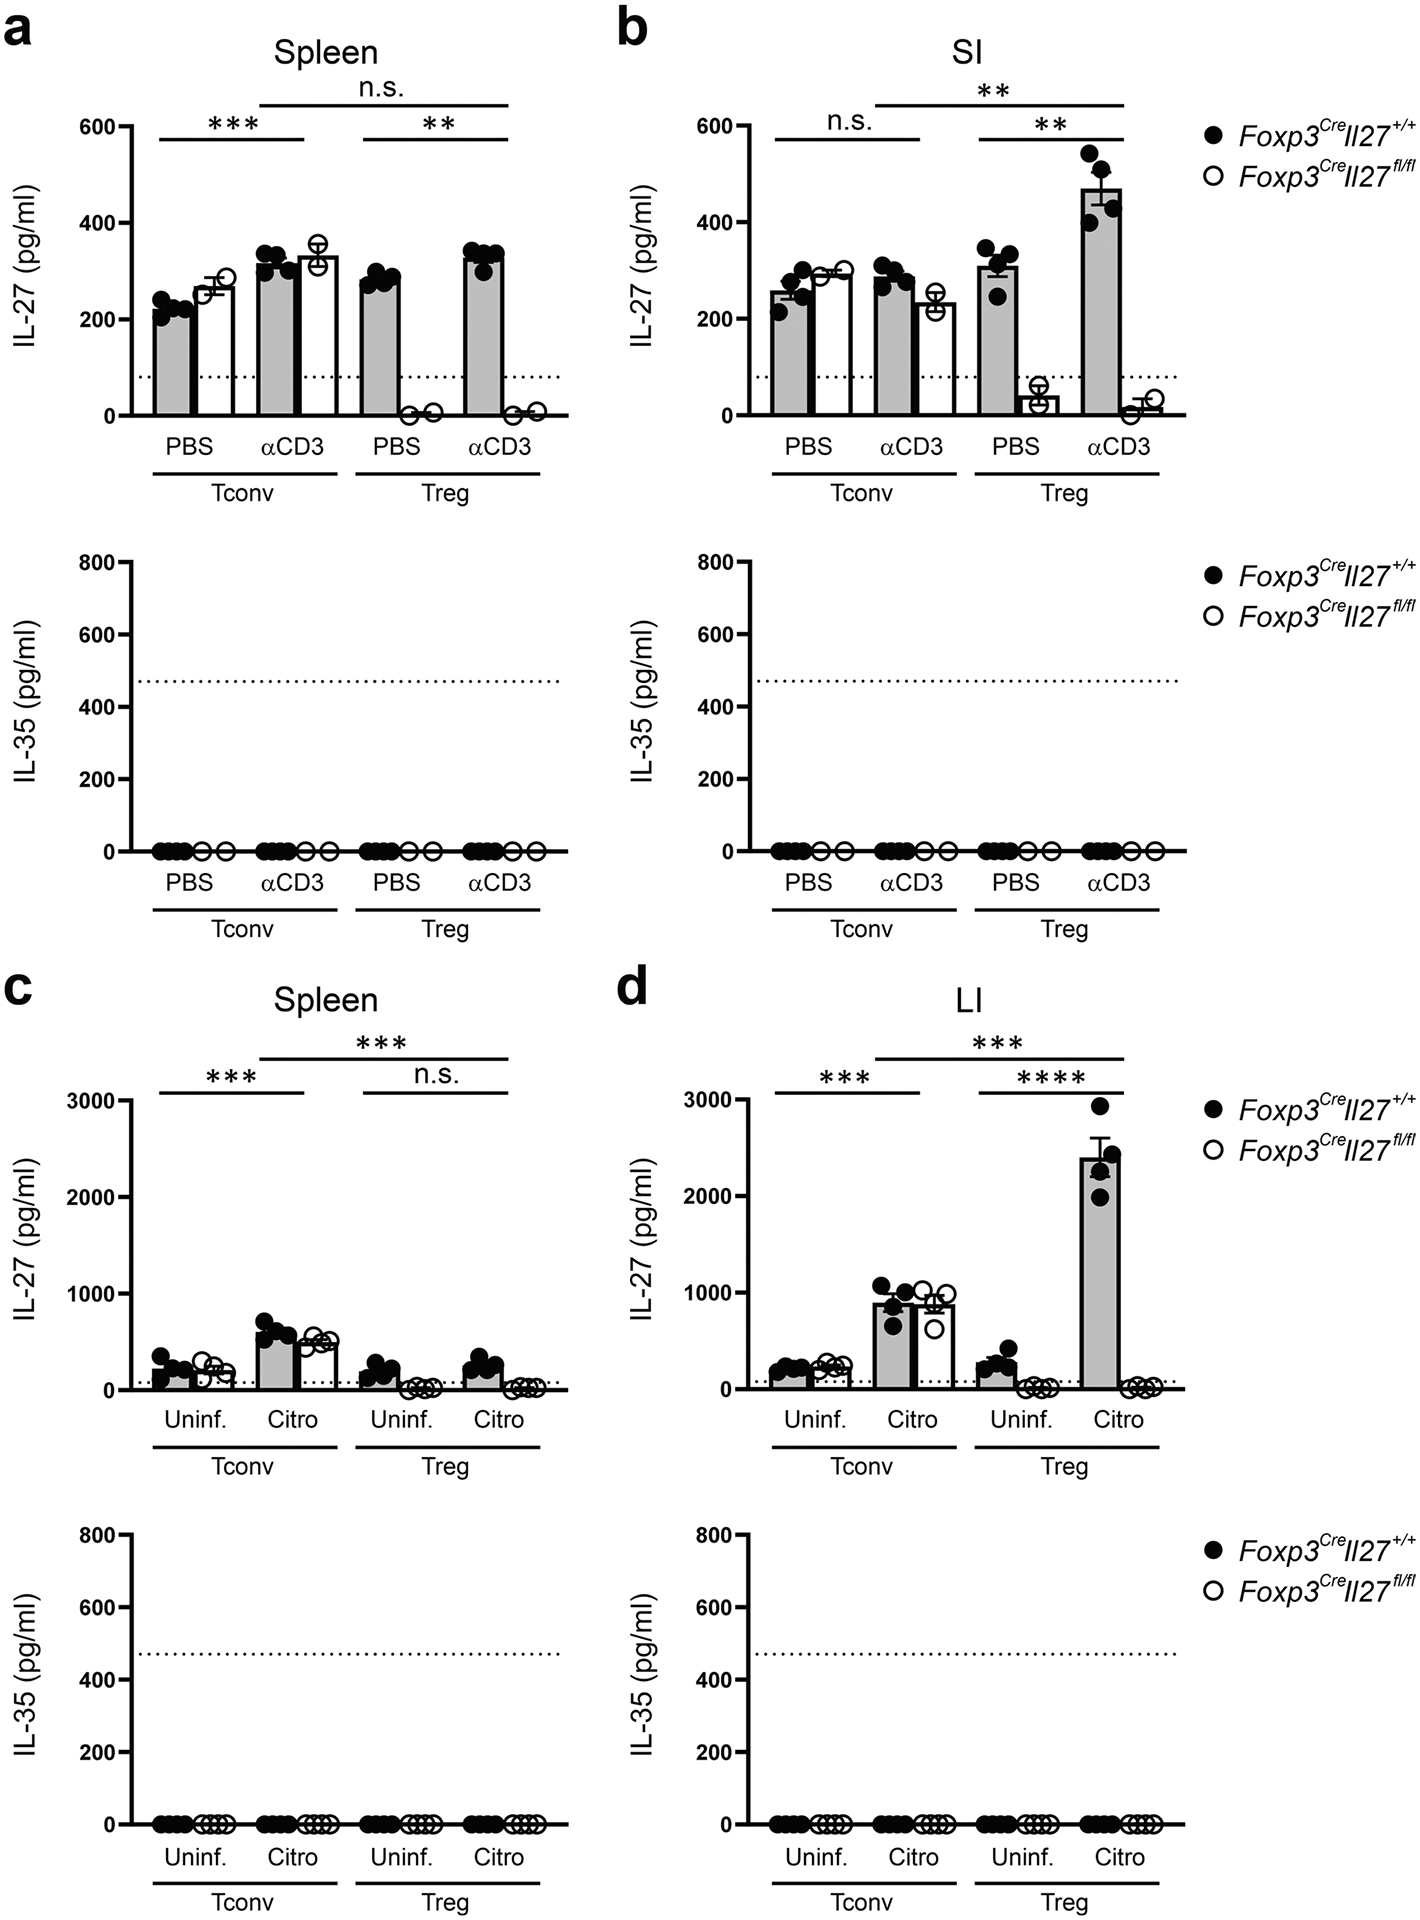
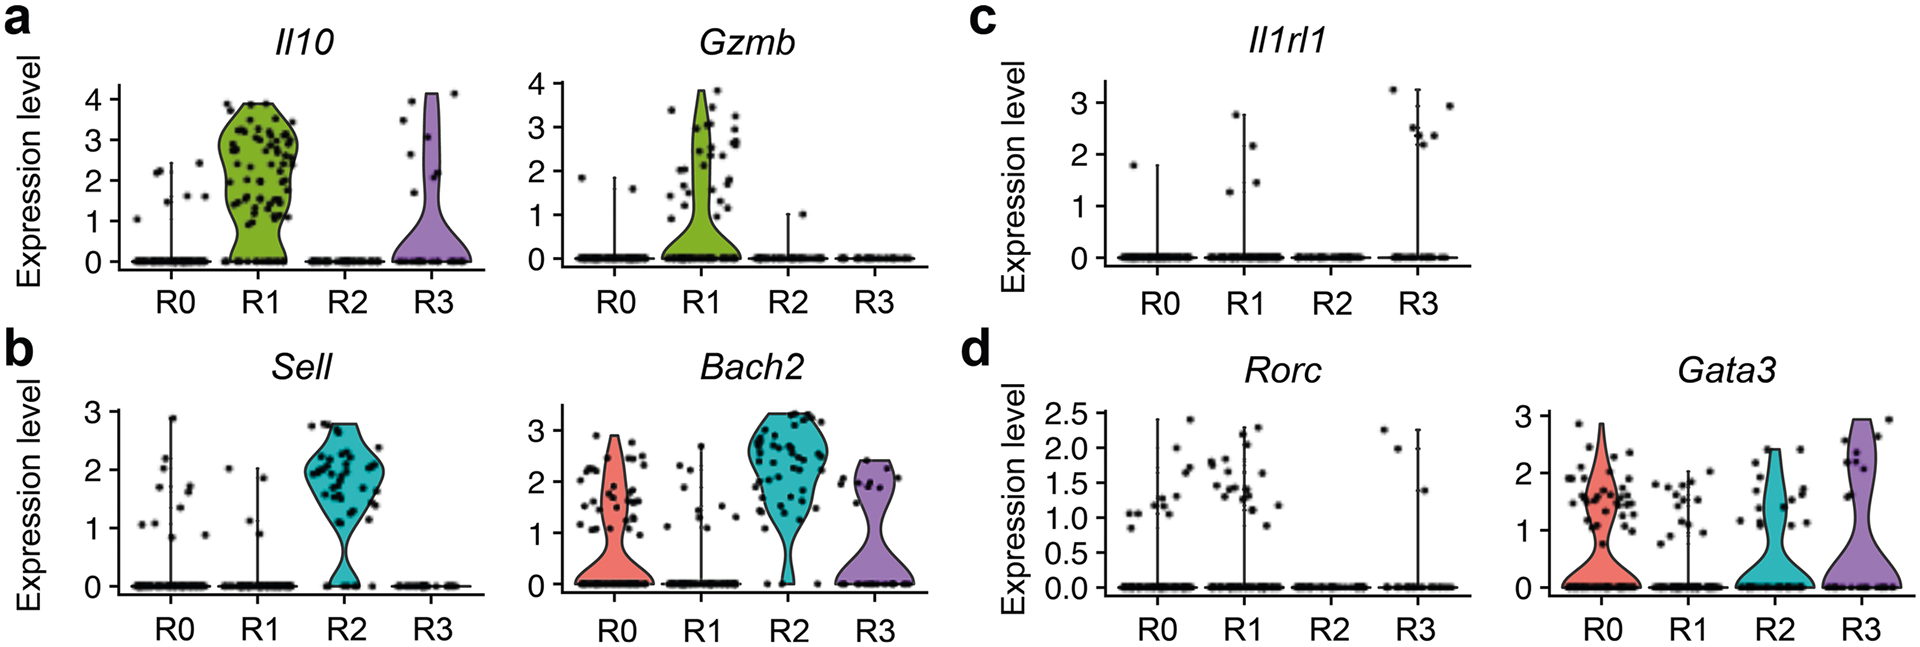
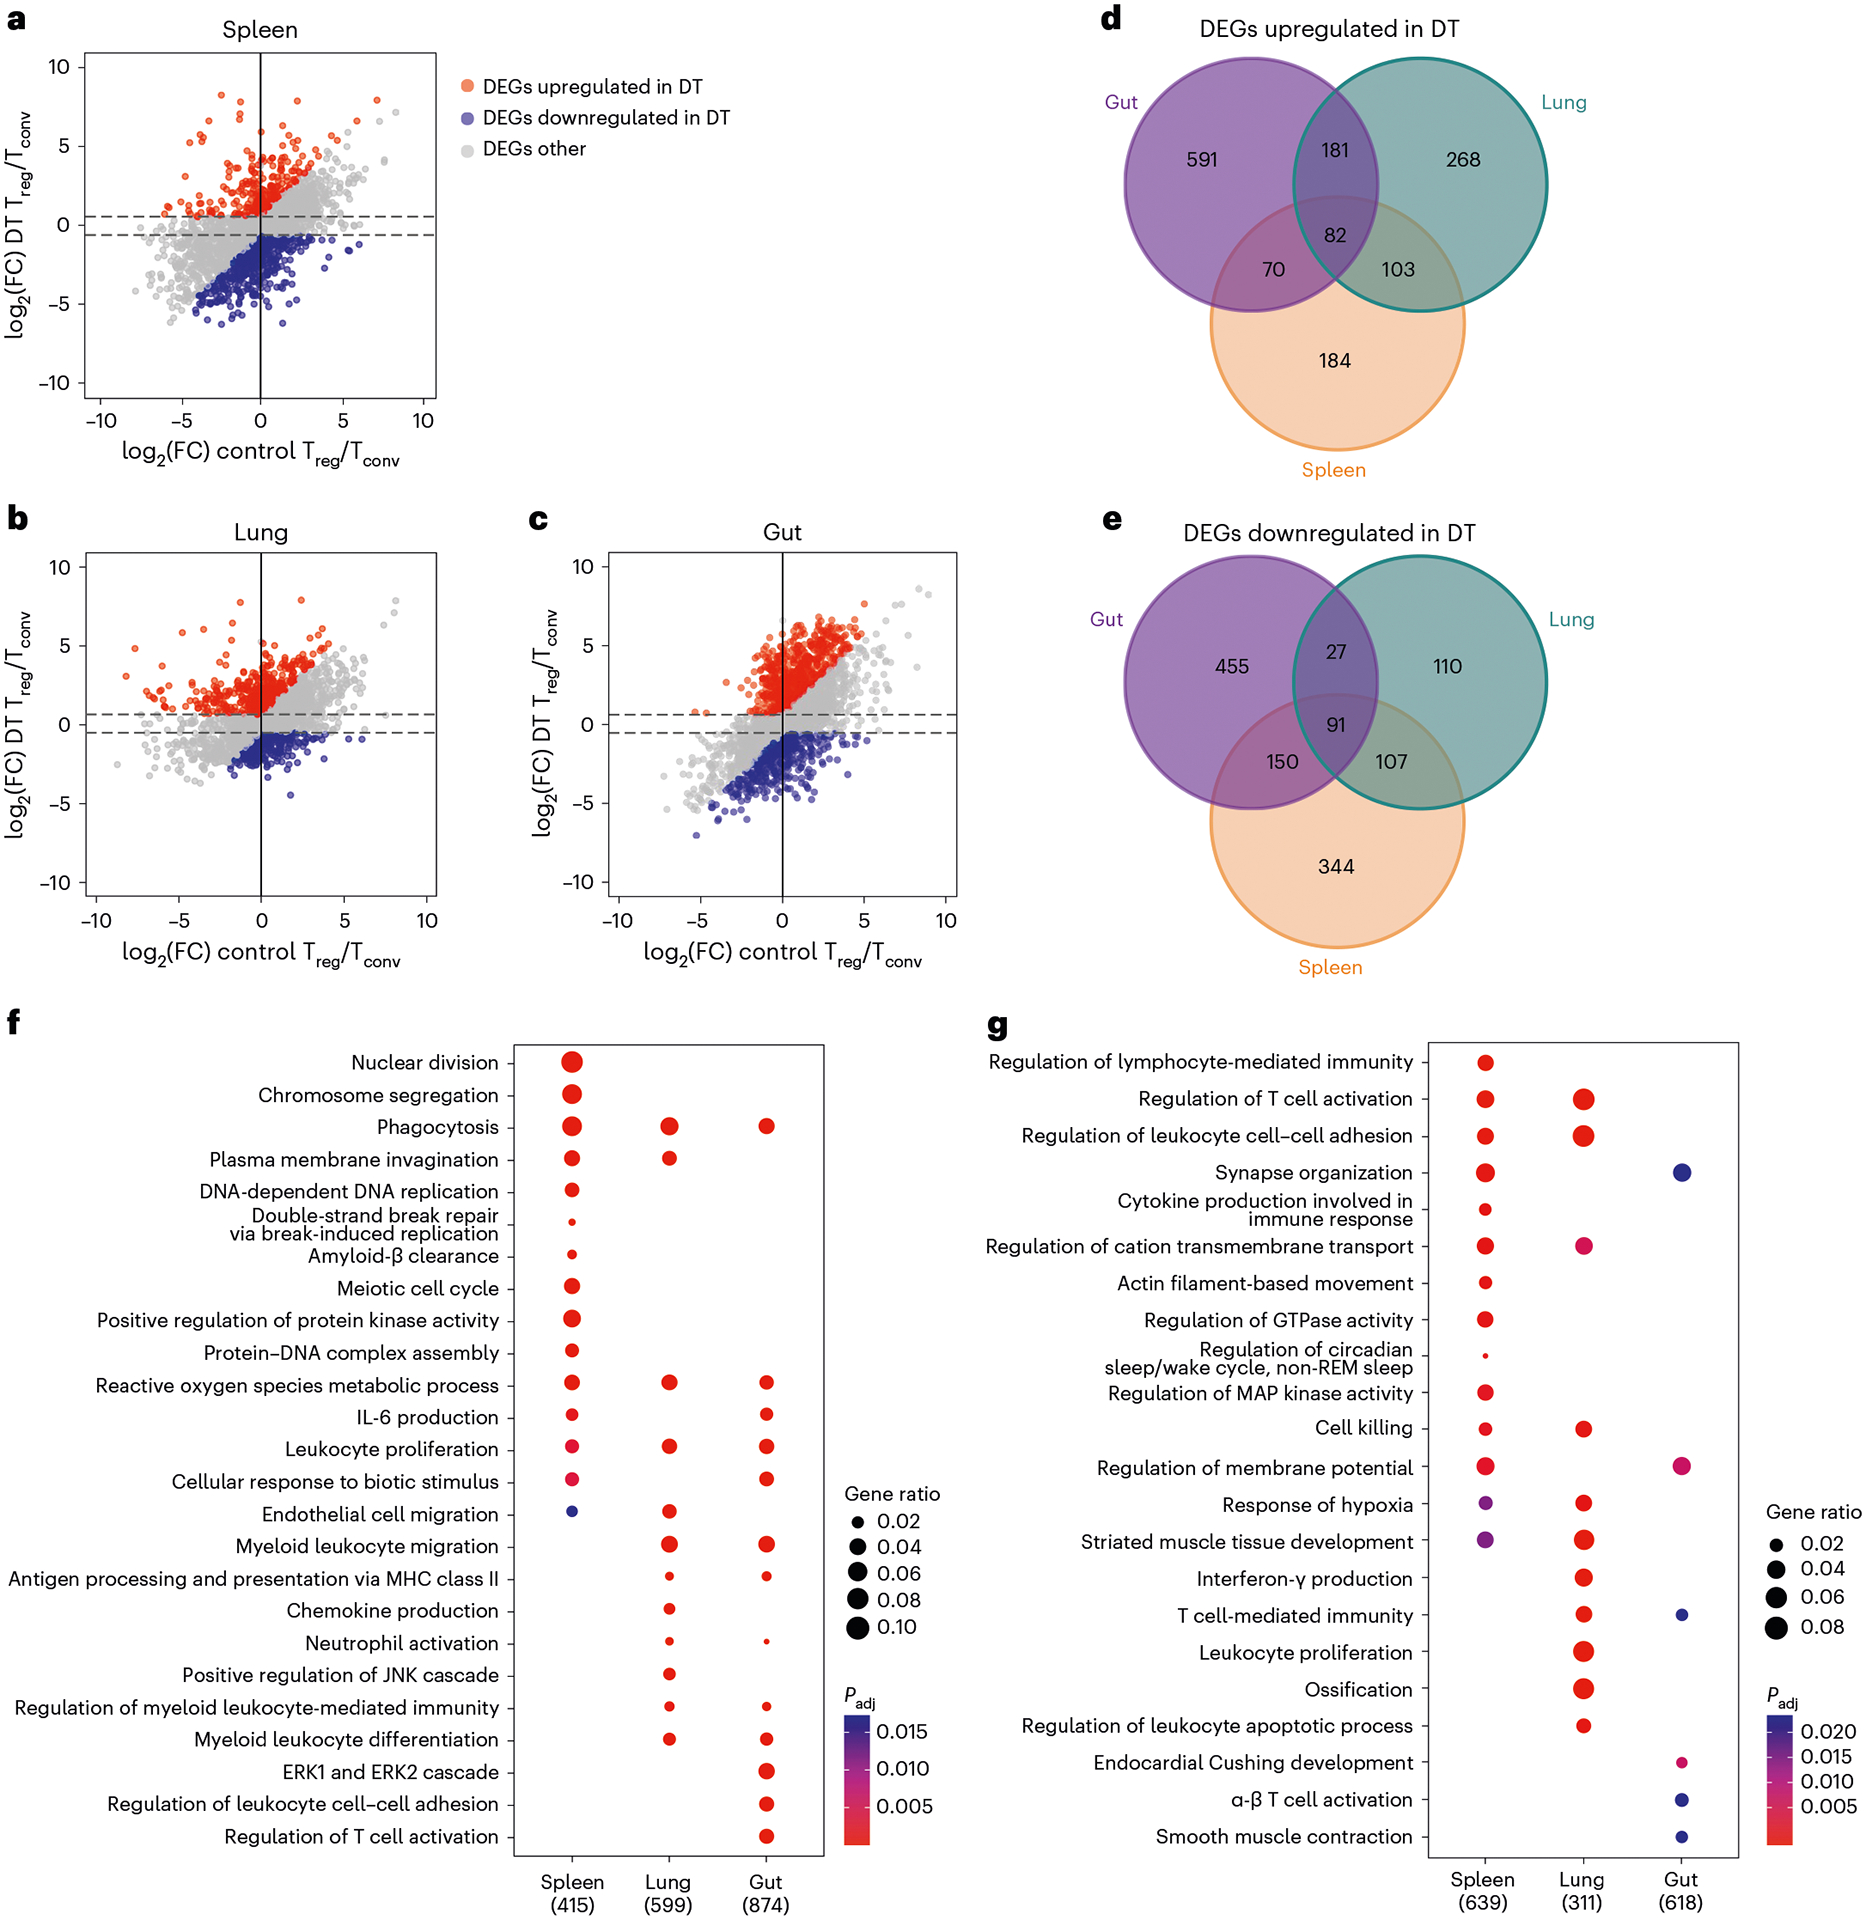
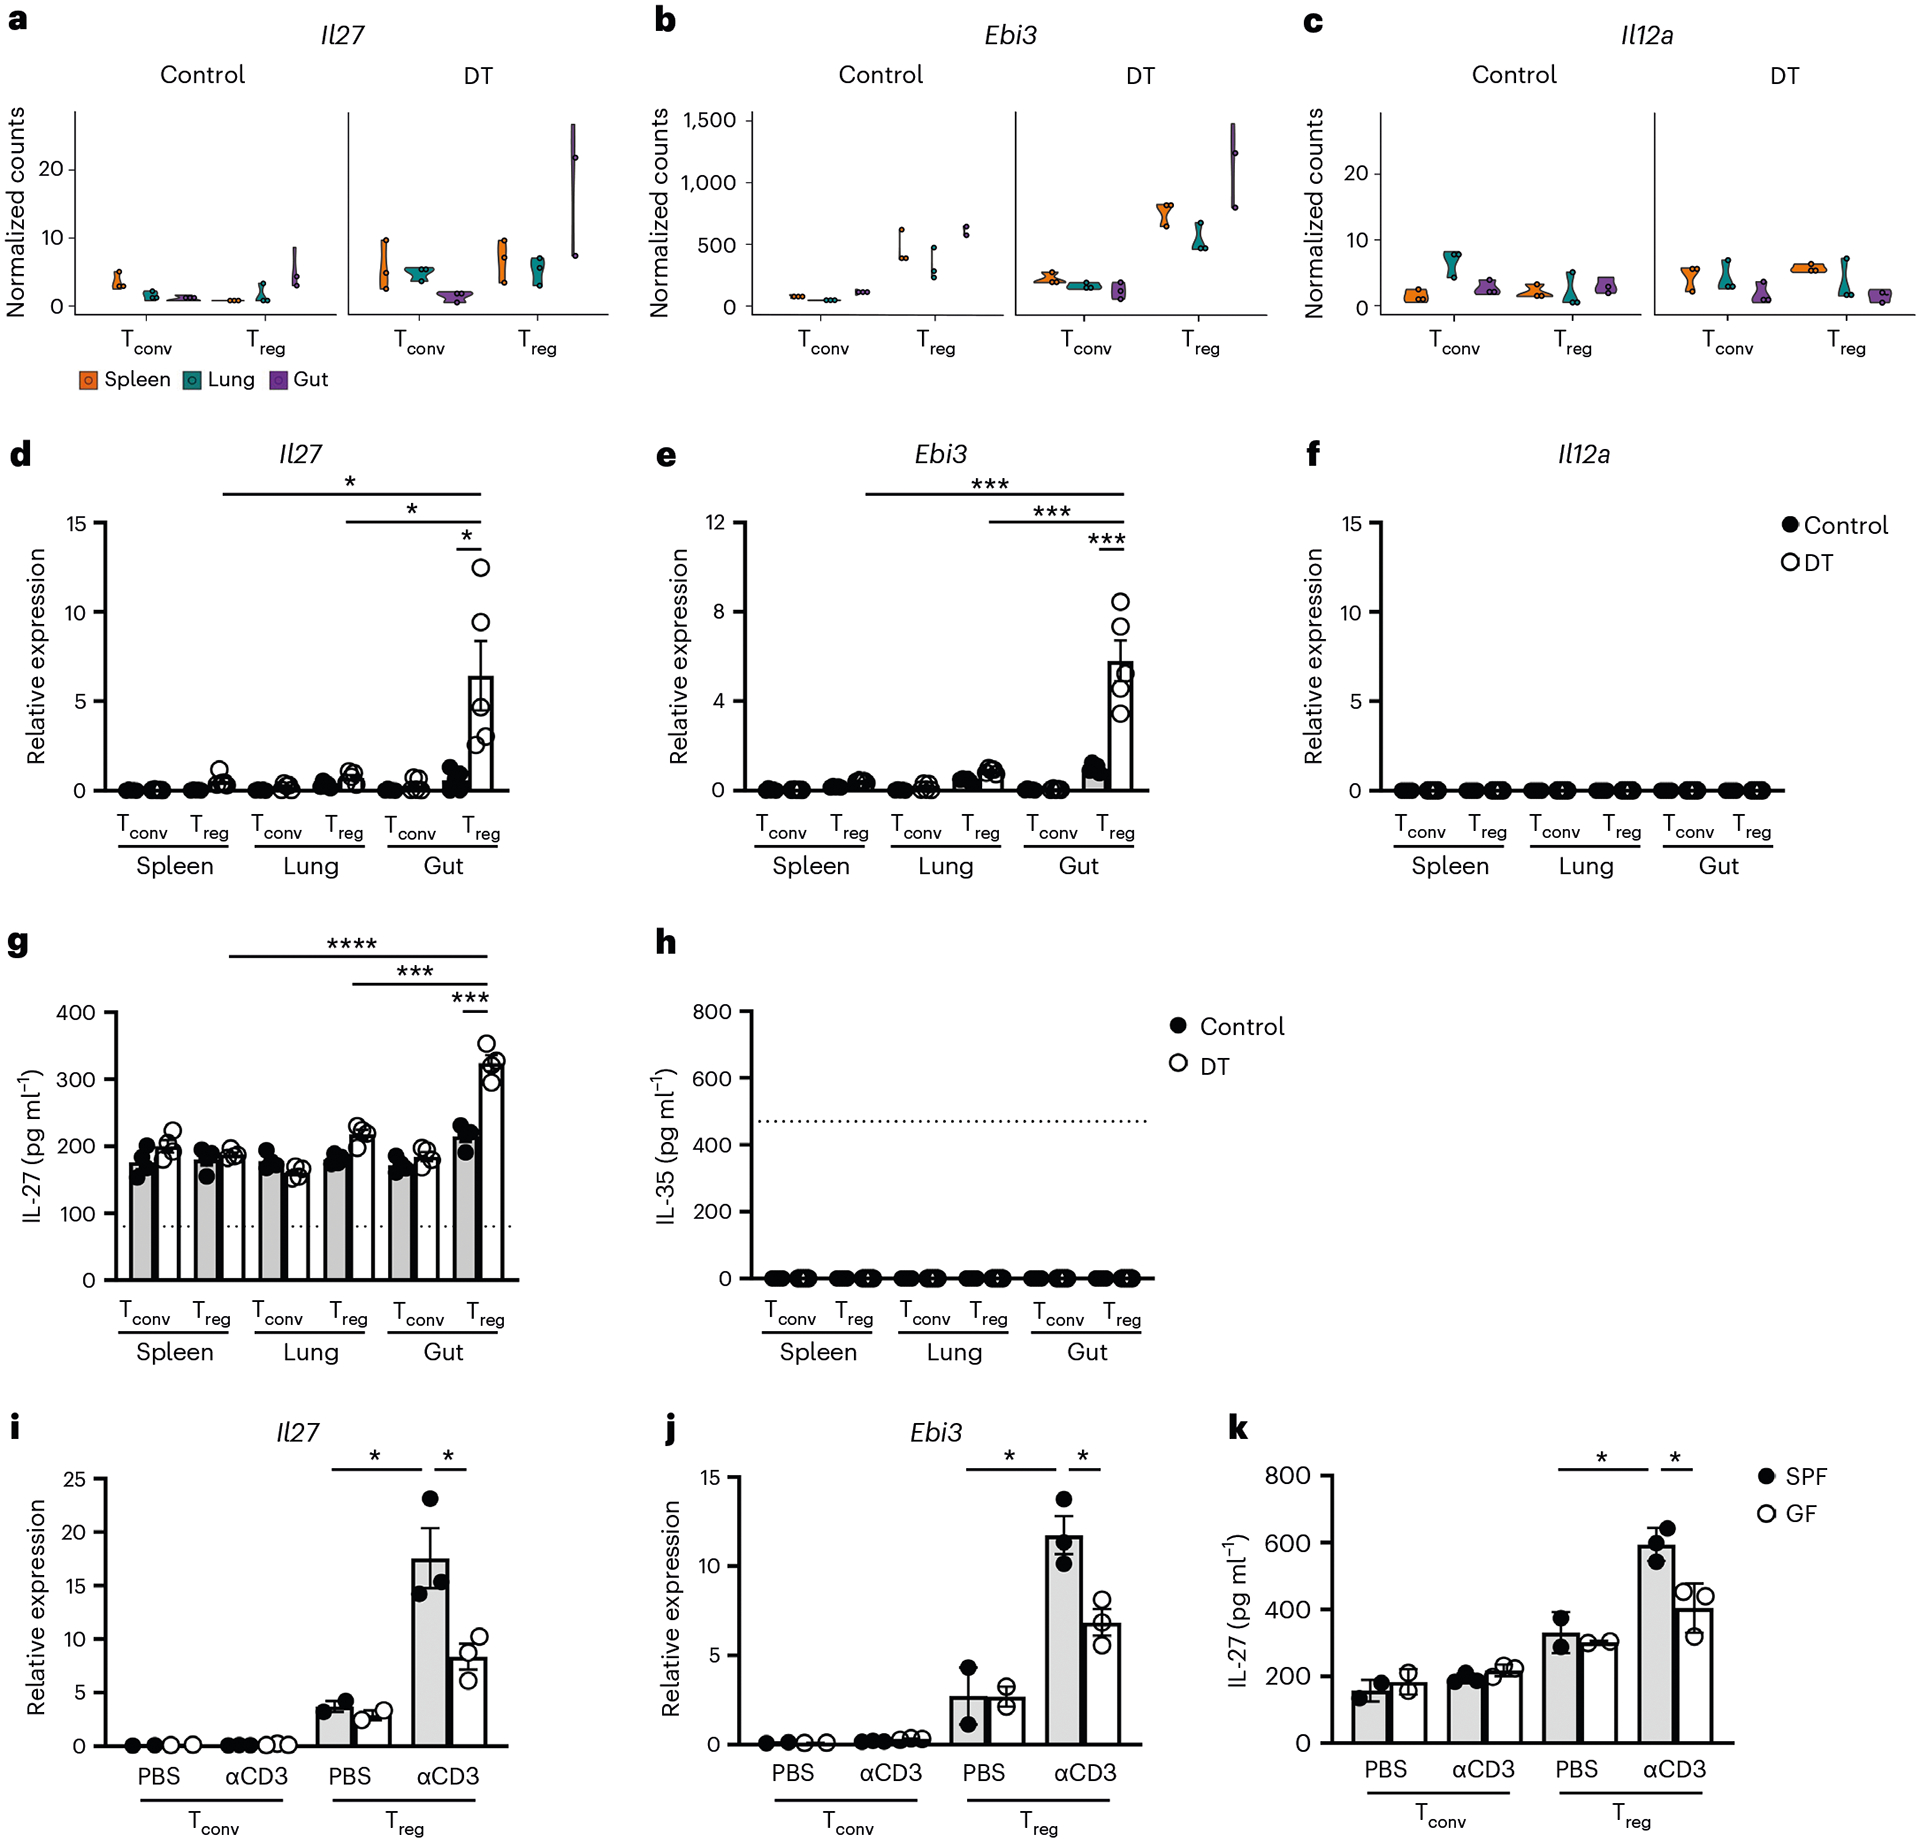
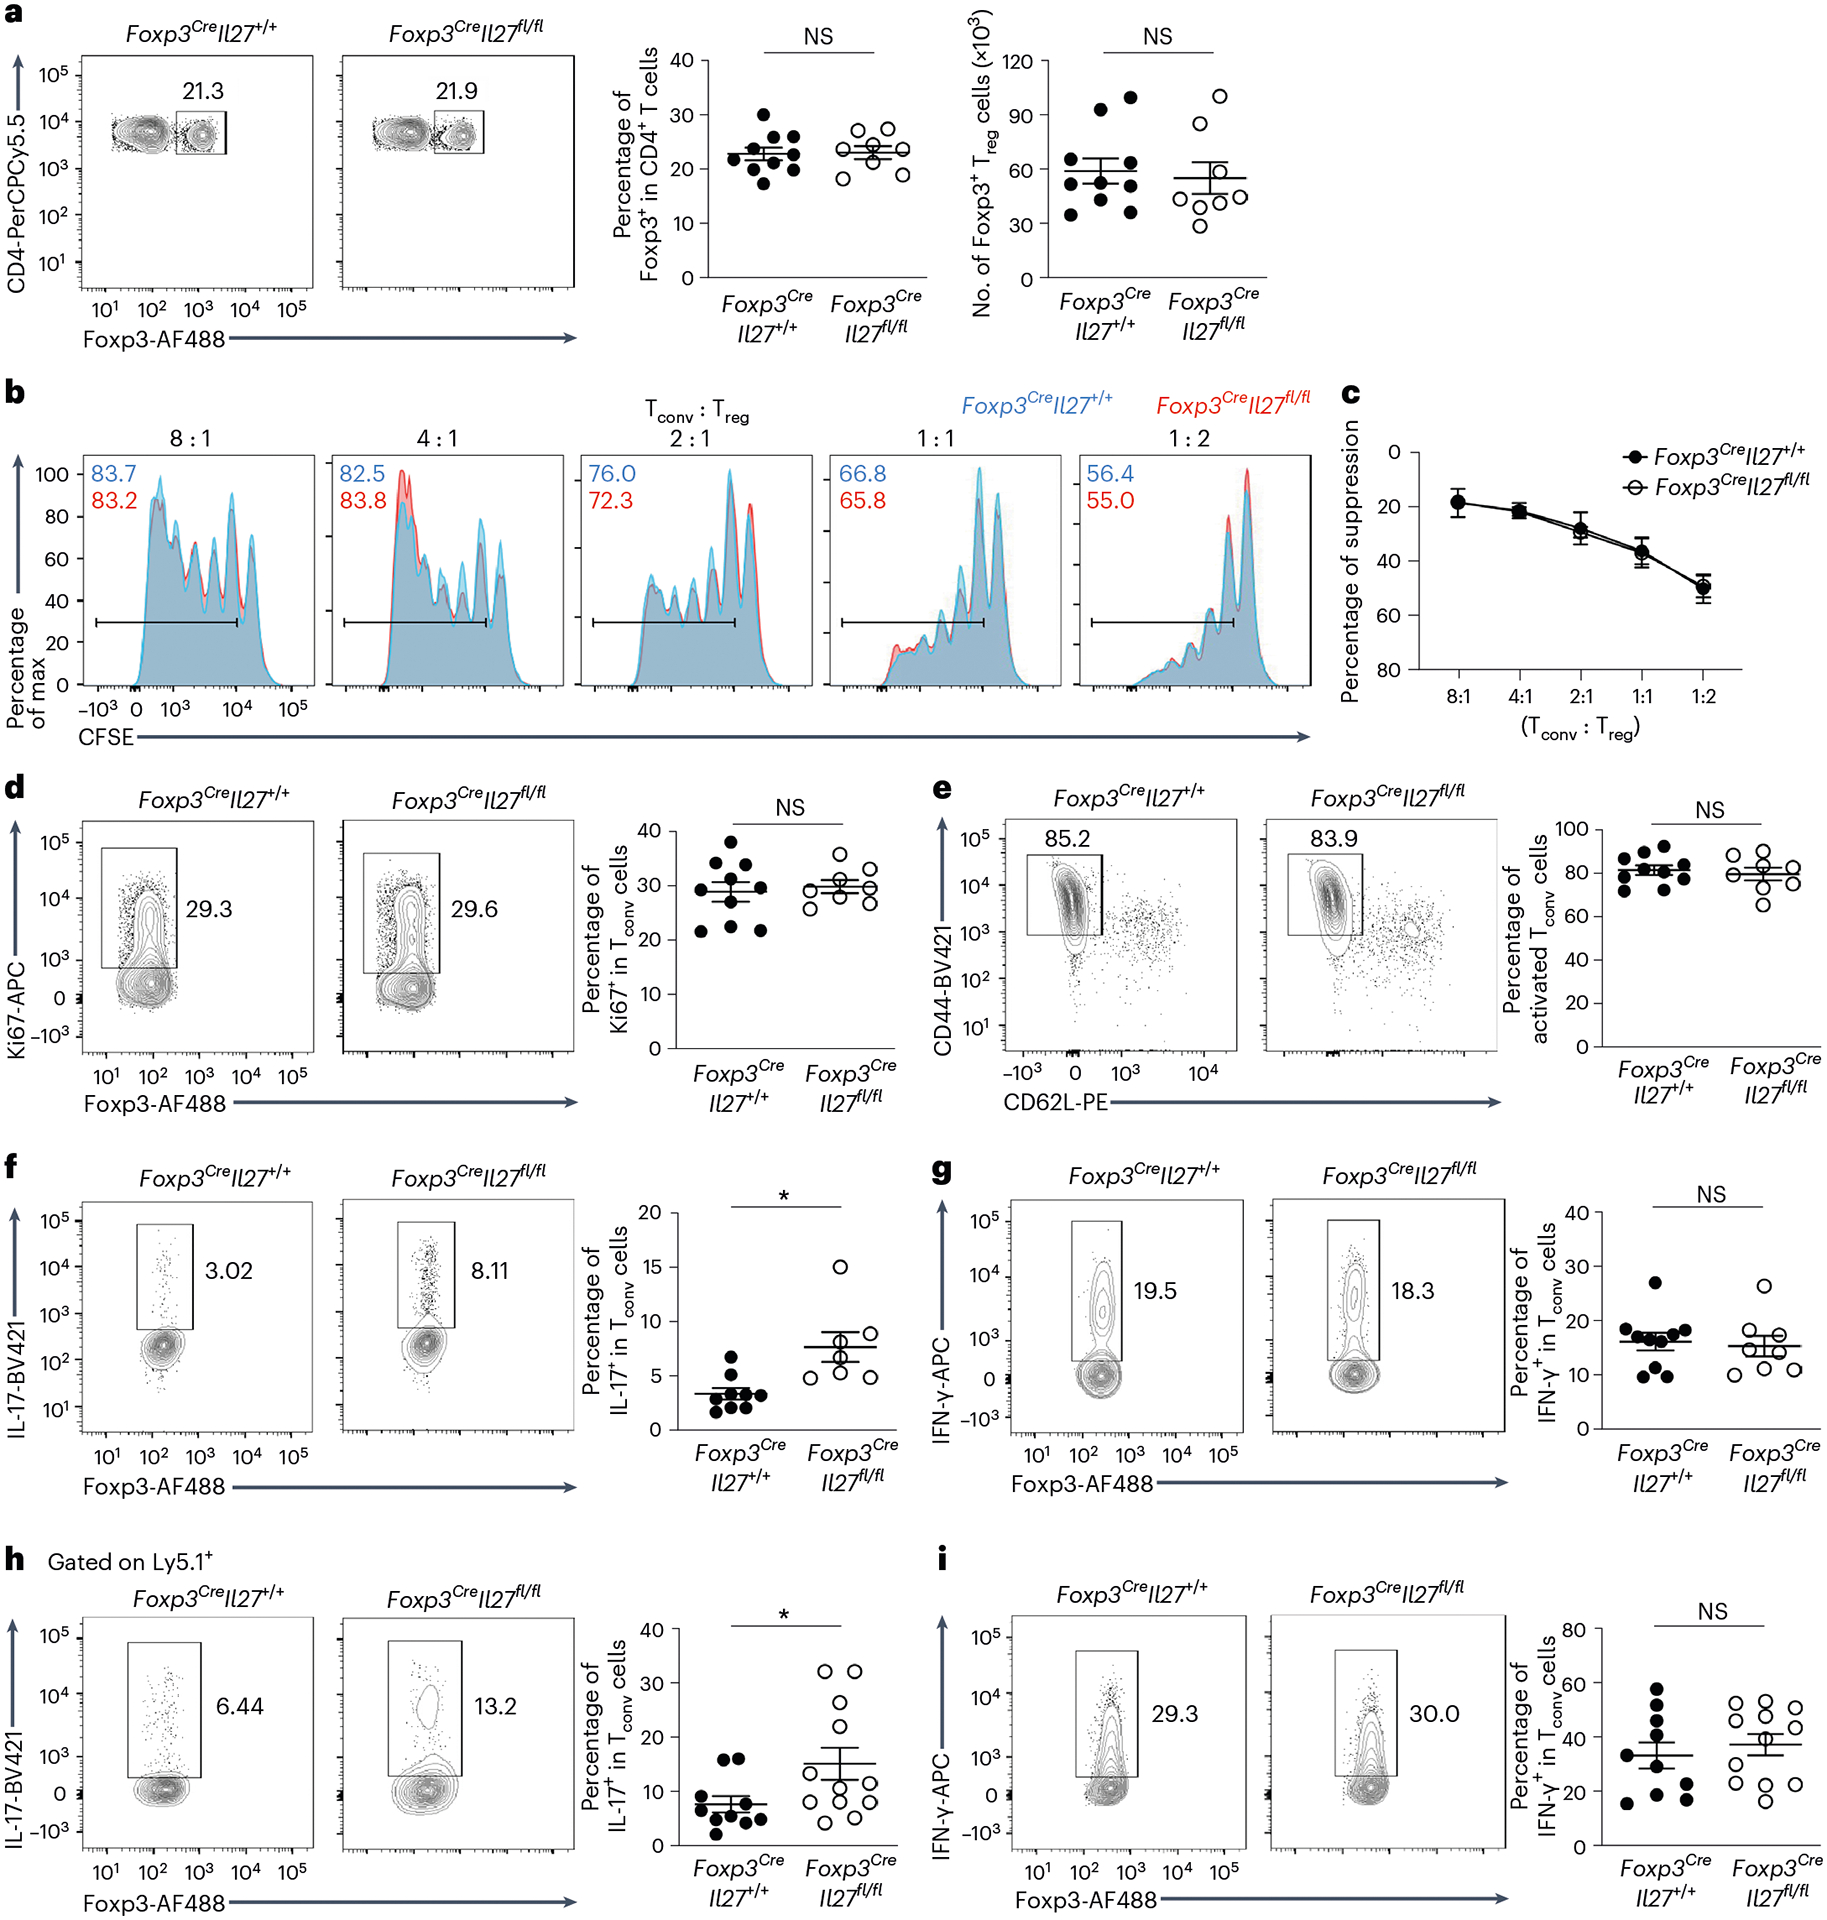
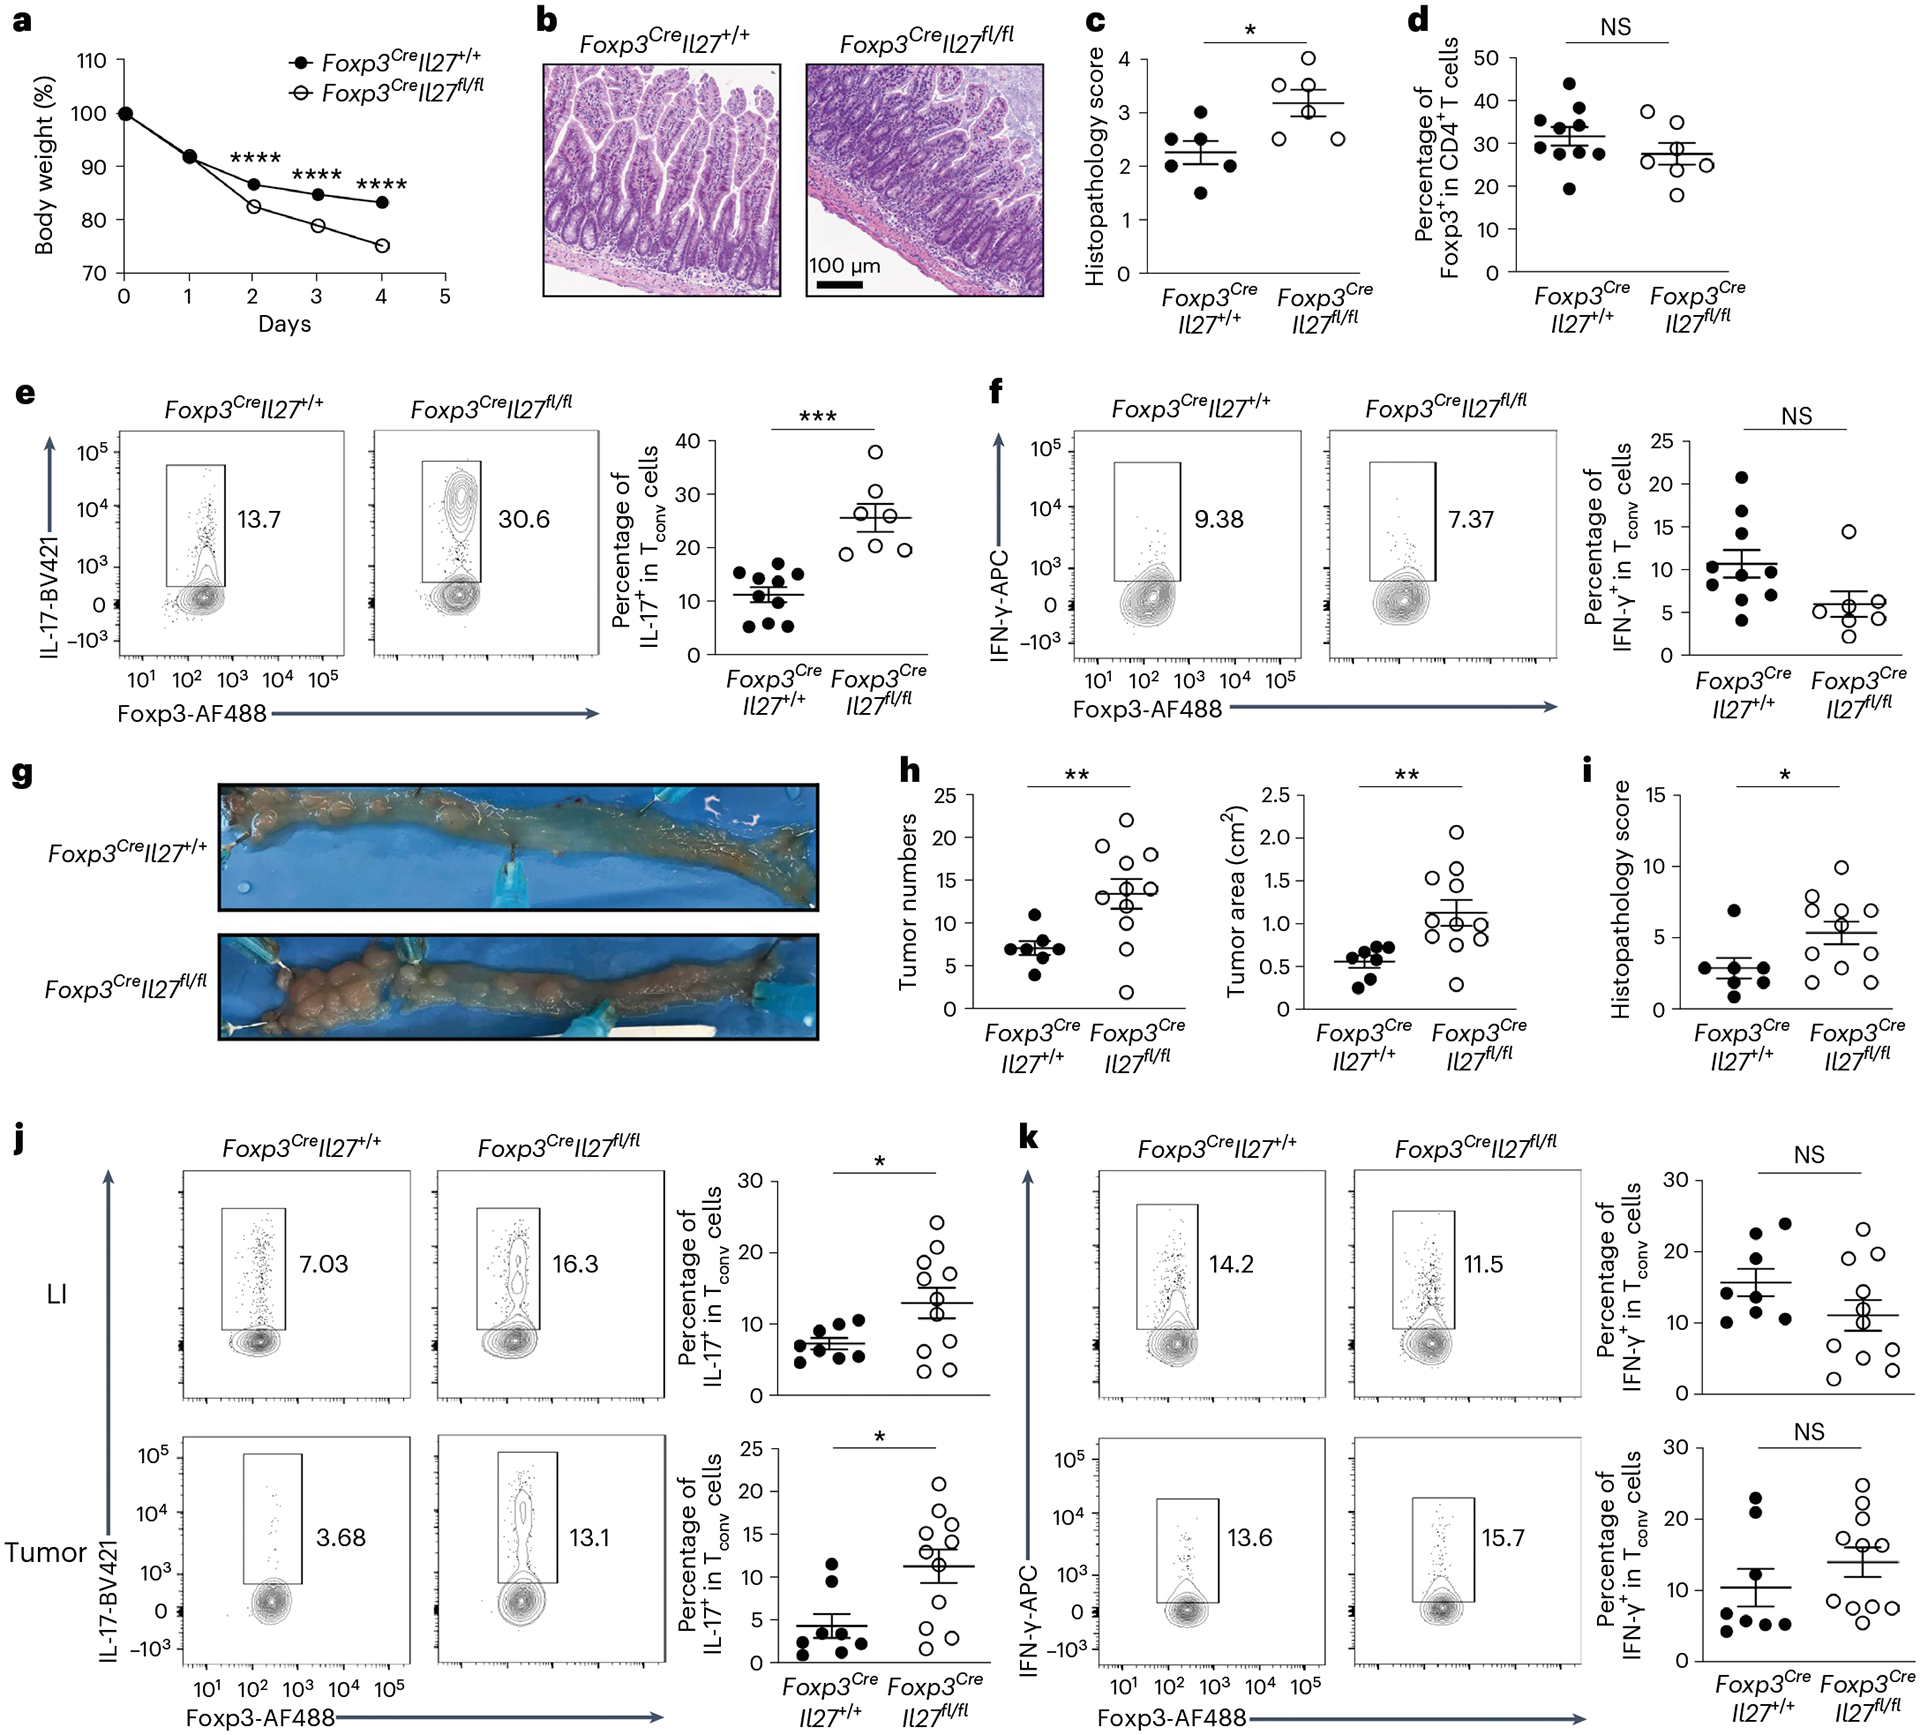
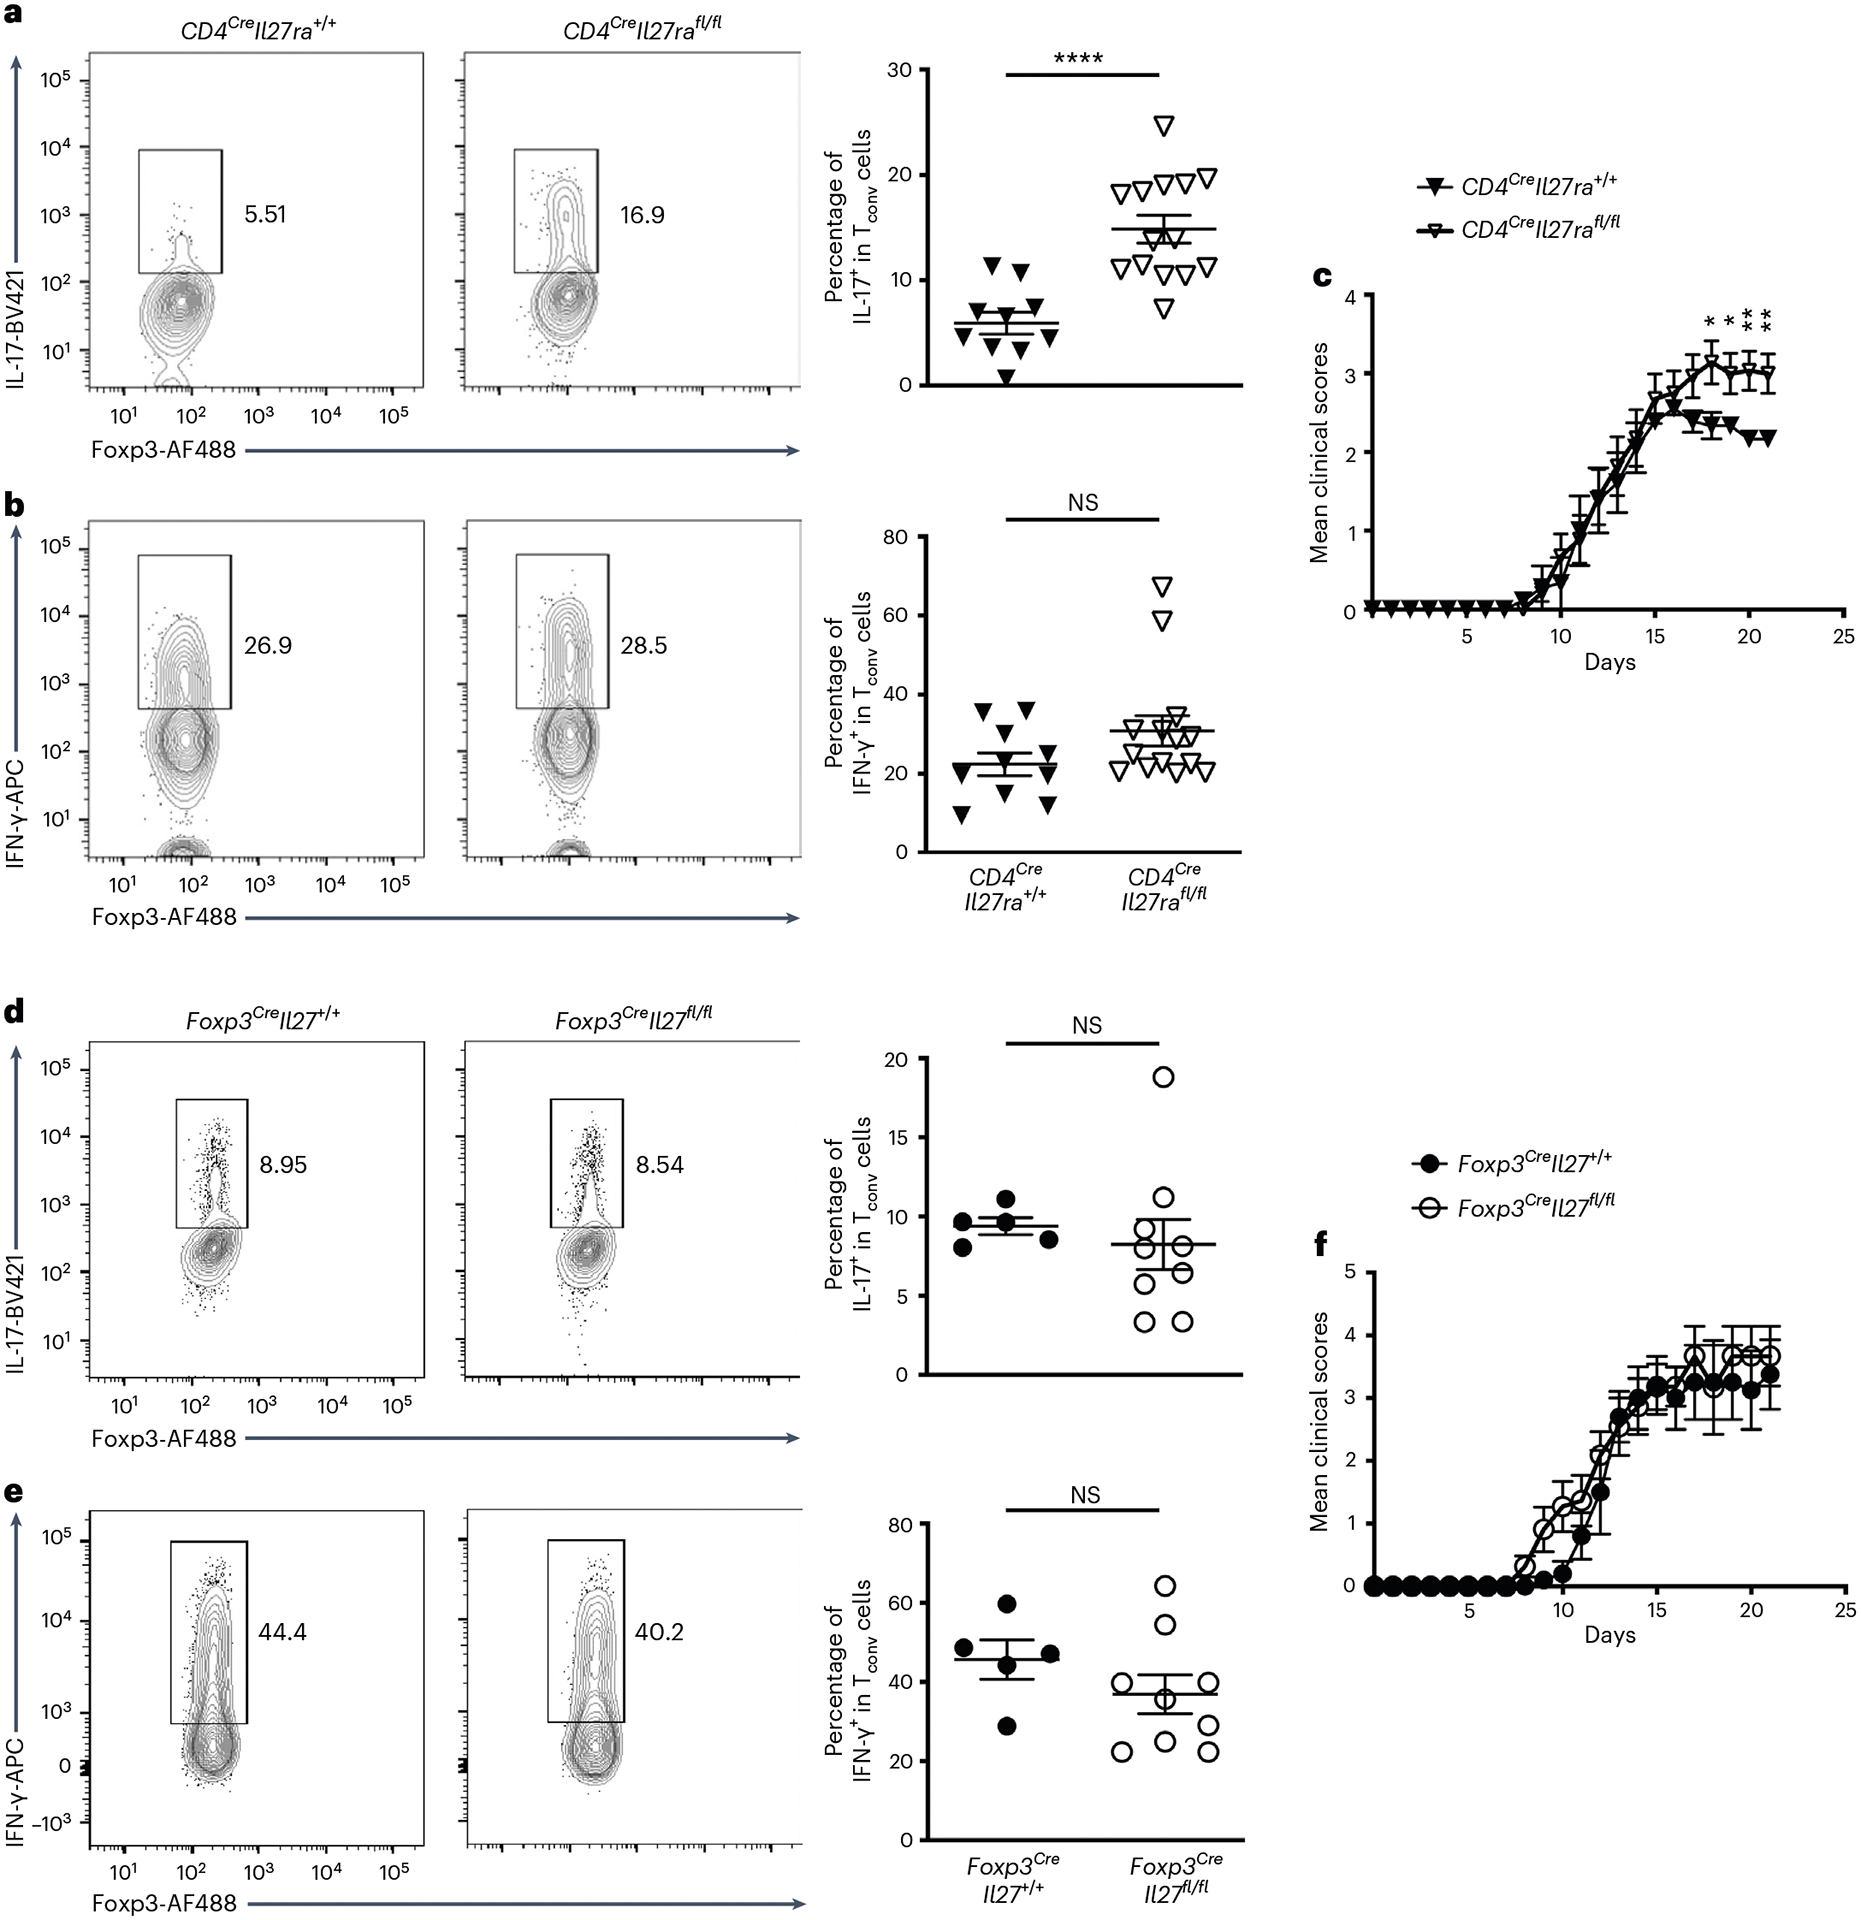
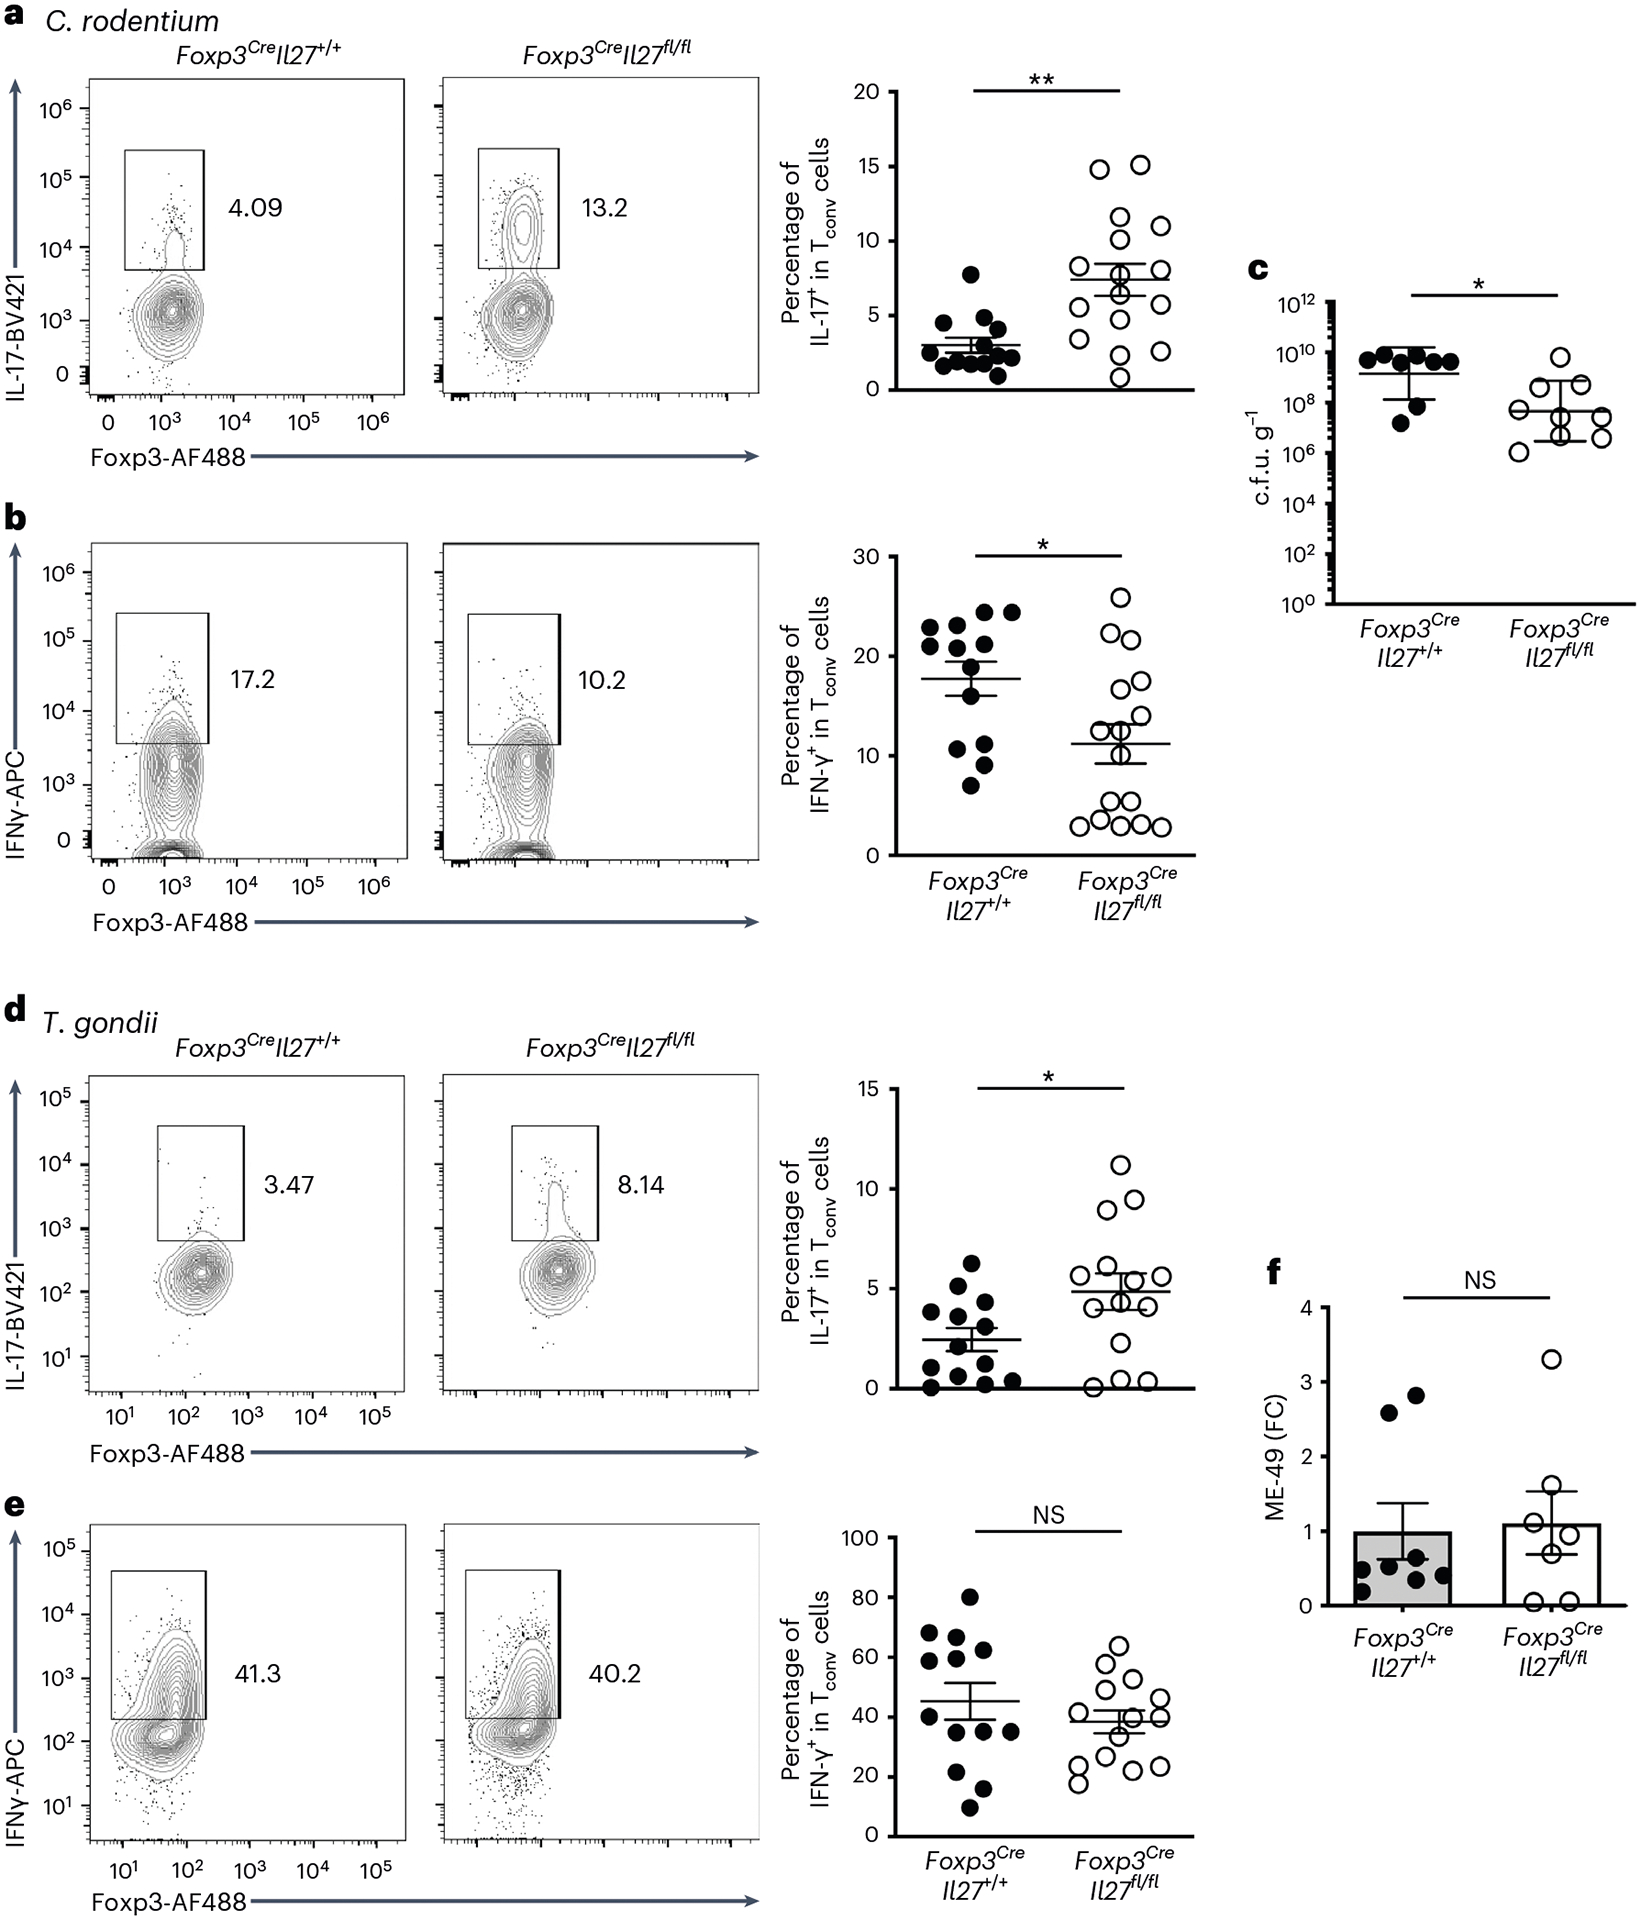
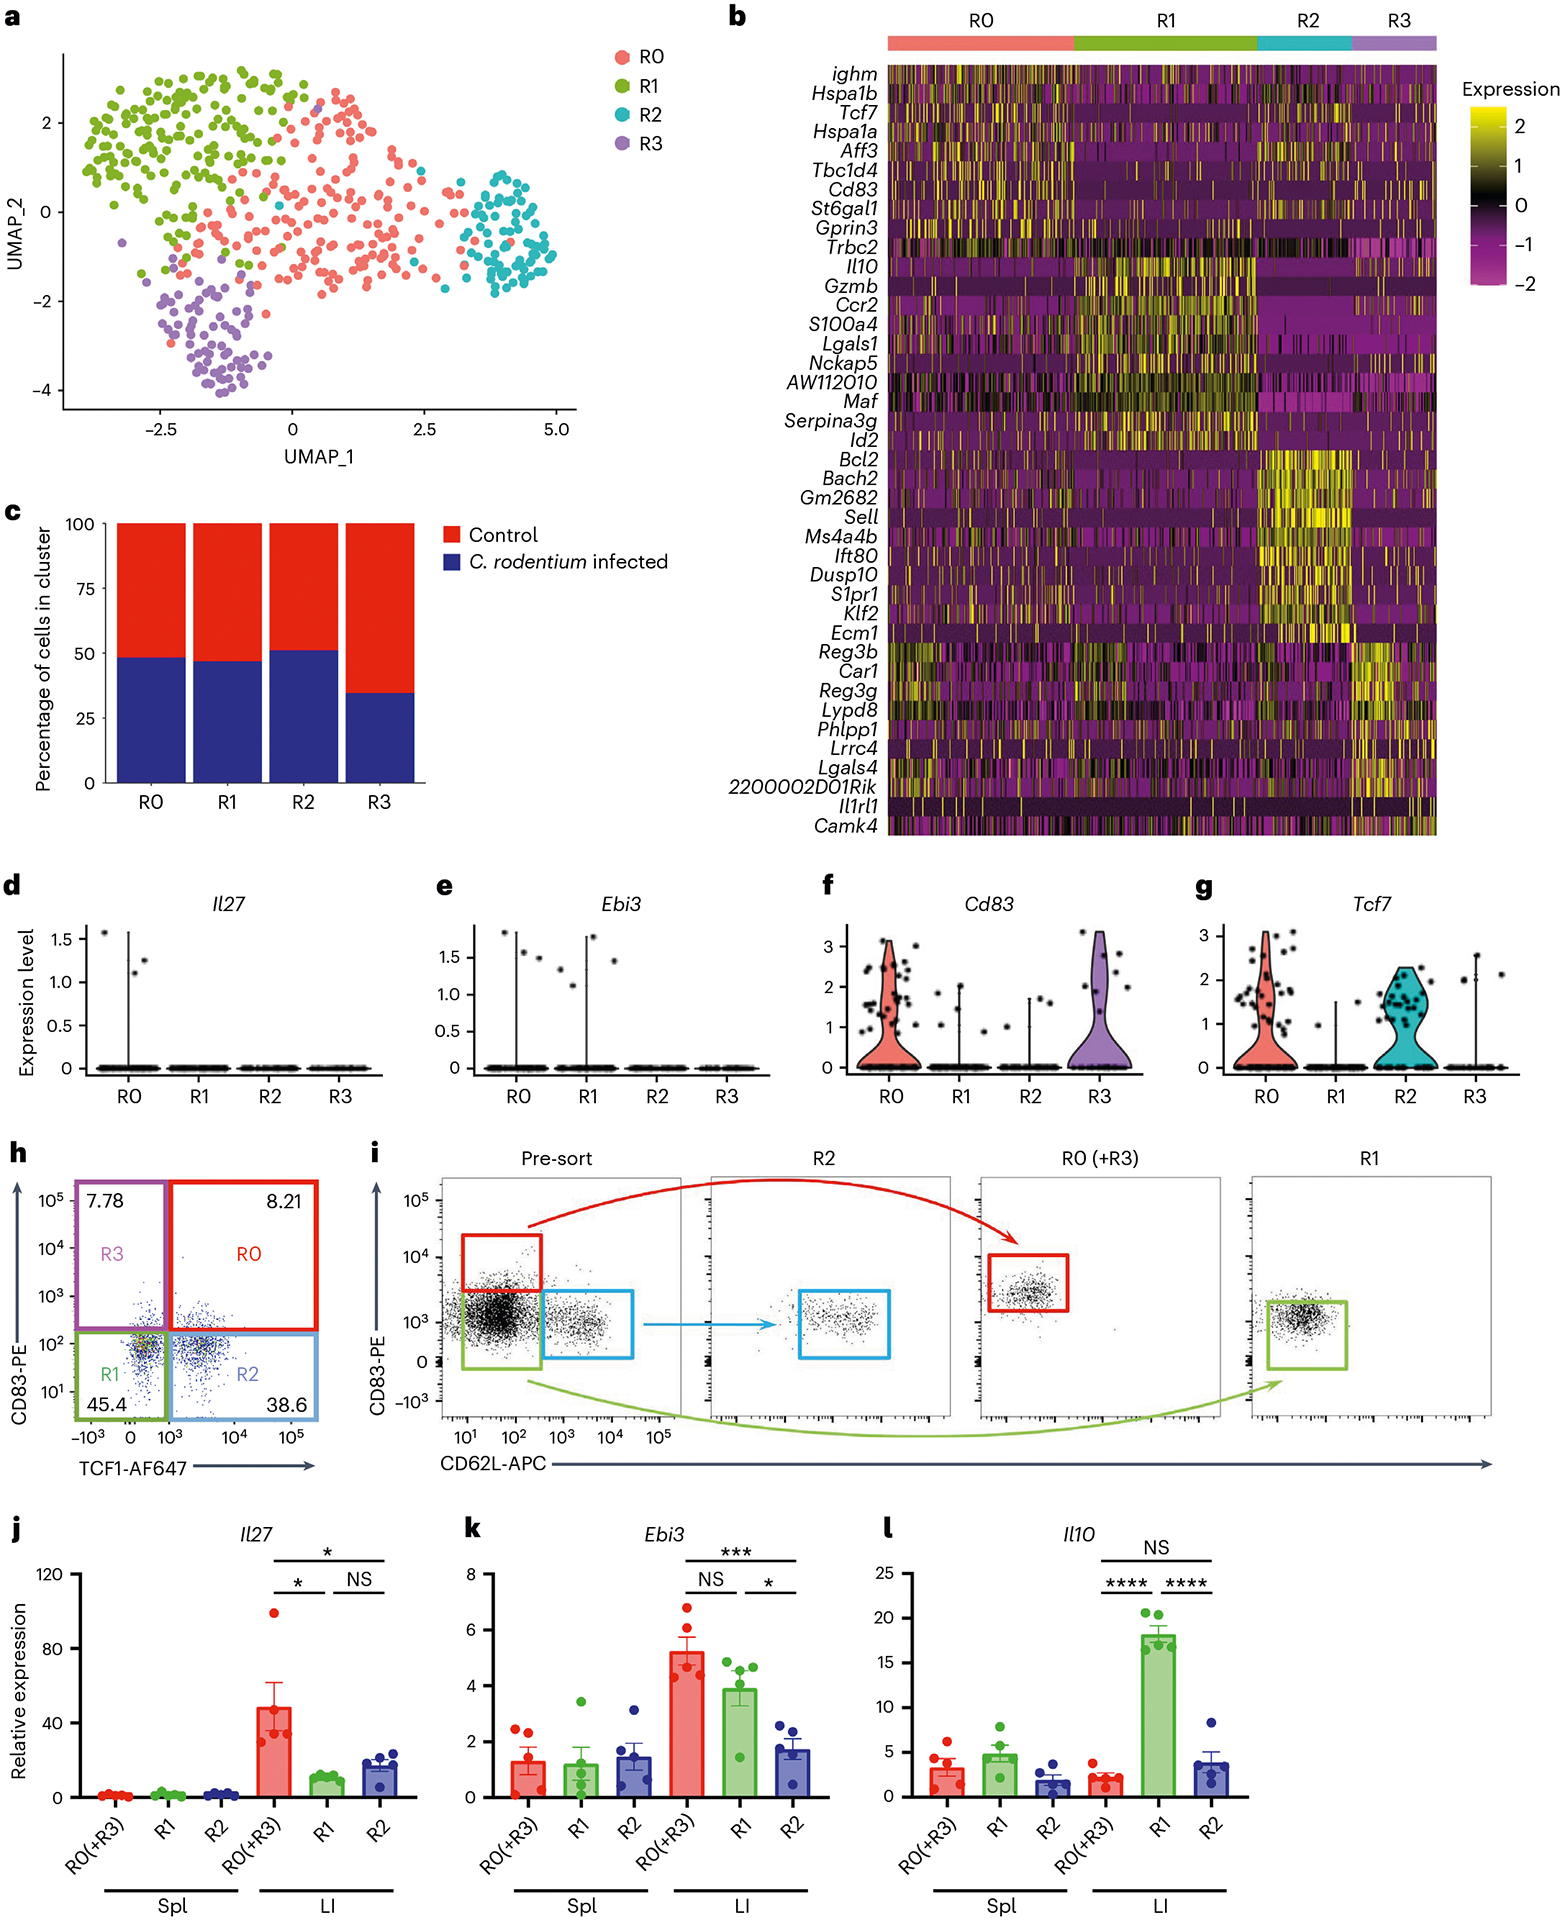
Regulatory T cells (Treg cells) are instrumental in establishing immunological tolerance. However, the precise effector mechanisms by which Treg cells control a specific type of immune response in a given tissue remains unresolved. By simultaneously studying Treg cells from different tissue origins under systemic autoimmunity, in the present study we show that interleukin (IL)-27 is specifically produced by intestinal Treg cells to regulate helper T17 cell (TH17 cell) immunity. Selectively increased intestinal TH17 cell responses in mice with Treg cell-specific IL-27 ablation led to exacerbated intestinal inflammation and colitis-associated cancer, but also helped protect against enteric bacterial infection. Furthermore, single-cell transcriptomic analysis has identified a CD83+CD62Llo Treg cell subset that is distinct from previously characterized intestinal Treg cell populations as the main IL-27 producers. Collectively, our study uncovers a new Treg cell suppression mechanism crucial for controlling a specific type of immune response in a particular tissue and provides further mechanistic insights into tissue-specific Treg cell-mediated immune regulation.


Conflict of interest statement

L.-F.L. is a scientific advisor for Elixiron Immunotherapeutics and receives research grants from AstraZeneca, Avidity Biosciences and Molecular Axiom. E.I., J.B., M.N., M.C. and R.A.M are or were employees of AstraZeneca and may own stock or stock options. As such, they declare that they are bound by confidentiality agreements that prevent them from disclosing their competing interests in this work. The remaining authors declare no competing interests.

Figures

Extended Data Fig. 1 |
Extended Data Fig. 1 |. Establishing an in vivo experimental model to simultaneously study active suppressor program in different tissue Treg cell subsets.
a, Schematic of the experimental model for studying Treg cell-mediated control of systemic autoimmunity. FACS analysis and frequencies of b, Ki67+ and c, CD25+ cells within the Tconv cells gated on the live CD4+Foxp3 population (or Treg cells gated on the live CD4+Foxp3+ population) in spleens of control PBS-treated or DT-treated Foxp3DTR mice with or without transfer of Foxp3Thy1.1+ Treg cells. Each symbol represents an individual mouse (n = 6). Data are presented as mean values +/− SD. In b, ****P < 0.0001 (up); ****P < 0.0001 (bottom left); ****P < 0.0001 (bottom right). In c, *P = 0.0352 (up); ****P < 0.0001 (bottom left); ****P < 0.0001 (bottom right). Statistical significance was determined by two-tailed unpaired t test. d, Heatmap of selected genes characteristic of activated T cells as well as Th1, Th2 and Th17 subsets that were expressed in Tconv cells isolated from indicated tissues in control PBS-treated or DT-treated Foxp3DTR mice 10 days after Treg cell transfer. Heatmaps of top 10% of most variable genes in Treg cells isolated from indicated tissues in e, control PBS-treated or f, DT-treated Foxp3DTR mice 10 days after Treg cell transfer. g, PCA of gene expression by different Treg and Tconv cell subsets. Different cell samples were grouped by treatment (top) or anatomical location (bottom).
Extended Data Fig. 2 |
Extended Data Fig. 2 |. Tissue Treg cells consistently produced high levels of IL-10 regardless of the presence or absence of inflammatory conditions.
a, qPCR analyses for the expressions of Il10 in Tconv and Treg cells in different tissues from control PBS- or DT-treated Foxp3DTR mice. Each symbol represents an individual mouse (n = 5). b, ELISA analyses of the production of IL-10 by Tconv and Treg cells in different tissues from control PBS- or DT-treated Foxp3DTR mice. Each symbol represents FACS-isolated cell sample pooled from two to three mice (n = 4). Dotted line represents the minimum detection limit of the cytokine. Data are presented as mean values +/− SD. In a, **P = 0.0021 (up); **P = 0.0084 (middle); n.s. = 0.4266 (bottom). In b, **P = 0.0081 (up), *P = 0.0385 (middle); n.s. = 0.3009 (bottom). Statistical significance was determined by two-tailed unpaired t test.
Extended Data Fig. 3 |
Extended Data Fig. 3 |. Loss of IL-27 produced by Treg cells did not lead to any obvious immune phenotype except for increased Th17 responses in the intestine.
Frequencies and numbers of Foxp3+ Treg cells and frequencies of Ki67+, CD44hiCD62Llo, IL-17+, and IFNγ+ Tconv cells gated on the live CD4+Foxp3 population in a, spleen and b, LI LP of Foxp3CreIl27fl/fl mice and WT littermates (~8–12 weeks). c, FACS analysis and d, frequencies of RORgt+ in Tconv cells gated on the live CD4+Foxp3 population in spleen and SI LP of Foxp3CreIl27fl/fl mice and WT littermates (~8–12 weeks). e, Frequencies of IL-17+ in RORgt+ Tconv cells gated on the live CD4+Foxp3 population in spleen and SI LP of Foxp3CreIl27fl/fl mice and WT littermates (~8–12 weeks). f, Frequencies of IL-17+ and IFNγ+ Ly5.1+ Teff cells (isolated from Foxp3KO mice) gated on the live CD4+Foxp3 population in spleens of RAG-deficient mice three weeks after co-transferred with Treg cells isolated from either Foxp3CreIl27fl/fl mice or WT littermates. Each symbol represents an individual mouse. Data are presented as mean values +/− SD. In a, from right to left: n.s. = 0.2762 (n = 10 for Foxp3CreIl27+/+; 8 for Foxp3CreIl27fll/fl); n.s. = 0.2290 (n = 9 for Foxp3CreIl27+/+; 7 for Foxp3CreIl27fll/fl); n.s. = 0.9168 (n = 8 for Foxp3CreIl27+/+; 7 for Foxp3CreIl27fll/fl); n.s. = 0.9197 (n = 8 for Foxp3CreIl27+/+; 7 for Foxp3CreIl27fll/fl); n.s. = 0.2547 (n = 9 for Foxp3CreIl27+/+; 7 for Foxp3CreIl27fll/fl); n.s. = 0.3885 (n = 10 for Foxp3CreIl27+/+; 8 for Foxp3CreIl27fll/fl). In b, from right to left: n.s. = 0.7752; n.s. = 0.5144; n.s. = 0.5537; n.s. = 0.8933; *P = 0.0155; n.s. = 0.0577 (n = 8). In d, Spl: n.s. = 0.9907; SI: **P = 0.0025 (n = 7). In e, Spl: n.s. = 0.7866; SI: n.s. = 0.4099 (n = 7). In f, IL-17: n.s. = 0.7980; IFNγ: n.s. = 0.7652 (n = 12). Statistical significance was determined by two-tailed unpaired t test.
Extended Data Fig. 4 |
Extended Data Fig. 4 |. Treg cell-derived IL-27 likely limits Th17 responses through directly acting on T cells.
FACS analysis and frequencies of a, IL-17+ and b, IFNγ+ cells in Tconv cells gated on the live CD4+Foxp3 population cultured in the presence or absence of IL-27 (100 ng/ml) under Th17 and Th1 polarizing conditions, respectively. Each symbol represents an individual experiment (n = 3). qPCR analyses for the expressions of c, Il1b, d, Il6, e, Tgfb, f, ll23p19, g, Il12p40, and h, Il12p35 in DCs isolated from SI LP of either Foxp3CreIl27fl/fl mice or WT littermates. Each symbol represents FACS-isolated cell sample pooled from two to three mice (n = 2). Data are presented as mean values +/− SD. In a, ***P = 0.0009. In b, n.s. = 0.8920. Statistical significance was determined by two-tailed unpaired t test.
Extended Data Fig. 5 |
Extended Data Fig. 5 |. IL-27 produced by other non-Treg intestinal resident cell types is not required for IL-27-mediated regulation of Th17 responses.
FACS analysis of IL-17+ Tconv cells gated on the live CD4+Foxp3 population in SI LP of a, CD4CreIl27rafl/fl mice, b, LysMCreIl27fl/fl, c, CD11cCreIl27fl/fl, d, Vil1CreIl27fl/fl, and their corresponding WT littermates ( ~ 8–12 weeks). e, n-fold changes (on the basis of corresponding WT controls) of IL-17+ Tconv cell frequencies in indicated mouse lines. FACS analysis of IL-17+ Tconv cells gated on the live CD4+Foxp3 population in SI LP of f, CD4CreIl27rafl/fl mice g, LysMCreIl27fl/fl, h, CD11cCreIl27fl/fl, i, Vil1CreIl27fl/fl, and their corresponding WT littermates 4 days after initial aCD3 mAb injection. j, n-fold changes (on the basis of corresponding WT controls) of IL-17+ Tconv cell frequencies in indicated mouse lines. Each symbol represents an individual mouse. Data are presented as mean values +/− SD. In e, from left to right: **P = 0.0065 (n = 7); **P = 0.006 (n = 8); n.s. = 0.7795 (n = 8); n.s. = 0.7158 (n = 11); n.s. = 0.5244 (n = 12). In j, from left to right: ***P = 0.001 (n = 6); ***P = 0.001 (n = 5); n.s. = 0.1755 (n = 9); n.s. = 0.6306 (n = 7); n.s. = 0.4163 (n = 7). Statistical significance was determined by two-tailed unpaired t test.
Extended Data Fig. 6 |
Extended Data Fig. 6 |. Elevated IL-27 production by intestinal Treg cells could be observed in other autoimmune- and infection-driven inflammatory settings.
ELISA analyses of the production of IL-27 or IL-35 by Tconv and Treg cells in a, spleen and b, SI LP from PBS or aCD3 mAb treated Foxp3CreIl27fl/fl mice and WT littermates. Each symbol represents FACS-isolated cell sample pooled from two to three mice (n = 4 for Foxp3CreIl27+/+; 2 for Foxp3CreIl27fll/fl). ELISA analyses of the production of IL-27 or IL-35 by Tconv and Treg cells in c, spleen and d, LI LP from Foxp3CreIl27fl/fl mice and WT littermates at day 10 post C. rodentium infection. Each symbol represents FACS-isolated cell sample pooled from two to three mice (n = 4). Dotted line represents the minimum detection limit of the indicated cytokine. Data are presented as mean values +/− SD. In a, n.s. = 0.4560 (top); ***P = 0.0003 (bottom left); **P = 0.0090 (bottom right). In b, **P = 0.0021 (top); n.s. = 0.2264 (bottom left); **P = 0.0074 (bottom right). In c, ***P = 0.0005 (top), ***P = 0.0010 (bottom left), n.s. = 0.2535 (bottom right). In d, ***P = 0.0005 (top), ***P = 0.0003 (bottom left), ****P < 0.0001 (bottom right). Statistical significance was determined by two-tailed unpaired t test.
Extended Data Fig. 7 |
Extended Data Fig. 7 |. Expression of known intestinal Treg cell markers in different Treg cell clusters.
Violin plots of a, Il10 and Gzmb, b, Sell and Bach2, c, Il1rl1, and d, Rorc and Gata3 in different intestinal Treg cell clusters from C. rodentium-infected mice.
Fig. 1 |
Fig. 1 |. Transcriptomic analysis of tissue Treg cells during active suppression of local inflammatory responses.
ac, Scatter plots depicting log2(fold-change) (log2(FC)) of gene expression in spleen (a), lung (b) and gut (SI LP) (c) of Treg cells over Tconv cells in DT-treated mice versus those in PBS-treated controls. Genes that are upregulated under DT-treated condition (false discovery rate (FDR) <5% and the value of log2(FC) > 0.585 (1.5-fold) and at least 0.585 higher than the value of log2(FC) under the PBS-treated control condition). Genes are downregulated under the DT-treated condition (FDR < 5% and the value of log2(FC) < −0.585 and at least 0.585 lower than the value of log2(FC) under the PBS-treated control condition). d,g, Venn diagrams demonstrating genes upregulated (d) or downregulated (e) in different tissue-specific Treg cells from DT-treated mice. Numbers represent gene numbers. f,g, Dot plot of GO term enrichment analysis of DEGs upregulated (f) or downregulated (g) in tissue Treg cell subsets. MHC, Major histocompatibility complex; REM, rapid eye movement. Colors indicate the P values from Fisher’s exact test and dot size is proportional to the number of DEGs in a given biological process.
Fig. 2 |
Fig. 2 |. Identification of IL-27 not IL-35 as a potential suppressor molecule specifically produced by intestinal Treg cells under autoimmune inflammation.
ac, Violin plots of Il27 (a), Ebi3 (b) and Il12a (c) in Tconv and Treg cells in different tissues from control PBS- or DT-treated Foxp3DTR mice by RNA-seq analysis. df, The qPCR analyses for the expression of Il27 (d), Ebi3 (e) and Il12a (f) in Tconv and Treg cells in different tissues from control PBS- or DT-treated mice. Each symbol represents an individual mouse (n = 5). g,h, ELISA of the production of IL-27 (g) or IL-35 (h) by Tconv and Treg cells in different tissues from control PBS- or DT-treated mice. i,j, The qPCR analyses for the expressions of Il27 (i) and Ebi3 (j) in Tconv and Treg cells in SI from control PBS- or aCD3-treated SPF or GF mice. Each symbol represents a FACS-isolated cell sample pooled from two to three mice (n = 4). k, ELISA analyses of the production of IL-27 by Tconv and Treg cells in SI LP from control PBS- or aCD3 monoclonal antibody-treated SPF and GF mice. Each symbol represents a FACS-isolated cell sample pooled from two to three mice (n = 2 for SPF and 3 for GF). The dotted line represents the minimum detection limit of the indicated cytokine. The data are presented as mean values ± s.d. In d, *P = 0.0164 (up), 0.0187 (middle) and 0.0173 (bottom). In e, ***P = 0.0004 (up), 0.0007 (middle) and 0.0008 (bottom). In g, ****P < 0.0001 (top), 0.0003 (middle) and 0.0003 (bottom). In i, *P = 0.0351 (left) and 0.0394 (right). In j, *P = 0.0467 (left) and 0.0193 (right). In k, *P = 0.0413 (left) and 0.0207 (right). Statistical significance was determined using a two-tailed, unpaired Student’s t-test.
Fig. 3 |
Fig. 3 |. A selective defect in regulating intestinal TH17 cell responses in mice harboring Treg cells incapable of producing IL-27.
a, FACS analysis, frequencies and numbers of Foxp3+ Treg cells gated on the live CD4+ population in SI LP of Foxp3CreIl27fl/fl mice and WT littermates (age ~8–12 weeks). Each symbol represents an individual mouse (n = 10 for Foxp3CreIl27+/+ and 8 for Foxp3CreIl27fll/fl). b,c, FACS analysis (b) and percentage of suppression of proliferation (c) of WT Tconv cells by SI LP Treg cells isolated from either WT or Foxp3CreIl27fl/fl mice in an in vitro suppression assay. Data represent three independent experiments (n = 2). dg, FACS analysis and frequencies of Ki67+ (d), CD44hiCD62Llo (e), IL-17+ (f) and IFN-γ+ Tconv (g) cells gated on the live CD4+Foxp3 population in SI LP of Foxp3CreIl27fl/fl mice and WT littermates (age ~8–12 weeks). Each symbol represents an individual mouse (n = 10 for Foxp3CreIl27+/+ and 8 for Foxp3CreIl27fll/fl). h,i, FACS analysis and frequencies of IL-17+ (h) and IFN-γ+Ly5.1+ (i) Teff cells (isolated from Ly5.1+Foxp3KO mice) gated on the live CD4+ population in SI LP of RAG-deficient mice 3 weeks after being co-transferred with Treg cells isolated from either Foxp3CreIl27fl/fl mice or WT littermates. Each symbol represents an individual mouse (n = 10 for Foxp3CreIl27+/+ and 12 for Foxp3CreIl27fll/fl). Data are presented as mean values ± s.d. In a, NS (not significant) = 0.8805 (left) and 0.7346 (right). In d, NS = 0.6613. In e, NS = 0.6285. In f, *P = 0.0196. In g, NS = 0.7544. In h, *P = 0.0391. In I, NS = 0.5283. Statistical significance was determined using a two-tailed, unpaired Student’s t-test.
Fig. 4 |
Fig. 4 |. Loss of Treg cell-derived IL-27 led to exacerbated intestinal inflammation and colitis-associated cancer.
a, Percentage of body weight change of Foxp3CreIl27fl/fl mice and WT littermates after aCD3 monoclonal antibody administration. Each symbol represents the average of mice from four independent experiments (n = 16 for Foxp3CreIl27+/+ and 18 for Foxp3CreIl27fll/fl). b, Four days after initial aCD3 monoclonal antibody injection, small intestine sections from the mice were stained with H&E for microscopic imaging. Scale bar, 100 μm. Data represent four independent experiments. c, Semiquantitative scoring of histopathology. Each symbol represents an individual mouse (n = 6). df, FACS analysis and frequencies of Foxp3+ Treg cells (d), IL-17+ Tconv cells (e) and IFN-γ+ Tconv cells (f) gated on the live CD4+Foxp3 population in SI LP of aCD3 monoclonal antibody-treated Foxp3CreIl27fl/fl mice and WT littermates. Each symbol represents an individual mouse (n = 10 for Foxp3CreIl27+/+ and 7 for Foxp3CreIl27fll/fl). g, Representative colonic photos from Foxp3CreIl27fl/fl mice and WT littermates 12 weeks after AOM/DSS treatment. Data represent three independent experiments. h, Numbers and area of colorectal tumors in Foxp3CreIl27fl/fl mice and WT littermates. i, Semiquantitative scoring of histopathology. Each symbol represents an individual mouse (n = 7 for Foxp3CreIl27+/+ and 11 for Foxp3CreIl27fll/fl). j,k, FACS analysis and frequencies of IL-17+ (j) and IFN-γ+ (k) Tconv cells gated on the live CD4+Foxp3 population in LI LP or colorectal tumors of Foxp3CreIl27fl/fl mice and WT littermates 12 weeks after AOM/DSS treatment. Each symbol represents an individual mouse (n = 8 for Foxp3CreIl27+/+ and 11 for Foxp3CreIl27fll/fl). Data are presented as mean values ± s.d. In a, ****P < 0.0001. In c, *P = 0.0187. In d, NS = 0.2424. In e, ***P = 0.0008. In f, NS = 0.05. In h, **P = 0.0051 (left) and 0.004 (right). In i, *P = 0.0363. In j, *P = 0.0278 (up) and 0.0101 (bottom). In k, NS = 0.1307 (up) and 0.3073 (bottom). Statistical significance was determined using a two-tailed, unpaired Student’s t-test.
Fig. 5 |
Fig. 5 |. Treg cell-derived IL-27 is dispensable for controlling TH17 cell-driven EAE.
a,b, FACS analysis and frequencies of IL-17+ (a) and IFN-γ+ (b) Tconv cells gated on the live CD4+Foxp3 population in the brain of CD4CreIl27rafl/fl mice and WT littermates 21 d after EAE induction. Each symbol represents an individual mouse (n = 10 for CD4CreIl27ra+/+ and 14 for CD4CreIl27rafll/fl). c, The disease severity scored regularly based on clinical symptoms. Each symbol represents the average of mice from three independent experiments (n = 9 for CD4CreIl27ra+/+ and 14 for CD4CreIl27rafll/fl). d,e, FACS analysis and frequencies of IL-17+ (d) and IFN-γ+ (e) Tconv cells gated on the live CD4+Foxp3 population in the brain of Foxp3CreIl27fl/fl mice and WT littermates 21 d after EAE induction. Each symbol represents an individual mouse (n = 5 for Foxp3CreIl27+/+ and 9 for Foxp3CreIl27fll/fl). f, The disease severity scored regularly based on clinical symptoms. Each symbol represents the average of mice from two independent experiments (n = 5 for Foxp3CreIl27+/+ and 11 for Foxp3CreIl27fll/fl). Data are presented as mean values ± s.d. In a, ****P < 0.0001. In b, NS = 0.0944. In c, *P = 0.0203 (day 18), 0.0220 (day 19), 0.0044 (day 20) and 0.0077 (day 21). In d, NS = 0.5026. In e, NS = 0.2346. Statistical significance was determined using a two-tailed, unpaired Student’s t-test.
Fig. 6 |
Fig. 6 |. Enhanced IL-17 responses in mice with Treg cell-specific IL-27 ablation selectively helped protect against enteric bacterial infection.
a,b, FACS analysis and frequencies of IL-17+ (a) and IFN-γ+ (b) Tconv cells gated on the live CD4+Foxp3 population in LI LP of Foxp3CreIl27fl/fl mice and WT littermates at day 10 post-C. rodentium infection. Each symbol represents an individual mouse (n = 13 for Foxp3CreIl27+/+ and 16 for Foxp3CreIl27fll/fl). c, Enumeration of C. rodentium in the LI of Foxp3CreIl27fl/fl mice and WT littermates at day 10 post-C. rodentium infection. Each symbol represents an individual mouse (n = 8 for Foxp3CreIl27+/+ and 9 for Foxp3CreIl27fll/fl). d,e, FACS analysis and frequencies of IL-17+ (d) and IFN-γ+ (e) Tconv cells gated on the live CD4+Foxp3 population in SI LP of Foxp3CreIl27fl/fl mice and WT littermates at day 8 post-T. gondii infection. Each symbol represents an individual mouse (n = 13 for Foxp3CreIl27+/+ and 14 for Foxp3CreIl27fll/fl). f, The qPCR analysis of parasite burden in SI of Foxp3CreIl27fl/fl mice and WT littermates at day 8 post-T. gondii infection. Each symbol represents an individual mouse (n = 8 for Foxp3CreIl27+/+ and 7 for Foxp3CreIl27fll/fl). Data are presented as mean values ± s.d. In a, **P = 0.0013. In b, *P = 0.0187. In c, *P = 0.0221. In d, *P = 0.0368. In e, NS = 0.3574. In f, NS = 0.8449. Statistical significance was determined using a two-tailed, unpaired Student’s t-test.
Fig. 7 |
Fig. 7 |. Single-cell analyses identify a putative IL-27-producing Treg cell subset in the inflammatory intestinal tissue.
a, UMAP plots of intestinal Treg cell clusters, colored by cluster identity. b, Heatmap of the top ten DEGs between each intestinal Treg cell cluster. c, Percentage of cells within each intestinal Treg cell cluster from mice with or without C. rodentium infection. dg, Violin plots of Il27 (d), Ebi3 (e), Cd83 (f) and Tcf7 (g) in different intestinal Treg cell clusters from C. rodentium-infected mice. h, FACS analysis of intestinal CD4+Foxp3+ Treg cell clusters based on the expression of CD83 and TCF1. i, Representative FACS profiles with gating strategy for isolating different intestinal Treg cell subsets based on the expression of CD83 and CD62L. jl, The qPCR analyses for the expressions of Il27 (j), Ebi3 (k) and Il10 (l) in different Treg cell subsets in spleen (Spl) or LI LP from C. rodentium-infected mice. Each symbol represents a FACS-isolated cell sample pooled from three mice (n = 5). Data are presented as mean values ± s.d. In j, *P = 0.0441 (up) and 0.0186 (bottom left), and NS = 0.0806 (bottom right). In k, ***P = 0.0005 (up), NS = 0.1380 (bottom left) and *P = 0.0178 (bottom right). In l, NS = 0.2260 (up), and ****P < 0.0001 (bottom left) and < 0.0001 (bottom right). Statistical significance was determined using a two-tailed, unpaired Student’s t-test.

Update of

References

    1. Josefowicz SZ, Lu LF & Rudensky AY Regulatory T cells: mechanisms of differentiation and function. Annu. Rev. Immunol 30, 531–564 (2012). - PMC - PubMed
    1. Campbell DJ & Koch MA Phenotypical and functional specialization of FOXP3+ regulatory T cells. Nat. Rev. Immunol 11, 119–130 (2011). - PMC - PubMed
    1. Munoz-Rojas AR & Mathis D Tissue regulatory T cells: regulatory chameleons. Nat. Rev. Immunol 21, 597–611 (2021). - PMC - PubMed
    1. Arpaia N et al. A distinct function of regulatory T cells in tissue protection. Cell 162, 1078–1089 (2015). - PMC - PubMed
    1. Burzyn D et al. A special population of regulatory T cells potentiates muscle repair. Cell 155, 1282–1295 (2013). - PMC - PubMed