. 2023 Nov 6;22(1):177.
doi: 10.1186/s12943-023-01837-4.

Targeting FLT3-TAZ signaling to suppress drug resistance in blast phase chronic myeloid leukemia

Affiliations

Targeting FLT3-TAZ signaling to suppress drug resistance in blast phase chronic myeloid leukemia

Ji Eun Shin et al. Mol Cancer. .

Abstract

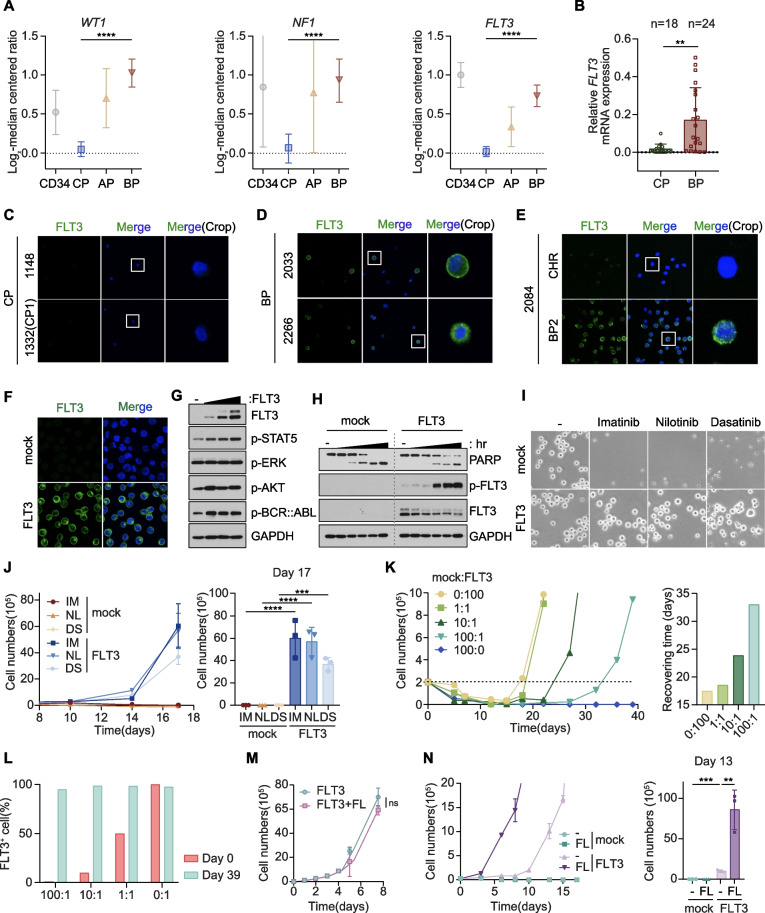
Background: Although the development of BCR::ABL1 tyrosine kinase inhibitors (TKIs) rendered chronic myeloid leukemia (CML) a manageable condition, acquisition of drug resistance during blast phase (BP) progression remains a critical challenge. Here, we reposition FLT3, one of the most frequently mutated drivers of acute myeloid leukemia (AML), as a prognostic marker and therapeutic target of BP-CML.

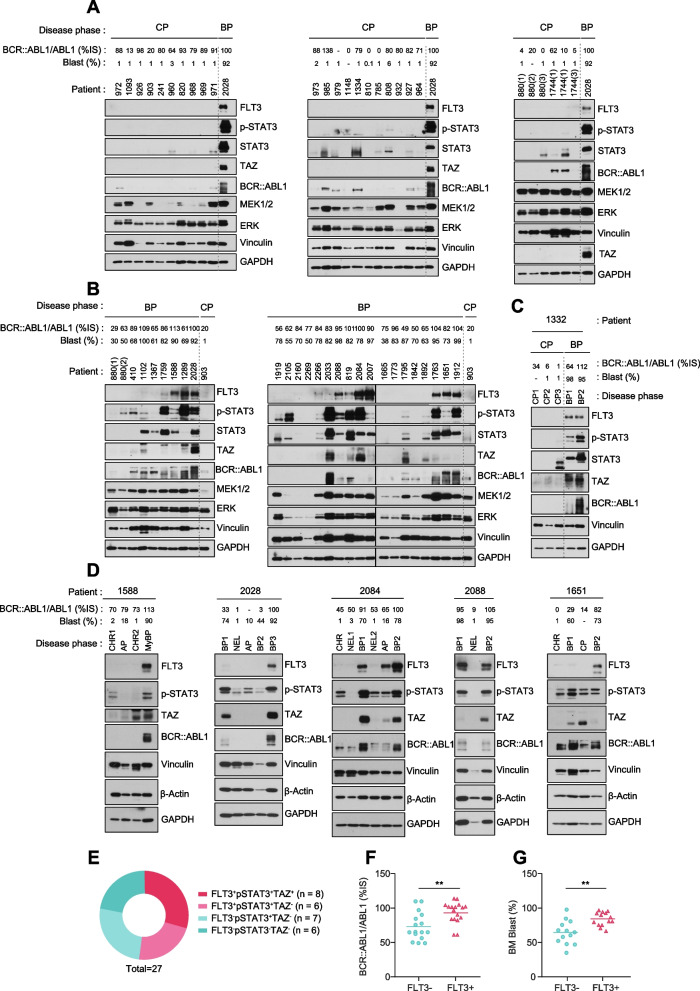
Methods: We generated FLT3 expressing BCR::ABL1 TKI-resistant CML cells and enrolled phase-specific CML patient cohort to obtain unpaired and paired serial specimens and verify the role of FLT3 signaling in BP-CML patients. We performed multi-omics approaches in animal and patient studies to demonstrate the clinical feasibility of FLT3 as a viable target of BP-CML by establishing the (1) molecular mechanisms of FLT3-driven drug resistance, (2) diagnostic methods of FLT3 protein expression and localization, (3) association between FLT3 signaling and CML prognosis, and (4) therapeutic strategies to tackle FLT3+ CML patients.

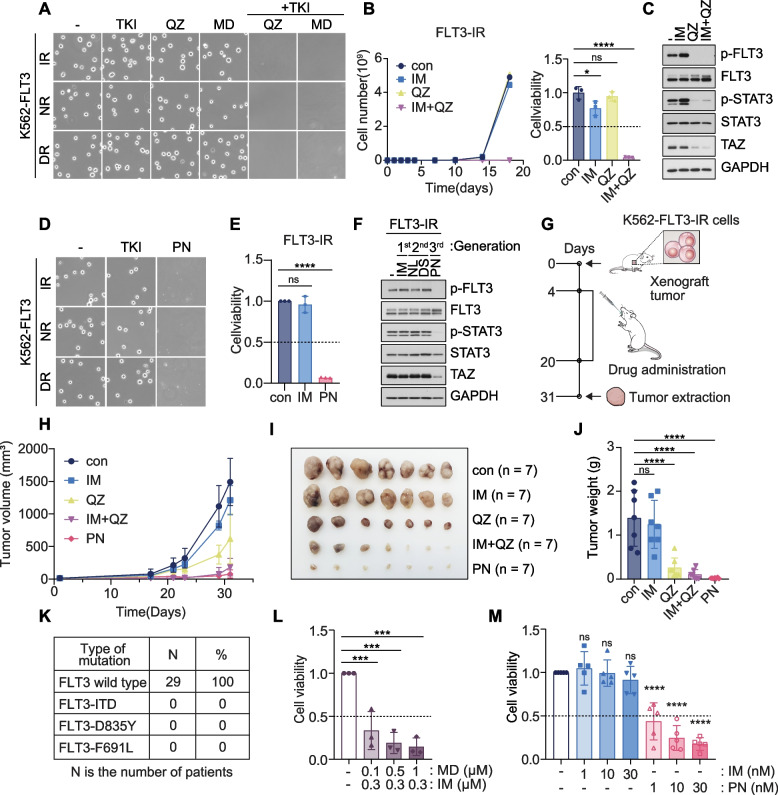
Results: We reposition the significance of FLT3 in the acquisition of drug resistance in BP-CML, thereby, newly classify a FLT3+ BP-CML subgroup. Mechanistically, FLT3 expression in CML cells activated the FLT3-JAK-STAT3-TAZ-TEAD-CD36 signaling pathway, which conferred resistance to a wide range of BCR::ABL1 TKIs that was independent of recurrent BCR::ABL1 mutations. Notably, FLT3+ BP-CML patients had significantly less favorable prognosis than FLT3- patients. Remarkably, we demonstrate that repurposing FLT3 inhibitors combined with BCR::ABL1 targeted therapies or the single treatment with ponatinib alone can overcome drug resistance and promote BP-CML cell death in patient-derived FLT3+ BCR::ABL1 cells and mouse xenograft models.

Conclusion: Here, we reposition FLT3 as a critical determinant of CML progression via FLT3-JAK-STAT3-TAZ-TEAD-CD36 signaling pathway that promotes TKI resistance and predicts worse prognosis in BP-CML patients. Our findings open novel therapeutic opportunities that exploit the undescribed link between distinct types of malignancies.

Keywords: AML; Blast phase; CD36; CML; Cancer; Drug resistance; FLT3; Hippo-YAP/TAZ pathway; Midostaurin; Ponatinib.


Conflict of interest statement

The authors declare that they have no competing interests.

Figures

Fig. 1
Fig. 1
FLT3 activation in BP-CML cells promotes drug resistance to BCR::ABL1 TKI. A Analysis of the most highly increased AML driver genes in BP compared to CP-CML patients. The CML patients’ expression data were obtained from the NCBI Gene Expression Omnibus database (Accession no. GSE4170). Normal CD34 + cells (CD34), n = 7; CP, n = 57; AP, n = 9; BP, n = 33. p-values were calculated using one-way ANOVA with Bonferroni corrections for multiple comparisons. Error bars are means of  ± SD. ****p < 0.0001. B qPCR analysis of FLT3 mRNA levels in CP (n = 18) and BP (n = 24) CML patient cells. p-values were calculated using Student’s t-test and error bars are means of ± SD. **p < 0.01. C-E Immunofluorescence images of the cell surface localization of FLT3 (green) in BMMC samples derived from BP-CML patients 2033, 2266, and 2084 (BP2) compared to CP-CML samples 1148, 1332 (CP1), and 2084 (CHR). DAPI (blue) was used as a nuclear marker. CHR, complete hematological response. F Immunofluorescence images of the ectopic expression of FLT3 (green) on the cell surface in K562 cells. DAPI (blue) was used as a nuclear marker. G Immunoblotting of downstream signaling components induced by dose-dependent FLT3 expression in K562 cells. H Immunoblotting of imatinib-induced apoptosis in K562-mock and -FLT3 cells. PARP cleavage was measured in cells treated with 1 μM imatinib for 6, 18, 24, 28 and 72 h. I and J Cell images at day 17 (I) and growth curves (J) of control and K562-FLT3 cells treated with 1 μM imatinib, 20 nM nilotinib, and 1 μM dasatinib. K Growth curves of K562-FLT3 cells combined with control cells at different ratios (left). Recovery times for each combination after 1 μM imatinib treatment were recorded when cell numbers reached 2 × 105 cells/well (right). L FACS analysis after dilution assay for the measurements of FLT3-positive cell percentages at day 0 and day 39. M Growth curves of K562-FLT3 cells with or without 20 ng/ml FLT3 ligand treatment. ns, not significant (p > 0.05). N Growth curves of control and K562-FLT3 cells treated with 1 μM imatinib with or without 20 ng/ml FLT3 ligand (left). Cell numbers were counted on day 13 (right). **p < 0.01, ***p < 0.001; ns, not significant (p > 0.05). J, M–N All p-values were calculated using Student’s t-test and error bars are means of triplicates ± SD. A p-value of less than 0.05 indicates a statistical difference
Fig. 2
Fig. 2
The Hippo transducers TAZ and TEAD mediate FLT3-induced drug resistance in BP-CML. A PCA analysis of the gene expression profiles of K562-mock, FLT3, FLT3-IR, and -NR cells. B Heatmap showing the relative expression of pro-tumorigenic factors within the major oncogenic pathways (color-coded as indicated in the legend) in RNA-seq data from K562-mock, K562-FLT3, K562-FLT3-IR, and NR cells. C Immunoblotting analysis comparing the expression patterns of various proteins in solid tumors and leukemia cell lines. D and E qPCR analyses of WWTR1 (D) and YAP1 (E) mRNA expression levels in K562-mock, FLT3, FLT3-IR, and FLT3-NR cells. **p < 0.01, ***p < 0.001; ns, not significant (p > 0.05). F Immunoblotting analysis of TAZ and YAP in K562-mock, FLT3, and TKI-resistant FLT3-IR, -NR, and -DR cells. G and H Expression of WWTR1 (G) and YAP1 (H) transcript levels in normal CD34 + cells (CD34) and each CML phase were analyzed from the NCBI Gene Expression Omnibus database (accession no. GSE4170). CD34, n = 7; CP, n = 57; AP, n = 9; BP, n = 33. p-values were calculated using Student’s t-test and error bars are means of ± SD. ***p < 0.001; ns, not significant (p > 0.05). I ChIP-seq analysis showing histone H3K27 acetylation (H3K27ac) profiles for the WWTR1 and YAP1 loci in K562-mock and -FLT3-IR cells. The promoter regions for each gene are highlighted. J Immunoblotting analysis of TAZ induction and FLT3 activation in K562-mock and K562-FLT3 cells treated with FLT3 ligand (0, 10, 30, and 100 ng/ml) for 36 h. K Immunofluorescence images of the nuclear localization TAZ (green) and TEAD (red) in K562-FLT3-IR cells. L Immunoprecipitation analysis identifying the protein–protein interactions between endogenous TAZ with TEAD in K562-FLT3-IR cells. Ectopic expression of flag-TAZ or flag-TAZ-4SA (a constitutively active TAZ mutant) were used as positive controls. TAZ knockout (KO) cells were used as a negative control. M Acquisition of TKI resistance in K562-FLT3 cells transduced with shRNAs targeting TAZ or TEAD. Growth curve of cells treated with 1 μM imatinib (left) and a bar graph showing the indicated cell numbers measured on day 12 (right). ***p < 0.001, ****p < 0.0001. N Restoration of TKI sensitivity in K562-FLT3-IR cells transduced with shRNAs targeting TAZ or TEAD. Growth curve analysis of cells treated with 1 μM imatinib (left) and a bar graph showing the indicated cell numbers measured on day 14 (right). ****p < 0.0001. O Colony formation assay in K562-FLT3 cells treated with 3 μM imatinib and 20 ng/ml FL (left column) and K562-FLT3-IR cells treated with 3 μM imatinib for 3 weeks (right column) after knockdown of TAZ or TEAD. P Growth curves (left) and viability (right) of K562-FLT3 cells treated with 1 μM imatinib with or without TEAD inhibitor YBY-15 (30 μM). ****p < 0.0001. D-E, M–N, P All p-values were calculated using one-way ANOVA with Bonferroni corrections for multiple comparisons (D-E, MN) and Student’s t-test (P). Error bars are means of triplicates ± SD. A p-value of less than 0.05 indicates a statistical difference
Fig. 3
Fig. 3
Acquisition of TKI resistance via FLT3-JAK-STAT3-TAZ and Hippo-TAZ signaling in BP-CML. A Immunoblotting analysis of FLT3, BCR::ABL1, and their downstream signaling components in spontaneous imatinib-resistant K562 cells (IM-0.4R, 0.4 μM imatinib-resistant cells; IM-1R, 1 μM imatinib-resistant cells) compared to FLT3-mediated TKI-resistant K562-FLT3-IR, -NR, and -DR cells. B and C Representative immunofluorescence images of the nuclear localization of TAZ (green) and p-STAT3 (green) in K562-FLT3-IR cells. D Immunoblotting analysis of FLT3-pSTAT3-TAZ signaling components in K562-FLT3-IR cells treated for 16 h with increasing doses of quizartinib (QZ; 0, 3, 10, 30, 100 nM). E Measurements of TAZ transcript levels in K562-FLT3-IR cells treated for 16 h with 30 nM quizartinib. ****p < 0.0001. F Immunoblotting analysis of FLT3-pSTAT3-TAZ signaling components in K562-FLT3-IR and K562-TAZ cells treated with various doses of midostaurin (MD; 0, 0.1, 0.3 μM) for 16 h. G Immunoblotting analysis of FLT3-pSTAT3-TAZ signaling components in K562-FLT3-IR cells treated with various doses of JAK inhibitor AZD-1480 treatment (AZD; 0, 0.1, 0.3, 1, 3 μM) for 16 h. ***p < 0.001. H Measurements of TAZ transcript levels in K562-FLT3-IR cells treated for 16 h with 2.5 μM AZD-1480. I Immunoblotting analysis of FLT3-pSTAT3-TAZ signaling components in K562-FLT3-IR cells treated with various doses of BP-1–102 (0, 1, 5, 10 μM) for 16 h. J Immunoblotting analysis of FLT3-pSTAT3-TAZ signaling components in MDA-MD-231 breast cancer cells after treatments with 30 nM quizartinib (QZ), 0.3 μM midostaurin (MD), 3 μM AZD-1480 (AZD), and 30 μM C188-9. K Immunoblotting analysis of TAZ protein in control or LATS1/2-depleted K562-FLT3-IR cells treated with the Hippo pathway activators 2-DG (6.25 mM) or LatB (1 μg/ml) for 16 h. s.e, short exposure. L Schematic illustrating the transcriptional and post-translational mechanisms that regulate TAZ in BP-CML. E, H All p-values were calculated using Student’s t-tests and error bars are means of triplicates ± SD. A p-value of less than 0.05 indicates a statistical difference
Fig. 4
Fig. 4
Activation of FLT3-TAZ signaling correlates with less favorable prognosis in BP-CML. A Immunoblotting analysis of FLT3-pSTAT3-TAZ components and BCR::ABL1 in 27 clinical samples derived from CP-CML patients. BP-CML patient sample 2028 was used as a control for comparing protein expression levels between CP and BP patients. CML prognostic factors such as disease phase, BCR::ABL1/ABL1 (%IS), and blast % are indicated above each patient specimen. B Immunoblotting analysis of 27 clinical samples derived from BP-CML patients. CP-CML patient sample 903 was used as a control for comparing protein expression levels between CP and BP patients. C and D Immunoblotting analysis of paired serial samples from individual patients. CHR, complete hematologic response; MyBC, myeloid blast crisis; NEL, no evidence of leukemia. E Pie chart showing the co-expression patterns between FLT3, pSTAT3, and TAZ proteins in BP-CML patients (n = 27). F and G Clinical relevance of FLT3 expression level and prognostic factors for CML, including BCR::ABL1/ABL1 ratio (IS%) (F) and blast percentage (G), in BP-CML patients. FLT3, n = 13; FLT3.+, n = 14. All p-values were calculated using Student’s t-test and error bars are means ± SD. A p-value of less than 0.05 indicates a statistical difference. **p < 0.01
Fig. 5
Fig. 5
The FLT3-TAZ signaling promotes TKI resistance via CD36-mediated fatty acid uptake. A Heatmap analysis of RNA-seq data from K562-mock, -FLT3, and TKI-resistant K562-FLT3-IR and -NR. The most strongly enhanced genes are labeled with red and the canonical YAP/TAZ target genes are labeled with blue. B Venn Diagram of TEAD4 ChIP-seq results comparing the overlap of direct TEAD4 target genes in HEK293A and K562-FLT3-IR cells. C ChIP-seq analysis showing TEAD4 and H3K27ac enrichment at the CD36 promoter region (highlighted) in HEK293A, K562-mock, and K562-FLT3-IR cells. D Immunoblotting analysis of CD36 protein levels in K562-FLT3-IR cells after treatment with TEAD inhibitor YBY-15 (0, 5, 10, 20 μM) for 16 h. E Measurements of CD36 transcript levels in K562-FLT3-IR cells treated with TEAD inhibitors flufenamic acid (Flu; 200 μM) or YBY-15 (15; 30 μM). F Metabolomic analysis of intracellular fatty acid derivatives in K562-FLT3-IR cells compared to K562-mock cells. G Lipid droplet analysis using BODIPY (green) staining in K562-mock and K562-FLT3-IR cells. DAPI (blue) was used as a nucleus marker. H Measurement of cell growth (left) and cell viability (right) in K562-FLT3 cells treated with imatinib (1 μM) treatment with or without CD36 inhibitor, SSO (200 μM). ****p < 0.0001. I Measurement of cell growth (left) and cell viability (right) of K562-FLT3-IR cells treated with normal or fatty acid-free medium with or without imatinib (1 μM). ****p < 0.0001; ns, not significant. E, H-I, All p-values were calculated using one-way ANOVA with Bonferroni corrections for multiple comparisons (E, I) and Student’s t-test (H). Error bars are means of triplicates ± SD. A p-value of less than 0.05 indicates a statistical difference
Fig. 6
Fig. 6
Combined inhibition of BCR::ABL1 and FLT3 suppresses BP-CML tumor growth. A Cell images of TKI-resistant K562-FLT3-IR, -NR, and -DR cells treated with either BCR::ABL1 TKI (1 μM imatinib, 20 nM nilotinib, 1 μM dasatinib), 30 nM quizartinib (QZ), 0.1 μM midostaurin (MD) or the combination of each BCR::ABL1 TKI with either quizartinib or midostaurin for 7 days. B Measurements of cell growth (left) and cell viability (day 18) (right) of K562-FLT3-IR cells subjected to single treatments with vehicle (con), 1 μM imatinib (IM), 30 nM quizartinib (QZ), or the combination of imatinib and quizartinib (IM + QZ). n = 3 per group. *p < 0.05, ****p < 0.0001; ns, not significant. C, Immunoblotting analysis of FLT3-pSTAT-TAZ signaling components in K562-FLT3-IR cells subjected to single treatments with 1 μM imatinib (IM), 30 nM quizartinib (QZ), or the combination of imatinib and quizartinib (IM + QZ) for 16 h. D Cell images of TKI-resistant K562-FLT3-IR, -NR, and -DR cells treated with the indicated BCR::ABL1 inhibitors as in (A) or with 10 nM ponatinib (PN). E Cell viability measurement for K562-FLT3-IR cells treated with 1 μM imatinib (IM) or 10 nM ponatinib (PN) treatment. ****p < 0.0001; ns, not significant (p > 0.05). F Immunoblotting analysis of FLT3-pSTAT-TAZ signaling components in K562-FLT3-IR cells treated with 1 μM imatinib (IM), 20 nM nilotinib (NL), 1 μM dasatinib (DS), or 10 nM ponatinib (PN) for 16 h. G Experimental procedure to analyze the therapeutic efficacy of combined treatment of imatinib and quizartinib (IM + QZ) or single treatment of ponatinib (PN) in K562-FLT3-IR xenograft model. H Tumor growth analysis of K562-FLT3-IR-derived xenografts in NOD/SCID mice treated with either vehicle (con), 100 mg/kg imatinib (IM), 30 mg/kg quizartinib (QZ), 15 mg/kg ponatinib (PN), or the combination of imatinib and quizartinib (IM + QZ). All drugs were delivered by daily oral gavage. n = 3 per group. I and J Tumor images (I) and tumor weights (J) of excised K562-FLT3-IR-derived tumors from each group (n = 7). ****p < 0.0001; ns, not significant. K Analysis of FLT3 driver mutations by cDNA sequencing of BP-CML patient samples. L Cell viability measurement of FLT3+ imatinib-resistant BP-CML patient-derived BMMCs subjected to combined treatment with imatinib (IM) and midostaurin (MD) for 5 days. n = 3 per group. ***p < 0.001. Independent patient information and results are shown in Fig. S5I. M Cell viability measurement of FLT3+ imatinib-resistant BP-CML patient-derived BMMCs subjected to treatment with either imatinib (IM) or ponatinib (PN) for 5 days. n = 5 per group. ****p < 0.0001; ns, not significant. Independent patient information and results are shown in Fig. S5J. B, E, J, L-M All p-values were calculated using one-way ANOVA with Bonferroni corrections for multiple comparisons and error bars are means ± SD. A p-value of less than 0.05 indicates a statistical difference

References

    1. O'Hare T, Zabriskie MS, Eiring AM, Deininger MW. Pushing the limits of targeted therapy in chronic myeloid leukaemia. Nat Rev Cancer. 2012;12:513–526. doi: 10.1038/nrc3317. - DOI - PubMed
    1. Vetrie D, Helgason GV, Copland M. The leukaemia stem cell: similarities, differences and clinical prospects in CML and AML. Nat Rev Cancer. 2020;20:158–173. doi: 10.1038/s41568-019-0230-9. - DOI - PubMed
    1. Innes AJ, Milojkovic D, Apperley JF. Allogeneic transplantation for CML in the TKI era: striking the right balance. Nat Rev Clin Oncol. 2016;13:79–91. doi: 10.1038/nrclinonc.2015.193. - DOI - PubMed
    1. Hehlmann R. How I treat CML blast crisis. Blood. 2012;120:737–747. doi: 10.1182/blood-2012-03-380147. - DOI - PubMed
    1. Soverini S, Mancini M, Bavaro L, Cavo M, Martinelli G. Chronic myeloid leukemia: the paradigm of targeting oncogenic tyrosine kinase signaling and counteracting resistance for successful cancer therapy. Mol Cancer. 2018;17:49. doi: 10.1186/s12943-018-0780-6. - DOI - PMC - PubMed

Publication types

MeSH terms