

Evaluating preschool linear growth velocities: an interim reference illustrated in Nepal
- PMID: 37932904
- PMCID: PMC10755438
- DOI: 10.1017/S1368980023002409
Evaluating preschool linear growth velocities: an interim reference illustrated in Nepal
Abstract
Objective: An annualised linear growth velocity (LGV) reference can identify groups of children at risk of growing poorly. As a single velocity reference for all preschool ages does not exist, we present an interim tool, derived from published, normative growth studies, for detecting growth faltering, illustrating its use in Nepali preschoolers.
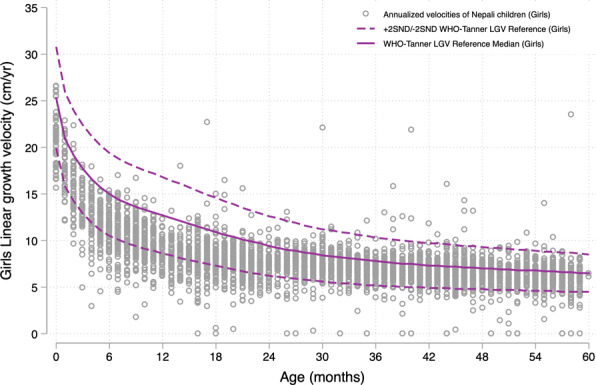
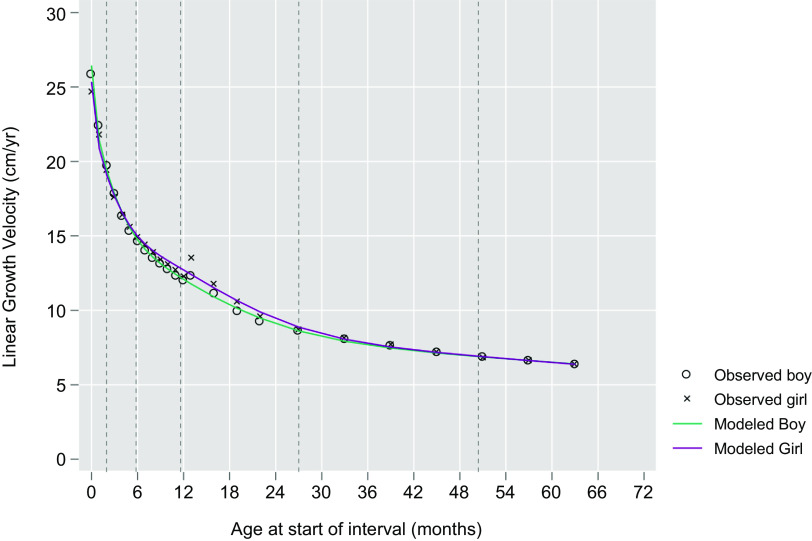
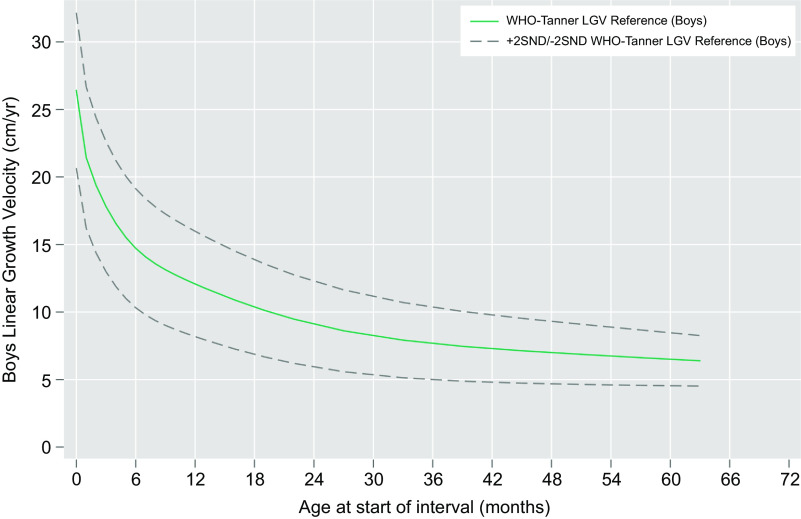
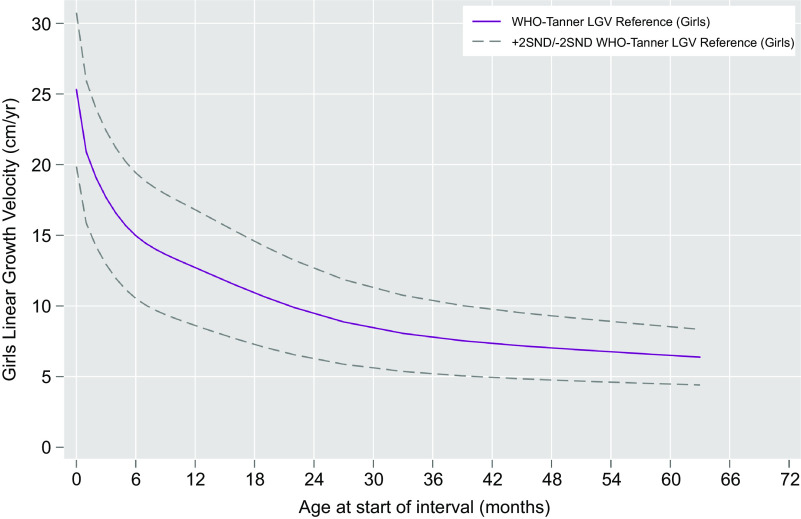
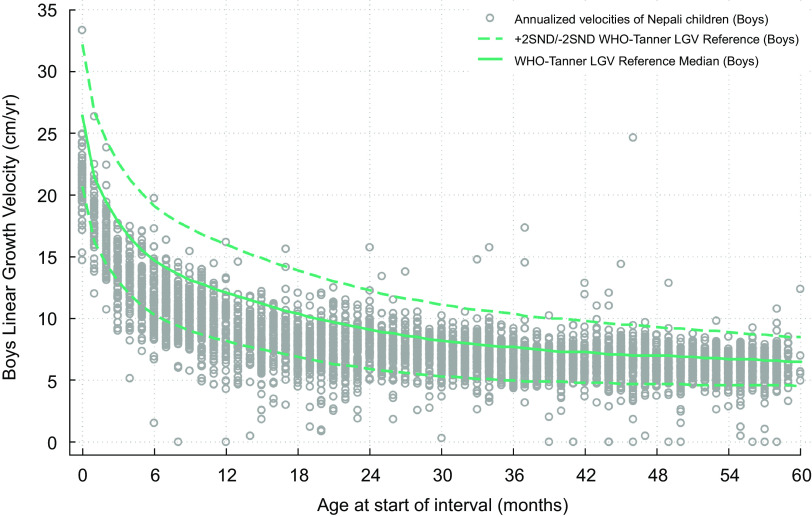
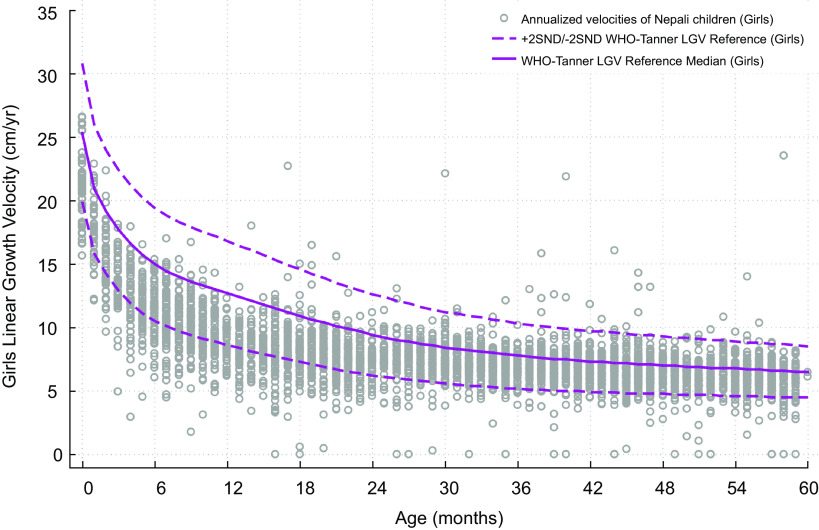
Design: The WHO Child Growth Velocity Standard was adapted to derive 12-month increments and conjoined to the Tanner-Whitehouse Height Velocity Reference data yielding contiguous preschool linear growth annualised velocities. Linear restricted cubic spline regressions were fit to generate sex-specific median and standard normal deviate velocities for ages 0 through 59 months. LGV Z-scores (LGVZ) were constructed, and growth faltering was defined as LGVZ < –2.
Setting: Use of the reference was illustrated with data from Nepal’s Tarai region.
Participants: Children contributing the existing growth references and a cohort of 4276 Nepali children assessed from 2013 to 2016.
Results: Fitted, smoothed LGV reference curves displayed monotonically decreasing 12-month LGV, exemplified by male/female annual medians of 26·4/25·3, 12·1/12·7, 9·1/9·4, 7·7/7·8 and 7/7 cm/years, starting at 0, 12, 24, 36 and 48 months, respectively. Applying the referent, 31·1 %, 28·6 % and 29·3 % of Nepali children <6, 6–11 and 12–23 months of age, and ∼6 % of children 24–59 months, exhibited growth faltering. Under 24 months, faltering velocities were more prevalent in girls (34·4 %) than boys (25·3 %) (P < 0·05) but comparable (∼6 %) in older preschoolers.
Conclusions: A LGV reference, concatenated from extant data, can identify preschool groups at-risk of growth faltering. Application and limitations are discussed.
Keywords: Anthropometry; Growth faltering; Growth velocity reference; Linear growth velocity; Nepal.
Conflict of interest statement
There are no conflicts of interest.
Figures

Similar articles
-
Seasonal growth patterns in rural Nepali children.Ann Hum Biol. 1997 Jan-Feb;24(1):1-18. doi: 10.1080/03014469700004732. Ann Hum Biol. 1997. PMID: 9022902
-
Growth velocity and stunting in rural Nepal.Arch Dis Child. 1989 Oct;64(10):1478-82. doi: 10.1136/adc.64.10.1478. Arch Dis Child. 1989. PMID: 2817933 Free PMC article.
-
Early linear growth retardation: results of a prospective study of Zambian infants.BMC Public Health. 2019 Jan 14;19(1):61. doi: 10.1186/s12889-019-6411-3. BMC Public Health. 2019. PMID: 30642306 Free PMC article.
-
Approaches to detecting growth faltering in infancy and childhood.Ann Hum Biol. 2003 Sep-Oct;30(5):499-519. doi: 10.1080/0301446032000112698. Ann Hum Biol. 2003. PMID: 12959893 Review.
-
Socioeconomic Status Influences Functional Severity of Untreated Cerebral Palsy in Nepal: A Prospective Analysis and Systematic Review.Clin Orthop Relat Res. 2019 Jan;477(1):10-21. doi: 10.1097/CORR.0000000000000476. Clin Orthop Relat Res. 2019. PMID: 30179955 Free PMC article.
References
-
- WHO (2014) Global Nutrition Targets 2025: Policy Brief Series (WHO/NMH/NHD/14.2). Geneva: WHO.
-
- United Nations Children’s Fund, World Health Organization & The World Bank (2022) Levels and Trends in Child Malnutrition: Key Findings of the 2022 Edition of the Joint Child Malnutrition Estimates. Geneva: UNICEF, WHO, World Bank.
-
- Torlesse H, Rasheed R & Aguayo VM (2018) Child Stunting, Hidden Hunger and Human Capital in South Asia: Implications for Sustainable Development Post 2015. Kathmandu: UNICEF.
-
- UNICEF ROSA (2018) Stop Stunting: South Asia Headline Results 2018–2021. https://unicefrosa-progressreport.azurewebsites.net/stopstunting.html (accessed June 2023).
-
- Angela KC, Thorne-Lyman A, Manohar S et al. (2020) Preschool child nutritional status in Nepal in 2016: a national profile and 40-year comparative trend. Food Nutr Bull 41, 152–166. - PubMed
MeSH terms
LinkOut - more resources
Full Text Sources
Medical
Research Materials
